


Tax receipts are falling, which has historically preceded economic recessions. In a recent #MacroView post, we discussed the issue of rising debt levels on economic growth and increasing debt levels. To wit:
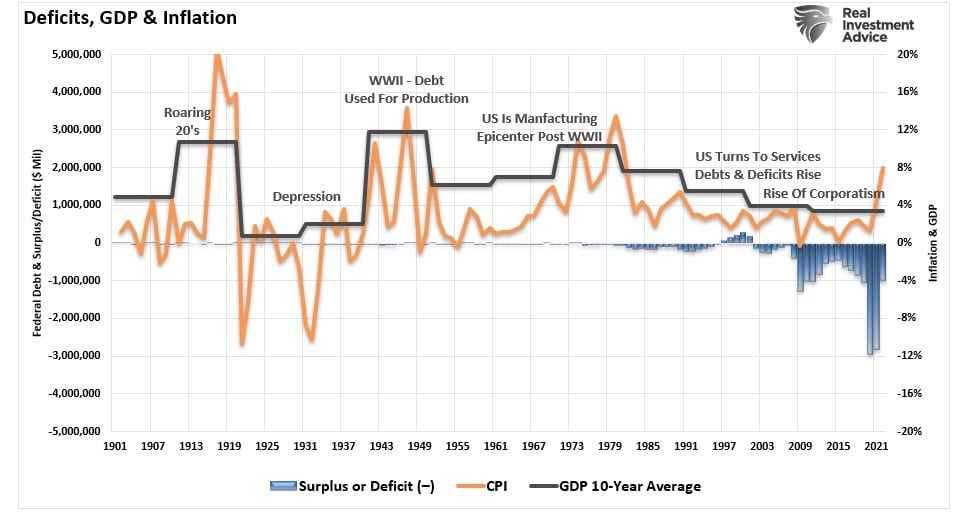
“While Washington continues a seemingly unbridled spending spree under the assumption ‘more spending’ is better, debts and deficits matter. To better understand the impact of debt and deficits on economic growth, we must know where we came from. The chart shows the 10-year annualized growth rate of the economy over time.
What should immediately jump out at you is that the 10-year average economic growth rate was around 8%, except for the Great Depression era, from 1900 through 1990. However, there has been a marked decline in economic growth since then.”
As noted in that post, the problem of rising debt and deficits is two-fold.
“First, ‘deficit spending’ was only supposed to be used during a recessionary period and reversed to a surplus during the subsequent expansion. However, beginning in the early ’80s, those in power only adhered to the ‘deficit spending part.’ After all, ‘if a little deficit spending is good, a lot should be better,’ right?
Secondly, deficit spending shifted away from productive investments, which create jobs (infrastructure and development), to primarily social welfare and debt service. Money used in this manner has a negative rate of return.”
Adding to the deficit problem is the aging demographic, which is increasingly dependent on Government welfare programs for more than 50% of their incomes. According to the Center On Budget & Policy Priorities, roughly 88% of every tax dollar goes to non-productive spending.
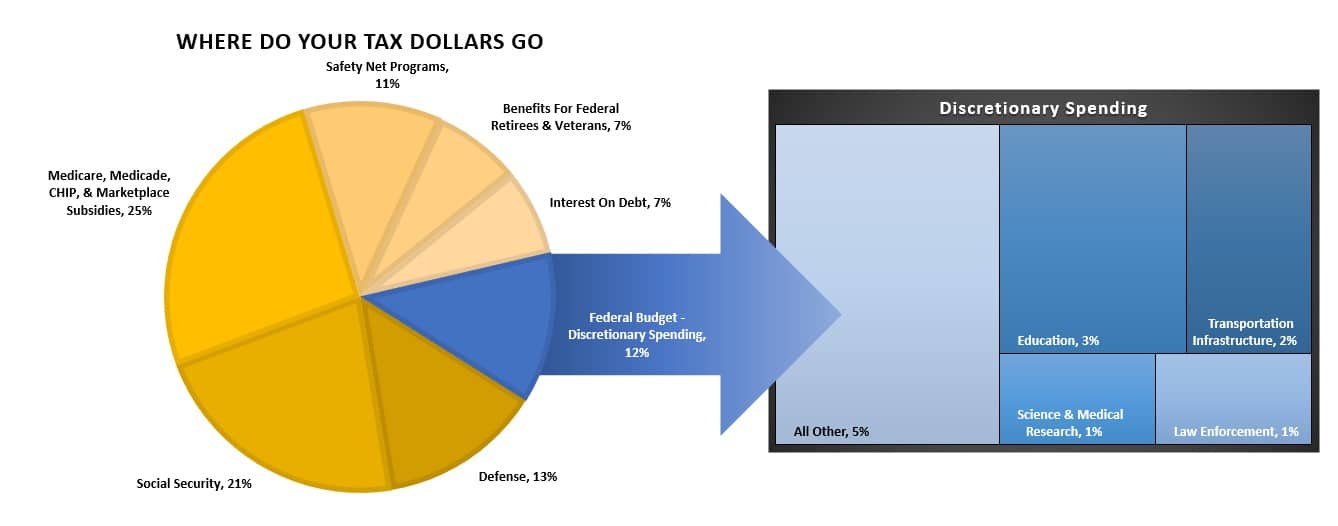
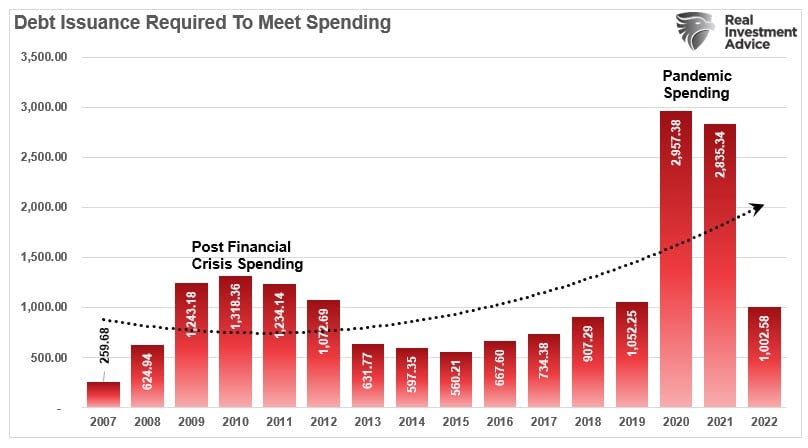
Here is the real kicker. In 2022, the Federal Government spent $6 Trillion, equivalent to almost 20% of the nation’s entire nominal GDP (19.74% to be exact.) Of that total spending, ONLY $5 Trillion was financed by Federal revenues, and $1 Trillion was funded through debt. In other words, if 88% of all expenditures is social welfare and interest on the debt, those payments require $5.3 Trillion of the $5 Trillion (or 105%) of revenue.
However, that was as of the end of 2022. Since the turn of the calendar, the combination of higher interest rates and inflation on the consumer is leading to increasingly slower economic activity. As the economy slows, revenues and incomes decline. Given that Federal taxes are collected on individual and corporate incomes, Federal tax receipts can tell us much about the actual strength of the economy.

Tax Receipts As A Recessionary Indicator
One of the conundrums in 2023 remains the avoidance of a recessionary impact from the Fed’s aggressive rate hiking campaign. Numerous indicators, from the leading economic index to the yield curve, suggest a high probability of an economic recession, but one has yet to occur. One explanation for this has been the surge in Federal expenditures since the end of 2022 stemming from the Inflation Reduction Act. The second reason is that GDP was so grossly elevated from the $5 Trillion in previous fiscal policies that the lag effect is taking longer than historical norms to resolve.
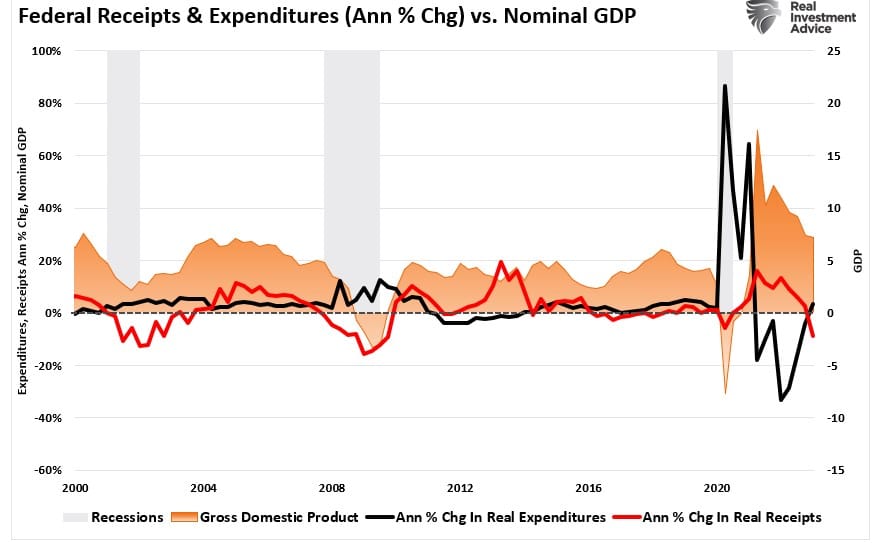
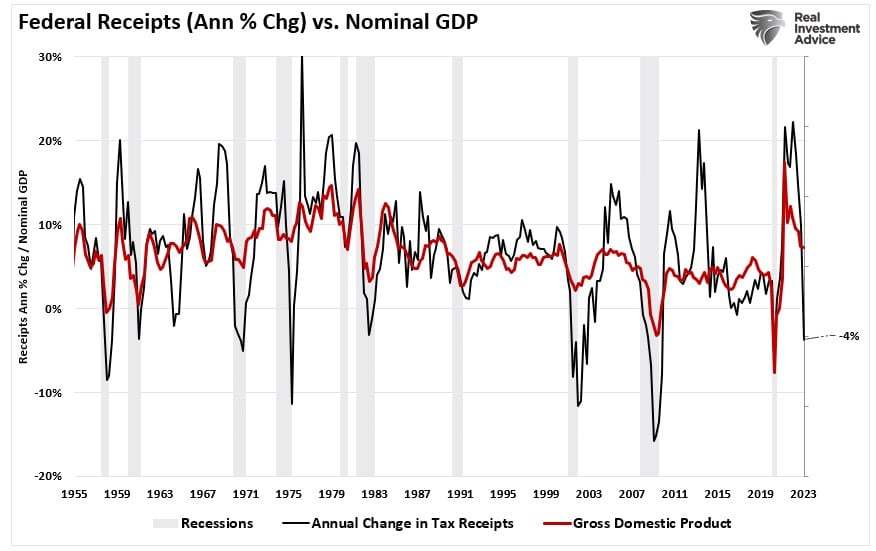
However, that red line in the chart above is the most interesting. Notice that while Federal expenditures are rising, Federal tax receipts are falling. Such is why the national deficit is increasing.
The change in Federal receipts is important as the Government’s revenue is from the taxes on both corporate and individual incomes. Unsurprisingly, if revenues and incomes decline, such would reflect economic activity. As shown below, there is a very high correlation between the annual change in Federal receipts and economic growth. Historically, when the yearly change in Federal receipts falls below 2% annual growth, such has preceded economic recessions. Federal receipts’ yearly rate of change is currently a negative four percent (-4%).
We see the exact correlation by smoothing the data and using inflation-adjusted tax receipts on a 24-month rate of change. Again, a recession follows when tax receipts fall below 2% annual growth rates. I like this measure better as it accounts for the “lag effect” in the economy. The 2-year yearly change in receipts has fallen to the 2% warning line. Such explains why the recession has not occurred yet.
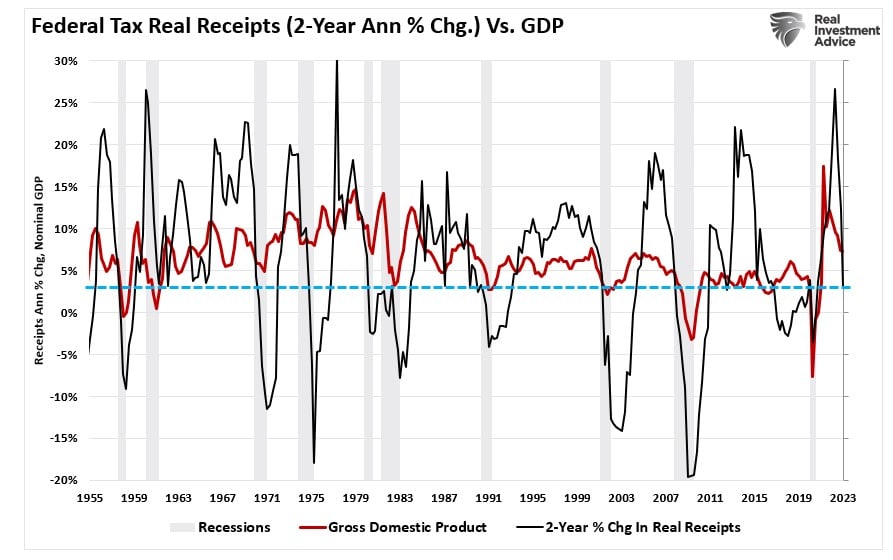
Note: California’s tax payments are delayed due to the emergency declaration. However, that doesn’t account for the magnitude of the decline in filings. Secondly, given the shuttering of the entire economy in 2020, which also delayed filings nationwide, the extent of the current decrease seems more than just a single event.
Nonetheless, for investors, the implications should be evident.

Stocks Tend To Follow The Deficit
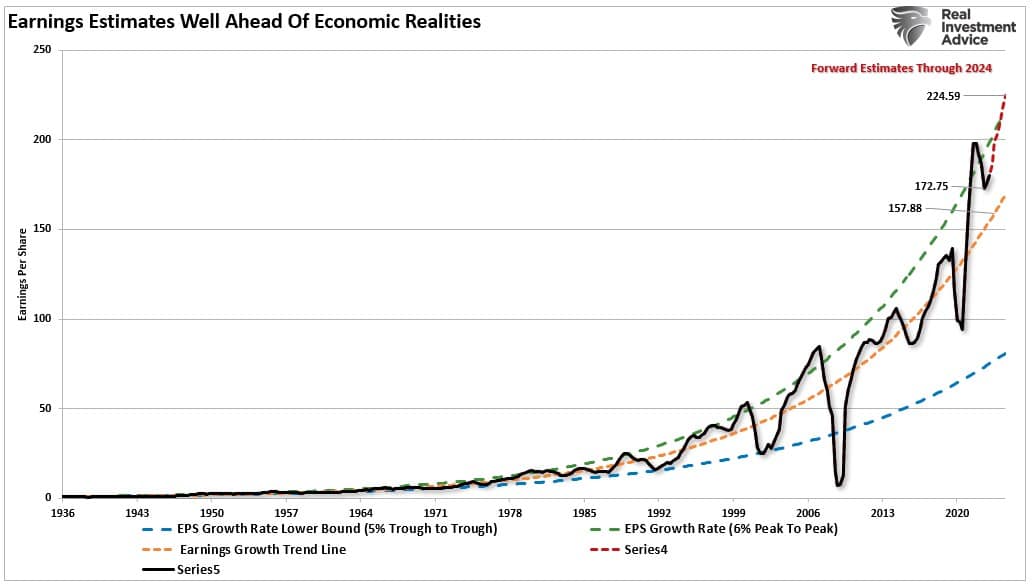
If tax receipts are falling, such suggests that economic activity is slowing, ultimately impacting earnings growth. As noted recently, investors have become quite exuberant that the economy will avoid a recession and earnings growth will return. To wit:
“Analysts have raised future earnings estimates, but the underlying data does not necessarily support such. More importantly, there is a limit to how much companies can ‘massage’ the bottom-line earnings if top-line sales growth slows. As higher rates continue to weigh on consumption, particularly in a highly indebted economy, the risk of a slowdown in sales remains elevated. If that statement is valid, the earnings must decline to align with organic economic activity. Such is why, historically, a reversion eventually occurs when earnings are well deviated above the long-term growth trend.
While anything is certainly possible, the surge in analysts’ estimates since the end of 2022 seems based more on ‘hope’ than economic realities.”
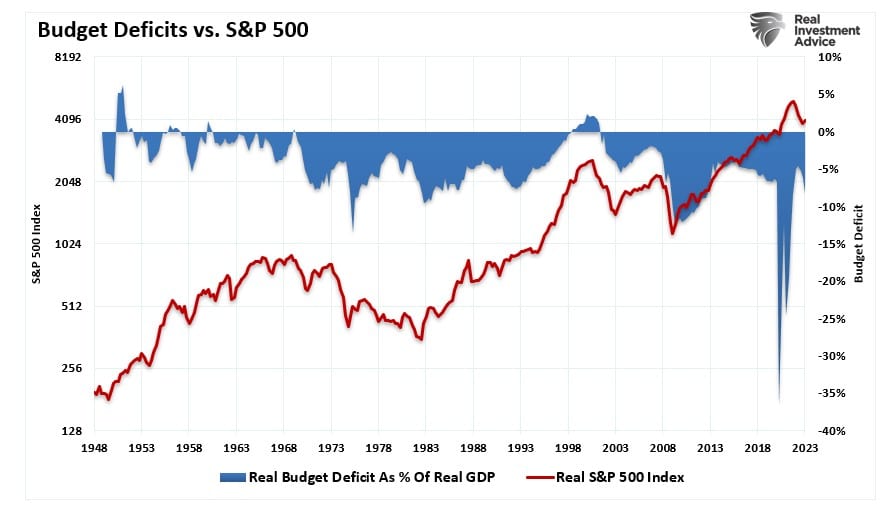
Analysts will likely be disappointed over the next year because the stock market tends to correlate to the deficit. As the deficit grows, such will translate into slower earnings growth and a repricing of risk. With the deficit-increasing, such will also push the Federal Reserve to pressure rates lower to cut the Governments interest expense.
While many indicators suggest a recession is coming, pay close attention to tax receipts. The rising debt levels and increased servicing costs will act as a brake on economic growth. A point recently made by Dr. Lacy Hunt:
“Excessive indebtedness acts as a tax on future growth. It is also consistent with Hyman Minsky’s concept of ‘Ponzi finance.‘ Such means the size and type of debt being added cannot generate a cash flow to repay principal and interest. While the debt has not resulted in the sustained instability in financial markets envisioned by Minsky, the slow reduction in economic growth and the standard of living is more insidious.“
This is simply something the stock market will likely not be able to avoid.


Lance Roberts is a Chief Portfolio Strategist/Economist for RIA Advisors. He is also the host of “The Lance Roberts Podcast” and Chief Editor of the “Real Investment Advice” website and author of “Real Investment Daily” blog and “Real Investment Report“. Follow Lance on Facebook, Twitter, Linked-In and YouTube
Customer Relationship Summary (Form CRS)
Also Read


