
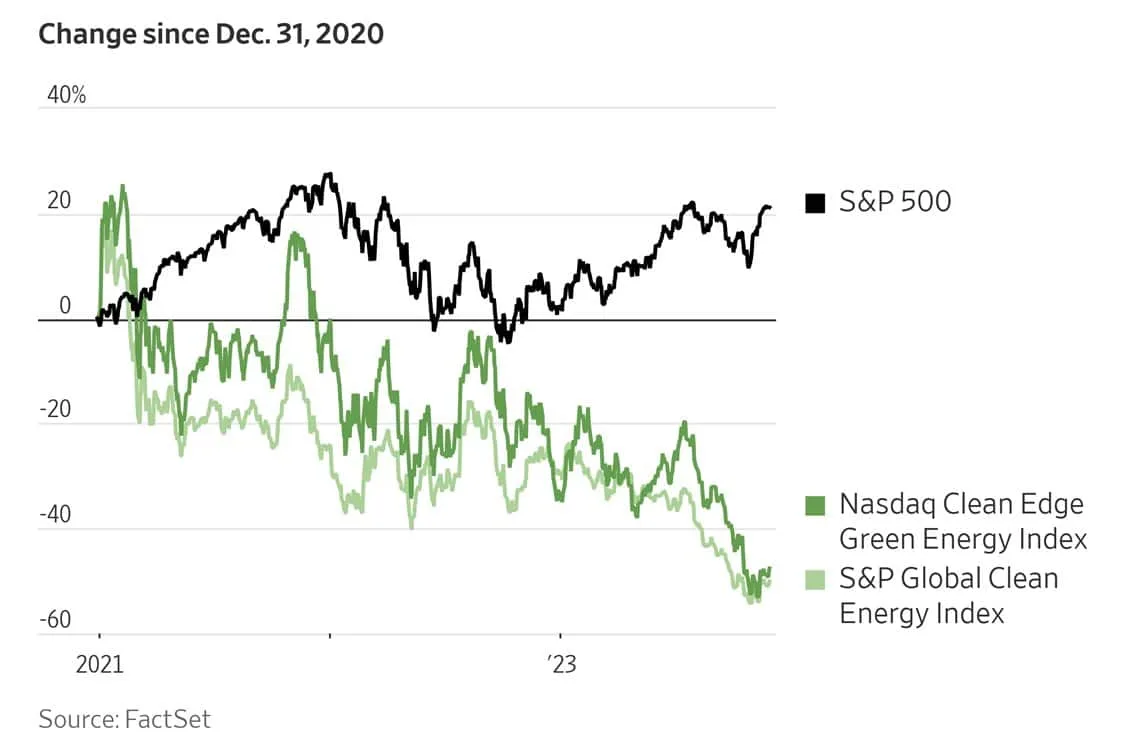
When President Biden took office, investors assumed clean energy would be a top priority. Therefore, clean energy stocks should do very well. The narrative made sense. As shown below, clean energy stocks were up over 20% in the first few months of Biden’s term. Those gains, however, didn’t last. Since then, clean energy stocks are about 50% lower. In our Commentary – Is The Lithium Crash A Buying Opportunity?, we discuss the free-falling price of lithium and the stock price of the world’s largest lithium producer, Albermarle. The message is that narratives, right or wrong, can push stock prices well above their fair values at times. Clean energy will be a solid growth industry, and some stocks will benefit greatly. However, as we learned with many tech stocks in 2000, the market often gets well ahead of itself. Such is the case with green energy.
Microsoft (MSFT) provides a lesson about an outstanding company with a stock price getting ahead of itself. On the eve of the dot-com bust, MSFT had risen ten fold since 1995 and had P/E and P/S ratios of 84 and 55, respectively. Meeting such valuations would entail massive growth. Once the market cracked, MSFT fell by two-thirds. It took 13 years to retain prior highs. In the late 90’s the promise of the internet pushed MSFT shares beyond what should have been reasonably expected at that time. MSFT lived up to the hype. Today it trades at 10x the 1999 peak. Investors were eventually paid handsomely, but short to medium term traders enamored with the narrative and ignorant of fundamentals, there was a hefty to price to pay. Such may hold for clean energy. Many clean energy stocks may be precious, but their valuations rose too fast.
What To Watch Today
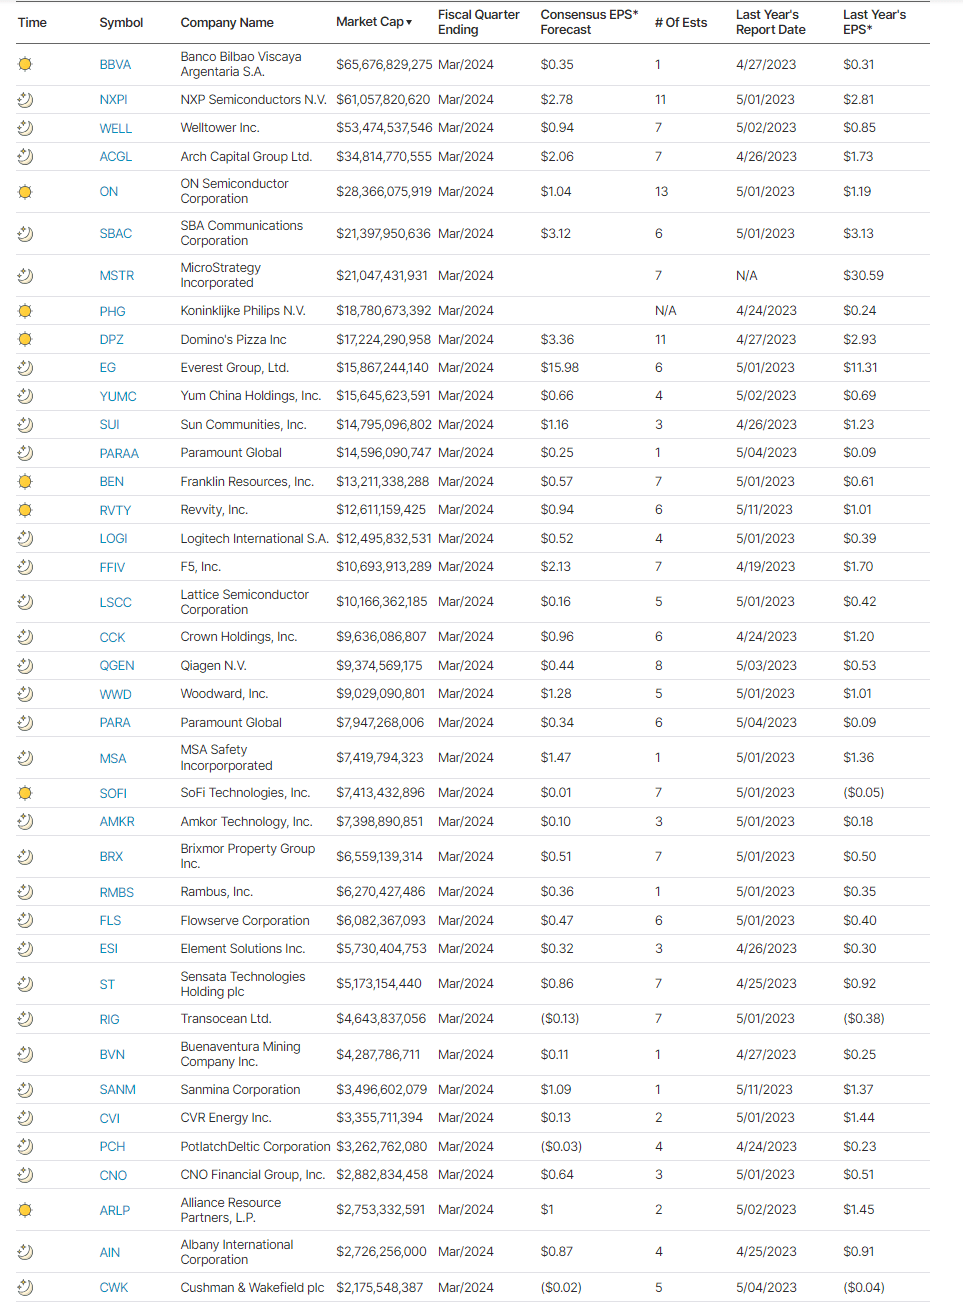
Earnings
- No notable earnings releases today.
Economy
Market Trading Update
The market spent most of yesterday waffling in negative territory, but a very late-day buying spree in the last half hour sent the S&P 500 into positive territory to close out the month. But what a month it was, with the S&P 500 rallying nearly 9% for the month. It is worth noting that since mid-month, the volume behind the rally has weakened as the markets became more severely overbought.
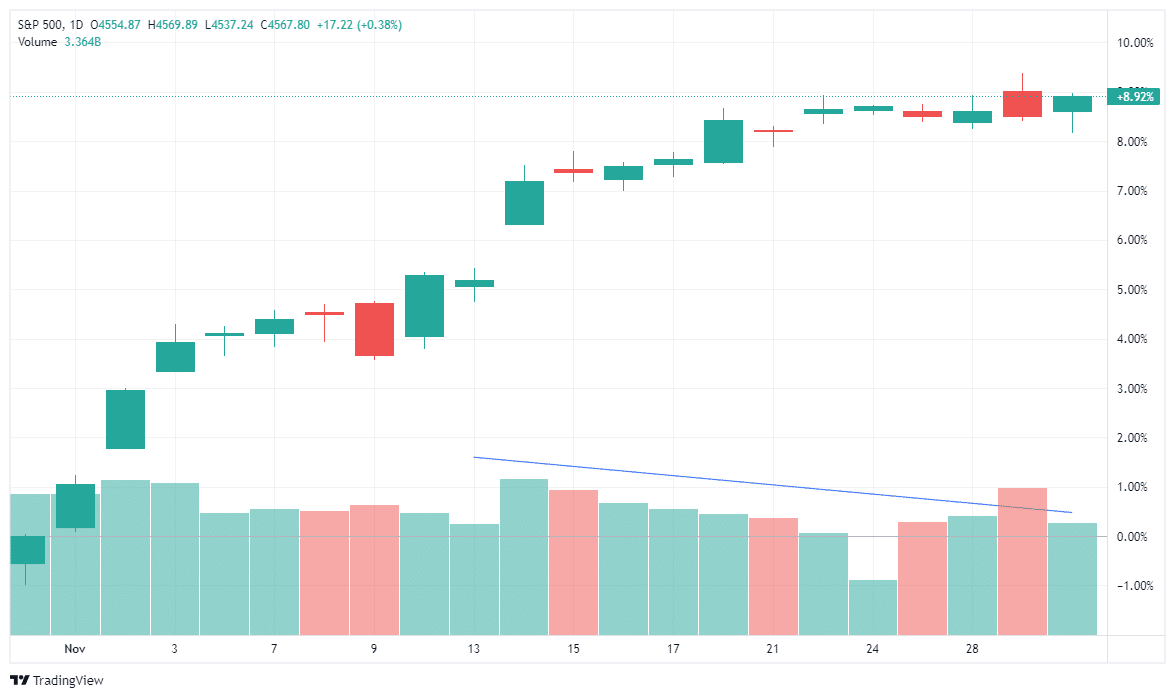
For now, there is little to be concerned with. Starting today and proceeding over the next three weeks, mutual fund distributions (along with hedge funds, etc.) will make annual distributions, which could provide some selling pressure. Use pullbacks to near-term support to add equity exposure as needed.
Several Fed speakers are out today, which could put pressure on the bond market, so it will be worth listening to what they have to say with the next FOMC meeting fast approaching.

PCE and Jobless Claims
More positive inflation news came out yesterday. The PCE price index was flat versus expectations of a +0.1% increase and the prior print of +0.4%. The core monthly index was +0.2%, also a tenth of a percent below expectations. The year-over-year core PCE is still higher than the Fed prefers at 3.5%, but it’s moving in the right direction.
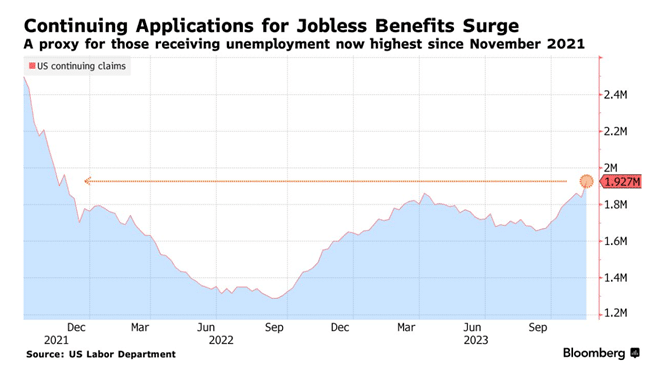
Initial jobless claims rose by 9k to 218k. Such is still a historically low number and well within the recent range. However, as we have recently been commenting on, continuing jobless claims are rising rapidly. The graph below, courtesy of Bloomberg, shows continuing claims are now at two-year highs. There are not a lot of job layoffs, but those who are being laid off are finding it more difficult to find a new job. Continuing jobless claims is often a good leading indicator of jobless claims. Thus far, jobless claims show no indication of weakness in the labor market. However, that may change in the coming months.
“Prices Are Still Too High”
BIDEN: “WE STILL HAVE MORE WORK TO DO, PRICES ARE STILL TOO HIGH.”
The headline above hit yesterday morning. It is important to take some time to digest what President Biden likely means versus what he appears to say. Biden’s quote implies that prices are still elevated and need to decline, presumably to pre-pandemic levels. In economic terms, Biden wants deflation. What we think he really means, and what the Fed openly desires, is for prices to continue to increase but only at a 2% a year pace.
The graph below helps appreciate the difference between the two outcomes. The blue line and the black dotted line is the CPI index and its trend. The orange line grows the index at an annualized 2% rate. The orange line is what Biden means and the Fed aims for. What Biden implies is the purple line. For the CPI index to get back to the pre-pandemic trend in a year we would need to experience 7% deflation. Such a level of deflation hasn’t been seen since the great depression and if its up to the Fed or President, that will not occur on their watch.

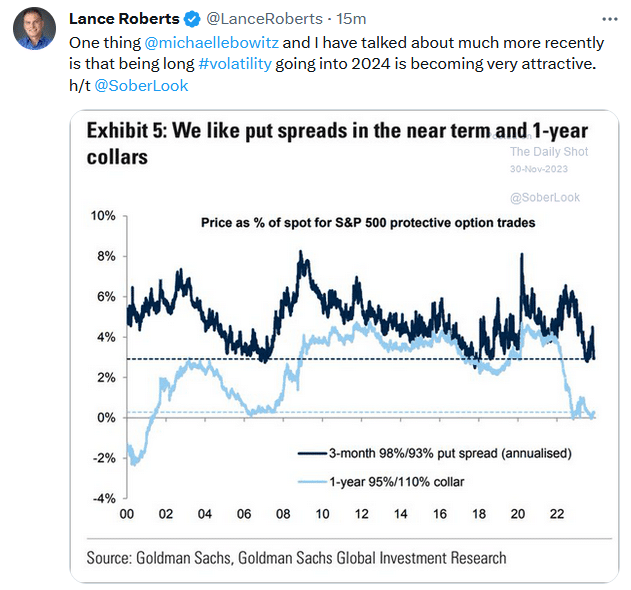
Tweet of the Day
Please subscribe to the daily commentary to receive these updates every morning before the opening bell.
If you found this blog useful, please send it to someone else, share it on social media, or contact us to set up a meeting.

