Bad News Is Good News As Markets Set Record Highs


Inside This Week’s Bull Bear Report
- Bad News Is Good News Sending Markets To Record Highs
- How We Are Trading It
- Research Report –Is Buffett’s Cash Hoard A Market Warning?
- Youtube – Before The Bell
- Market Statistics
- Stock Screens
- Portfolio Trades This Week
New Highs On The Back Of Bad Data
Last week, we discussed that the April correction was likely over.
“Notably, the breakout above key resistance and the reversal of the volatility index suggest that the recent correction is over. However, while the April correction may be over, as noted above, there is still a decent probability of another correction before the Presidential election in November. As shown below, such tends to be a statistical normality during Presidential election years.”
This past week, markets surged to all-time highs as a plethora of bad economic data and a weaker-than-expected inflation print lifted hopes of Fed rate cuts in the coming months.
From a technical perspective, the markets remain on a current MACD “buy signal” and have cleared all previous resistance levels. Furthermore, the 20-DMA will cross above the 50-DMA next week, providing additional support to any short-term market correction. We should expect a pullback or consolidation with the market overbought on multiple levels. Such consolidations will give a better entry point for investors who need to increase equity exposures.

At some point, most likely before the election, we will get a deeper correction to retest moving averages. Regardless, the market will likely give us a fair warning to begin a risk reduction process.
However, at this juncture, “bad news is good news” again. As we will discuss this week, there is a “cost” for “bad news” that will eventually get factored in.
Need Help With Your Investing Strategy?
Are you looking for complete financial, insurance, and estate planning? Need a risk-managed portfolio management strategy to grow and protect your savings? Whatever your needs are, we are here to help.

Bad News Is Good News – Retail Sales
As noted above, “bad news is good news” as hopes for a reversal of the Fed’s monetary tightening grow. It’s ironic today that market participants hope for a recession, as the subsequent infusion of monetary accommodation should push stock prices “to the moon.” Of course, the real-world devastation caused to middle and lower-class American families, as they lose their jobs, benefits, and housing, is anything but beneficial.
Nonetheless. last week’s economic reports have been bad enough to send markets surging to all-time highs. Starting with retail sales for April, which came in unchanged despite rising gasoline prices, suggests that the consumer continues to weaken. As we noted in our article on “Retail Sales,”
“Retail sales data was extraordinarily weak from October to January, the traditionally strongest shopping months of the year. That period included Halloween, Thanksgiving, Christmas, and New Year’s. So, to some degree, the strength of spending over the last two months is unsurprising as, eventually, consumers need to buy goods or services previously postponed.
Secondly, while the March retail sales data was strong, it was weaker than February. However, March contained two significant spending periods, Spring Break and Easter, which generally don’t occur. Since Spring Break and Easter are considerable travel and shopping periods, it is unsurprising that the retail sales data increased with oil prices rising.”
That trend continued in April as retail sales disappointed once again.
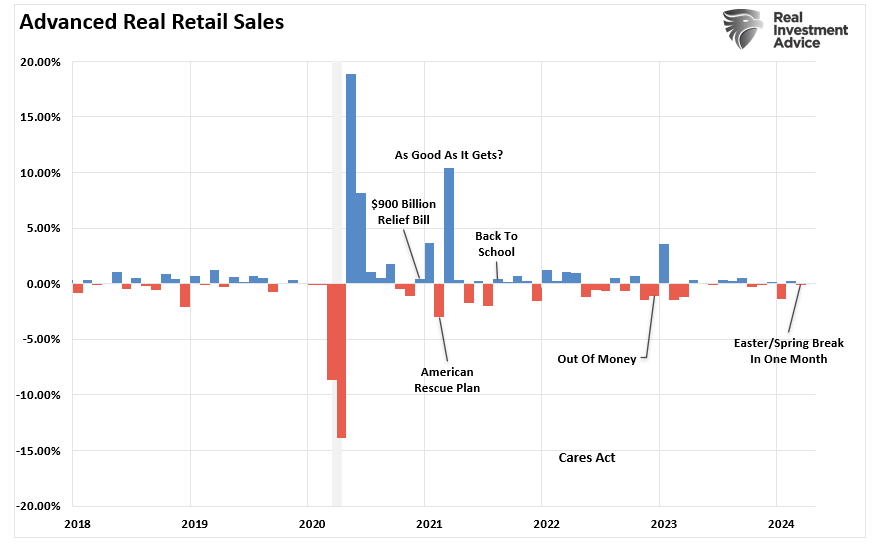
Furthermore, the reality is that on an inflation-adjusted basis, the retail sales data suggests the consumer continues to weaken. While spending more to buy the same goods or services may look good on paper, the average household has less money to spend elsewhere. As shown, the annual rate of change in real retail sales is near some of the lowest levels outside of a recession.

Of course, given that wages have failed to keep up with inflation, the average American has turned to increasing debt levels to maintain their current living standard. Such is particularly the case as the savings rate continues to decline.
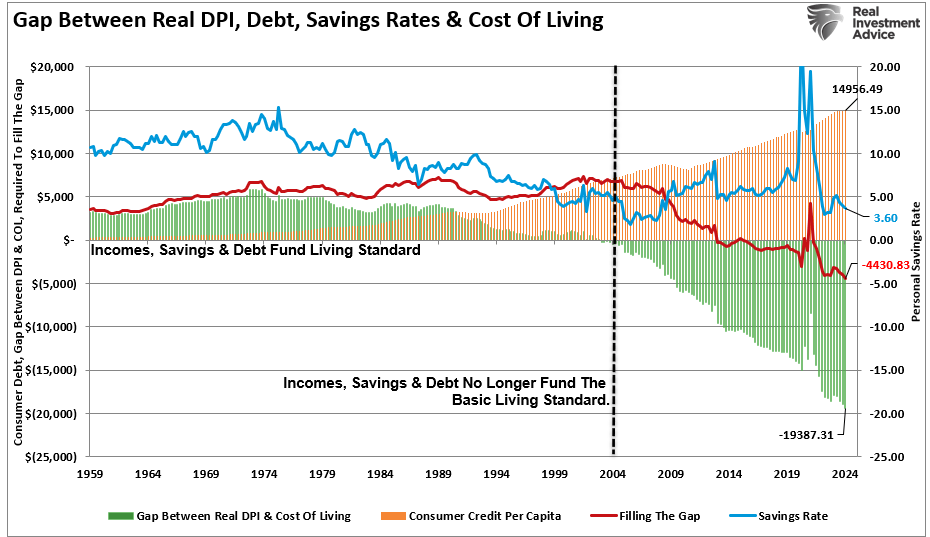
In other words, we may have finally reached the point where consumers are tapped out.
Consumers Are Tapped Out
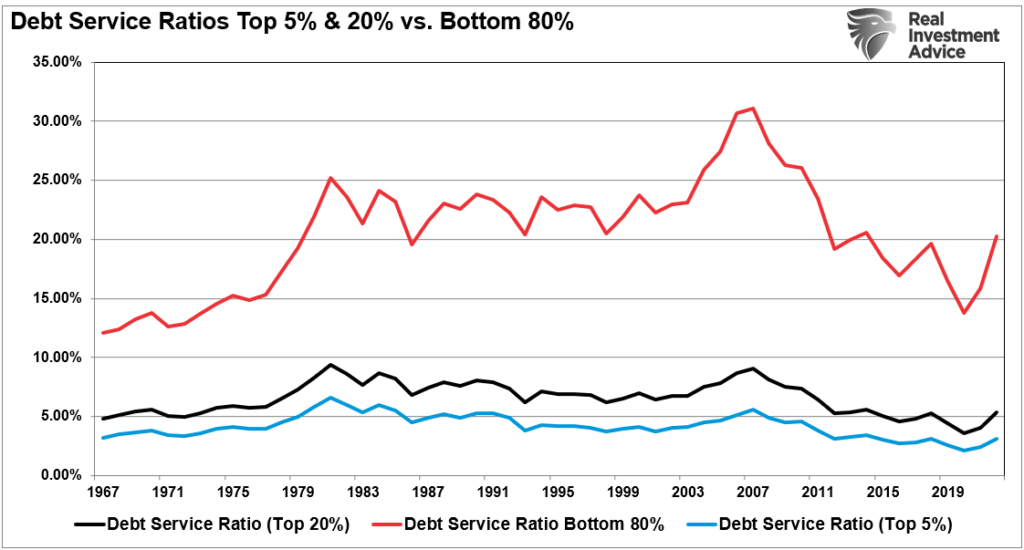
One problem with many economic data series we use, such as debt-to-income ratios, household savings rates, or net worth-to-income ratios, is that they encompass the wealth, incomes, and low-debt ratios of the top 20% of income earners. Such is a point we discussed in “Wealth Gap And The Road To Serfdom:”
“In other words, given the bulk of the wage gains are in the upper 20%, any data that reports an “average” of the information skews the results higher. This is why there is a vast difference between the debt service levels (per household) between the bottom 80% and the top 20%.”
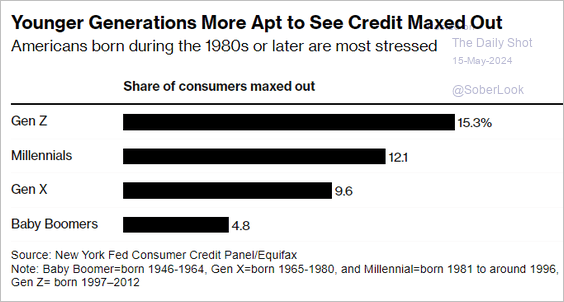
Of course, the most considerable pressure on the bottom 80%, and most importantly, the younger generations, is their share of income continues to decline.
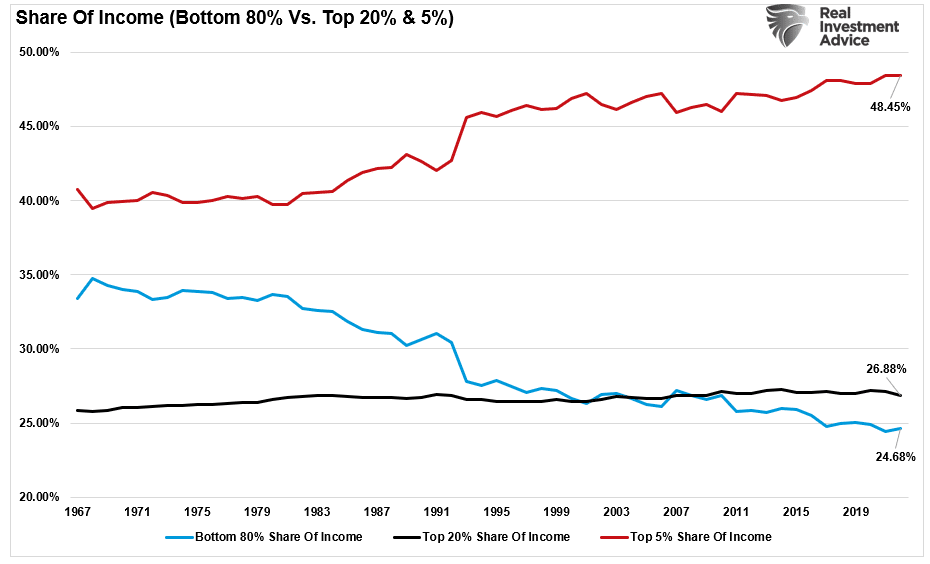
The consequence of that lack of income growth is that they are the first to run into the limits of taking on additional debt.
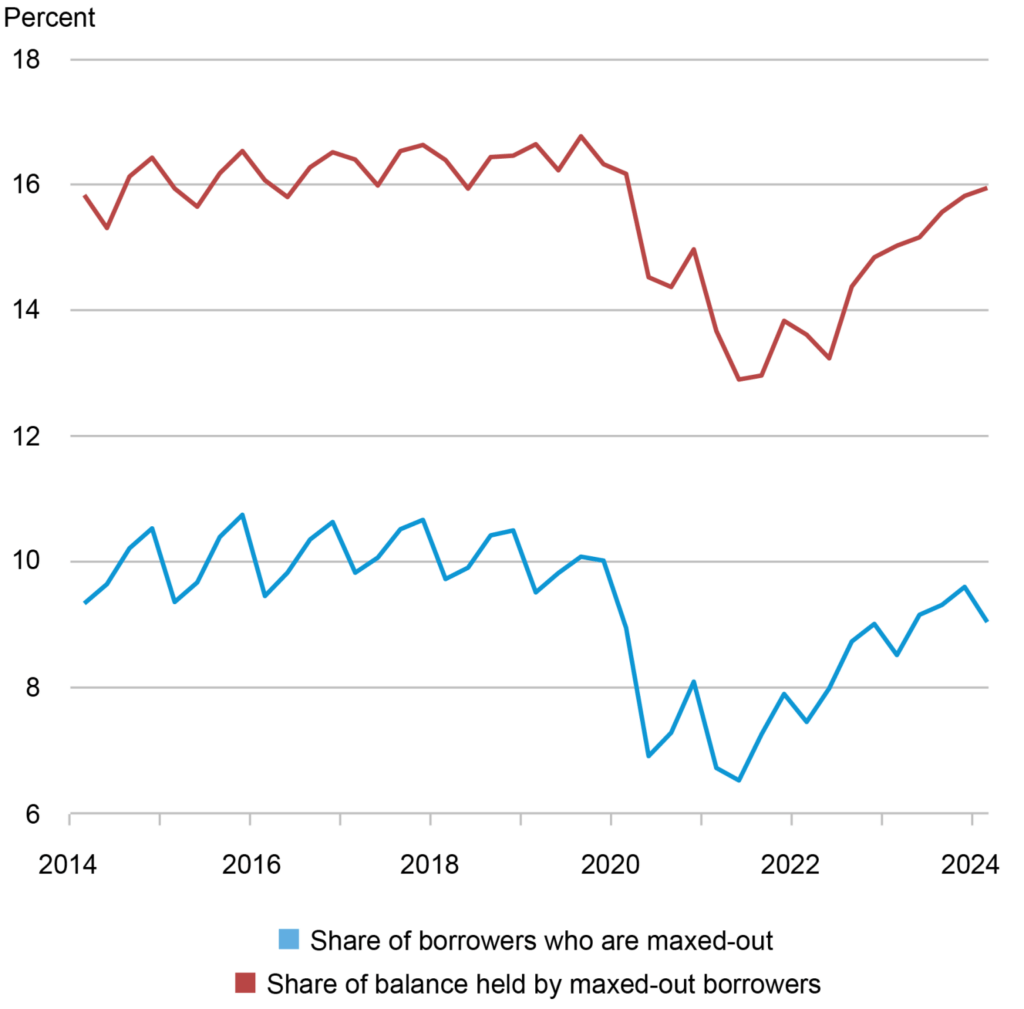
In a recent analysis by the New York Federal Reserve, they noted:
“The chart below shows a time series of non-delinquent maxed-out borrowers, with the blue line denoting their share among current borrowers and the red line showing the share they hold of aggregate current balances. Credit card borrowers made massive paydowns on their cards in 2020 and 2021, a time during which income rose from pandemic transfers and assistance but consumption opportunities were limited, resulting in a decline in the share of maxed-out borrowers. Since the economy reopened in 2022 and consumption was very strong in 2022 and 2023, credit card balances increased again, resulting in a rise in the share of maxed-out borrowers and their balances. These shares remain slightly lower than the pre-pandemic level but are edging back up.“
Notably, that data refers to those borrowers who are NOT delinquent on their current debt obligations. The more troubling trend reveals itself when we dig in further: the level of borrowers now in “Serious (90+ days)” delinquency on both credit cards and auto loans has risen sharply.
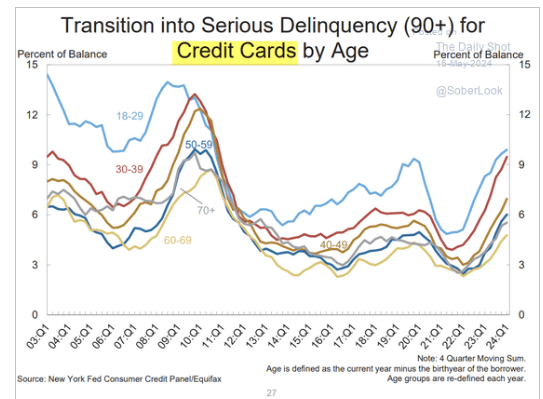
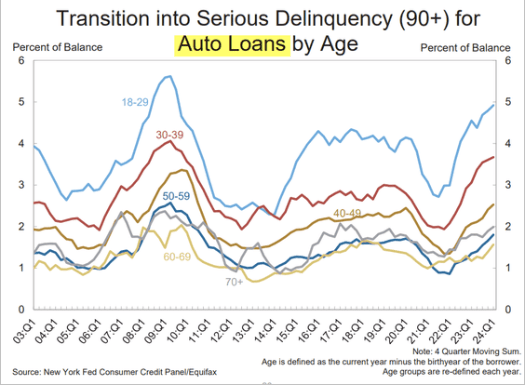
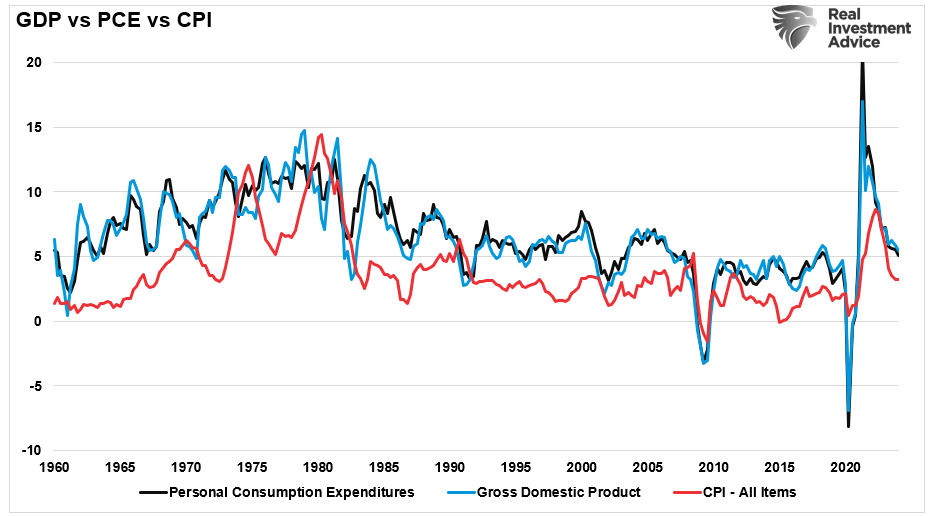
While we are not yet back to 2008 “financial crisis” levels, this data suggests that the consumer is slowing down as excess savings have run dry. Given that the consumer, and by extension, “Personal Consumption Expenditures (PCE),” which comprise roughly 70% of the GDP calculation, economic growth and inflation will likely slow more than many economists currently expect.
Disinflation Remains The Bigger Risk
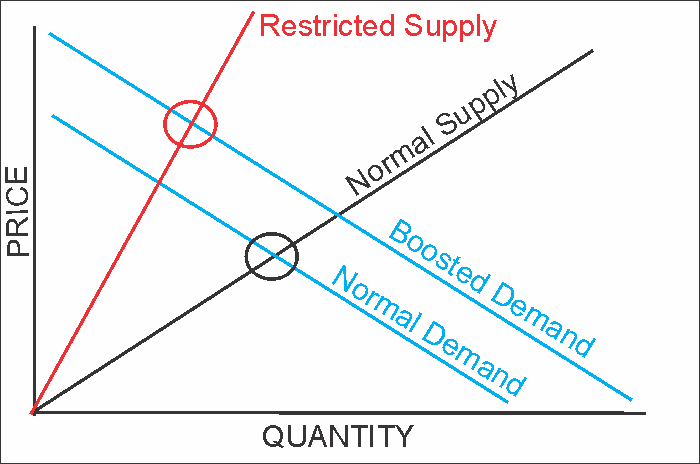
Investors should not dismiss the importance of retail sales and consumer data. As noted, while PCE comprises nearly 70% of the GDP calculation, retail sales comprise almost 40% of PCE. In other words, when it comes to economic growth and, ultimately, inflation, it all comes down to the consumer. The reason is that inflation is solely a function of supply and demand. If the consumer (demand) weakens, the basics of economics say that price (supply) will decline also.
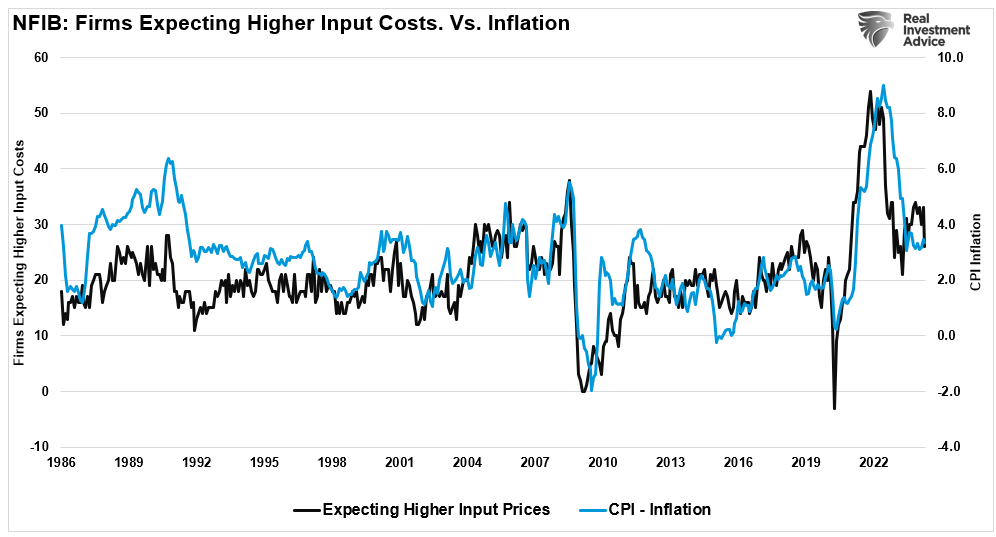
The problem for those expecting a 1970s inflation scenario is that the economic backdrop does not support higher inflation due to the inability to increase economic growth rates. Furthermore, as the consumer contracts, business owners will be forced to cut back on employment, liquidate excess inventory, and cut costs. The latest NFIB data shows that business owners expect lower input costs, which correlate with overall CPI.
Furthermore, the NFIB’s actual and expected sales continue to decline and have been at the lowest levels since the “Financial Crisis” and the “Pandemic-related recessions.
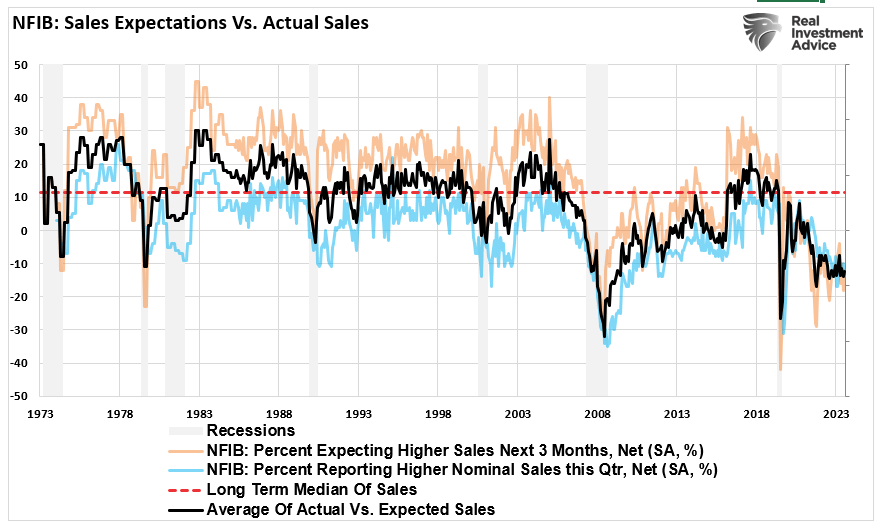
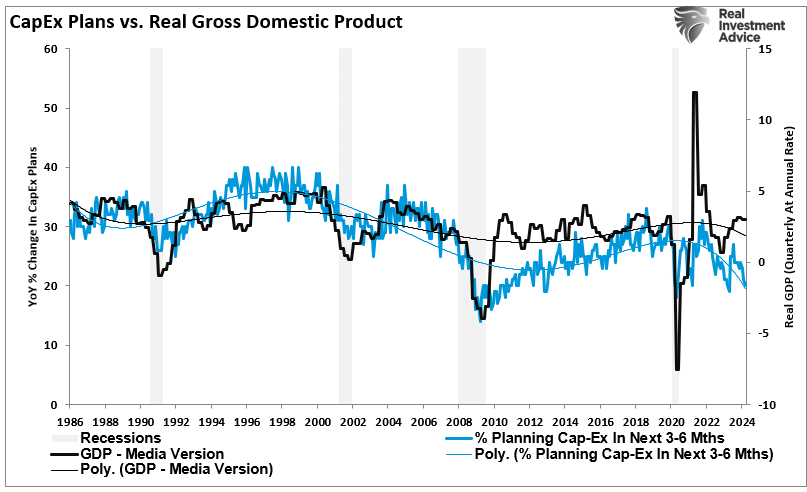
Of course, if expectations of selling products, goods, or services are declining, then there is little reason to make capital expenditures or expand the business. Unsurprisingly, capital expenditures correlate highly to economic growth, which lags by 6 to 9 months.
For investors, the most significant risk to portfolios is not inflation but most likely disinflation as the economy, and ultimately earnings, come under pressure in the months ahead. Such is crucial given that expectations for earnings growth in the overall index remain elevated, but that growth depends on just 7 stocks. In fact, since the beginning of this bull market cycle in Q4 of 2022, there has been ZERO earnings growth in the bottom 493 stocks of the S&P 500.

While markets are exceedingly exuberant about rate cuts and more monetary accommodation, those policies will do little to offset the current constraints on the average American. The lag effect of higher rates, prices, and declining wage growth appears to have caught up with the consumer.
That will likely lead to an eventual repricing of markets to align with declining earnings growth expectations.
How We Are Trading It
As noted above, we maintain our bias towards equity risk, with the markets hitting all-time highs. One important note is that all-time highs tend to beget further highs as momentum and rising optimism fuel asset prices.
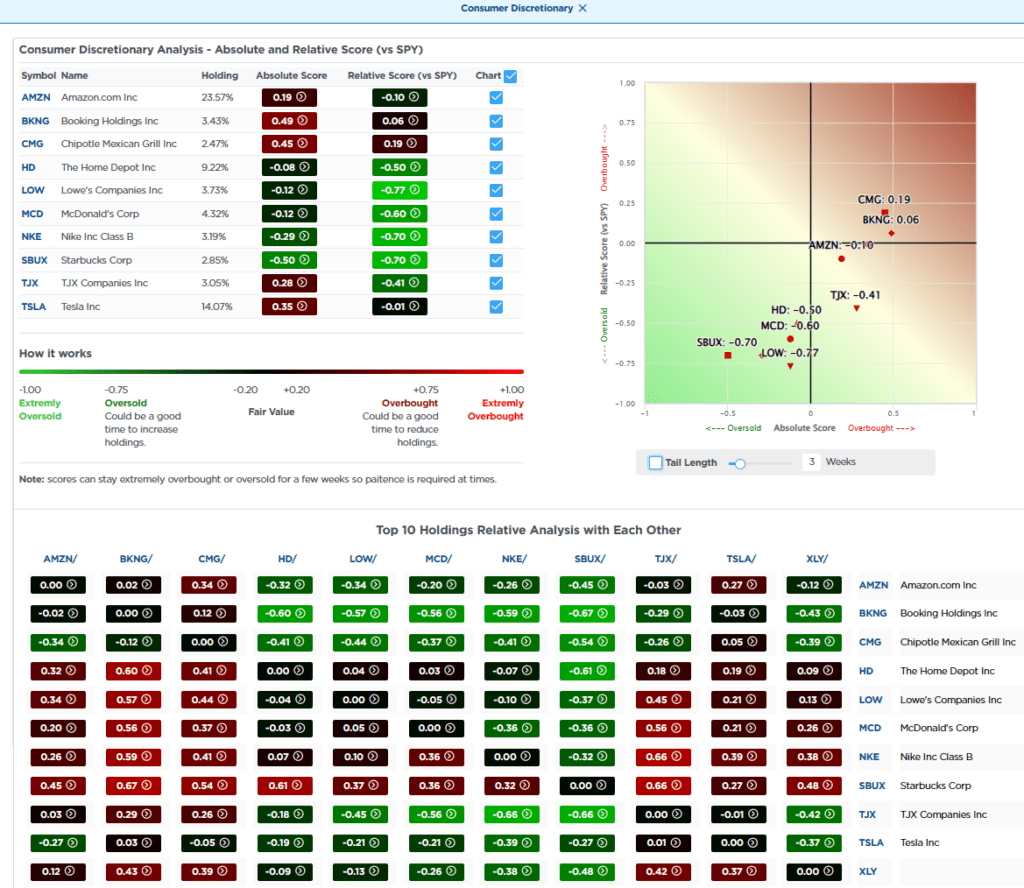
However, with markets overbought, look for short-term corrections and consolidations to add equity exposure as needed. Indeed, many risks lie ahead, and we watch the consumer very closely. As you will note in our trade alerts below, we are reducing consumer discretionary stocks specifically for this reason. The consumer drives the economy and, ultimately, earnings.
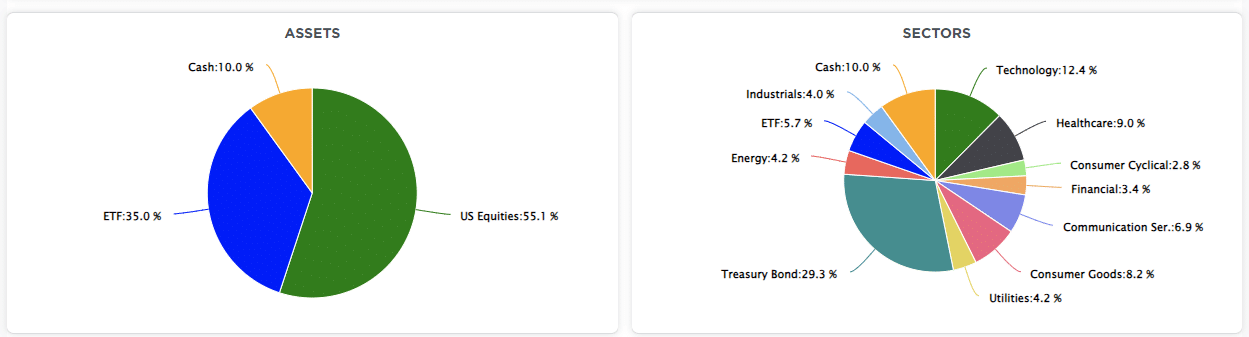
We have rebalanced our portfolios and used the April correction to add exposure to our Equity and Dividend Equity models. (You can track those portfolios in real-time by subscribing to the newly redesigned SimpleVisor platform.)
If we see signs of deterioration, we will adjust risk accordingly.
Have a great week.
Research Report

Subscribe To “Before The Bell” For Daily Trading Updates
We have set up a separate channel JUST for our short daily market updates. Please subscribe to THIS CHANNEL to receive daily notifications before the market opens.
Click Here And Then Click The SUBSCRIBE Button
Subscribe To Our YouTube Channel To Get Notified Of All Our Videos
Bull Bear Report Market Statistics & Screens

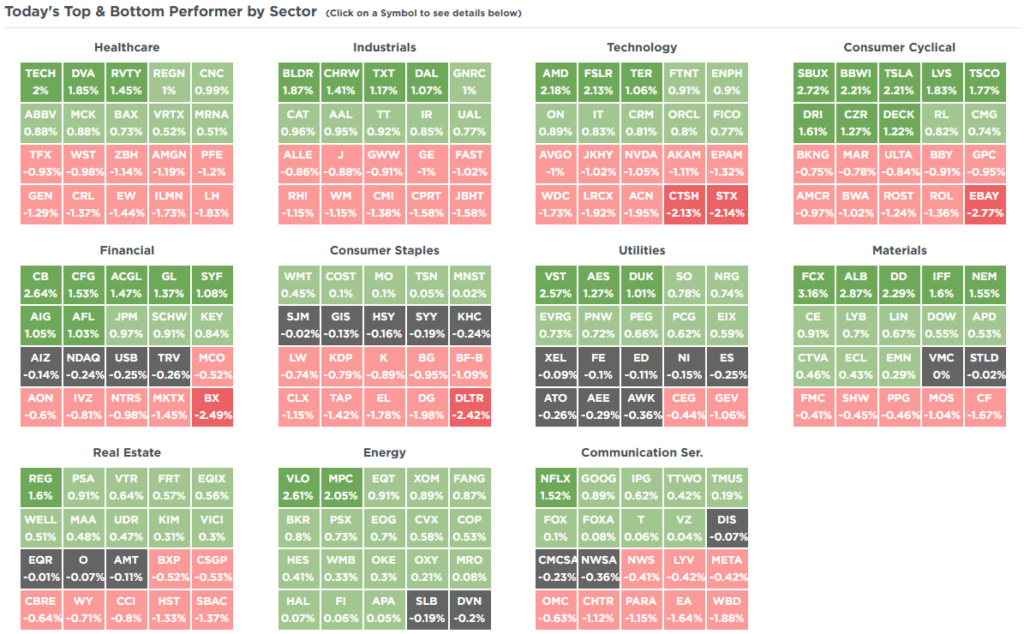
SimpleVisor Top & Bottom Performers By Sector
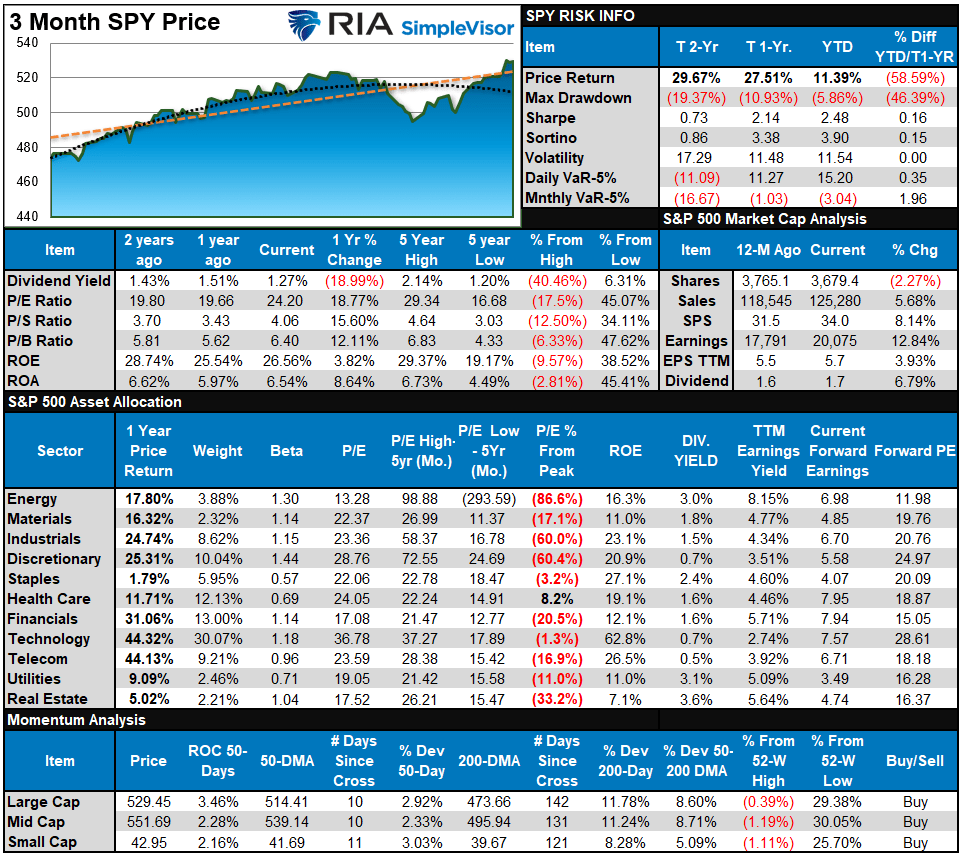
S&P 500 Weekly Tear Sheet
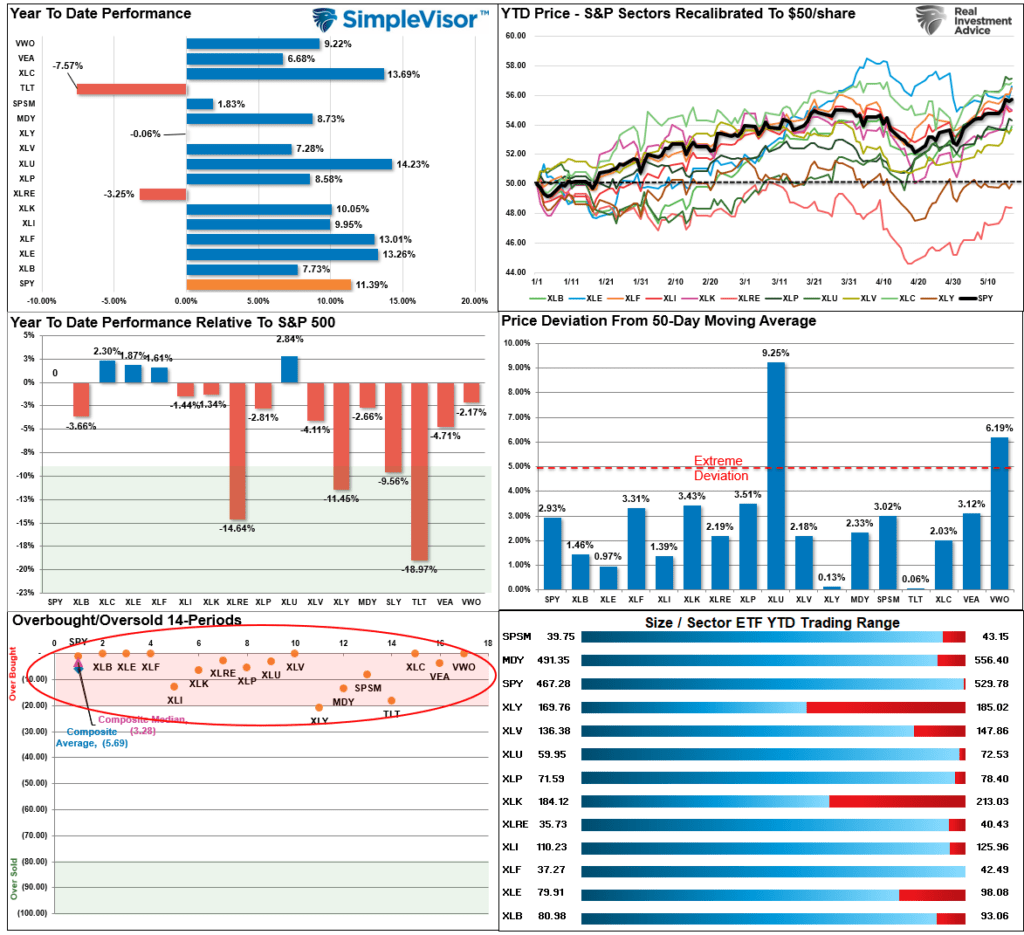
Relative Performance Analysis
Last week, we noted that with most sectors and markets short-term overbought, we could see some selling pressure next week as traders profit from the recent rally. However, the cooler CPI print sent investors chasing stocks, hoping for Fed rate cuts, pushing markets to all-time highs. With the market more overbought than last, expect some consolidation near term. On a bullish note, participation in the market has notably broadened, with Communications, Utilities, Financials, and Energy all outperforming the broad market this year.
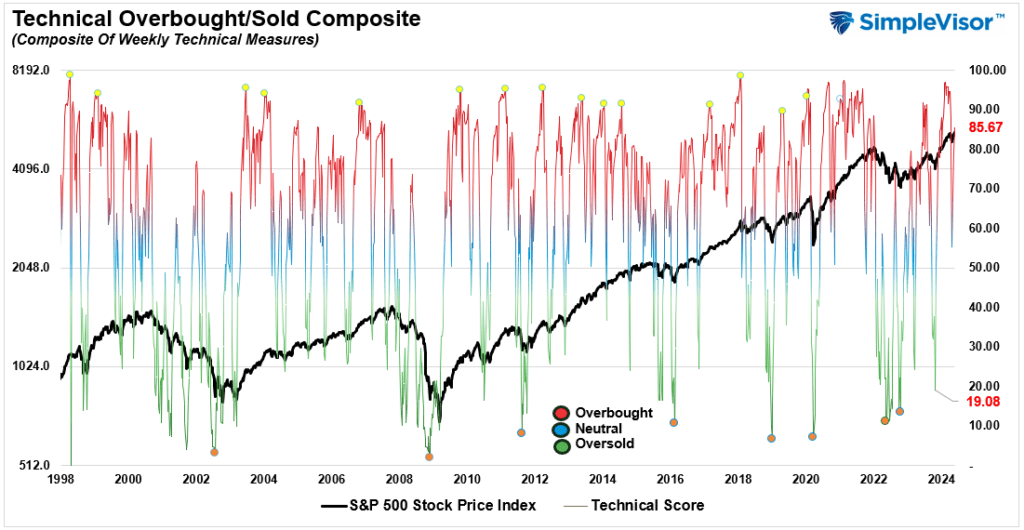
Technical Composite
The technical overbought/sold gauge comprises several price indicators (R.S.I., Williams %R, etc.), measured using “weekly” closing price data. Readings above “80” are considered overbought, and below “20” are oversold. The market peaks when those readings are 80 or above, suggesting prudent profit-taking and risk management. The best buying opportunities exist when those readings are 20 or below.
The current reading is 85.67 out of a possible 100.
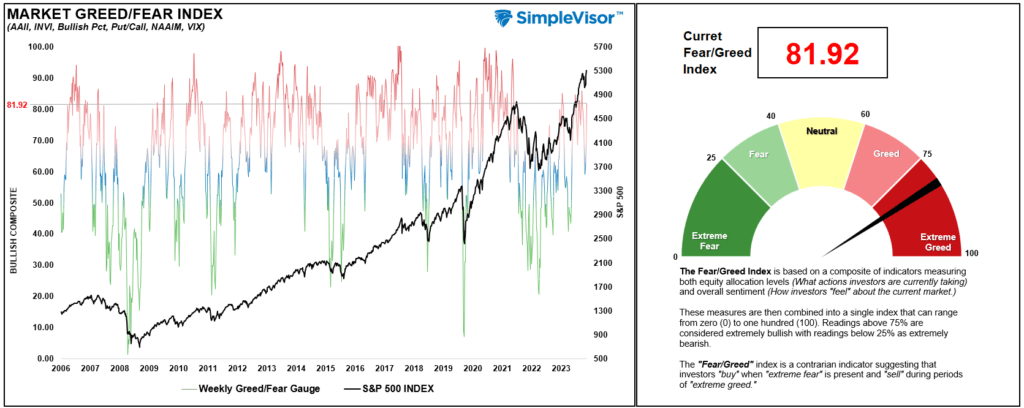
Portfolio Positioning “Fear / Greed” Gauge
The “Fear/Greed” gauge is how individual and professional investors are “positioning” themselves in the market based on their equity exposure. From a contrarian position, the higher the allocation to equities, the more likely the market is closer to a correction than not. The gauge uses weekly closing data.
NOTE: The Fear/Greed Index measures risk from 0 to 100. It is a rarity that it reaches levels above 90. The current reading is 81.92 out of a possible 100.
Relative Sector Analysis
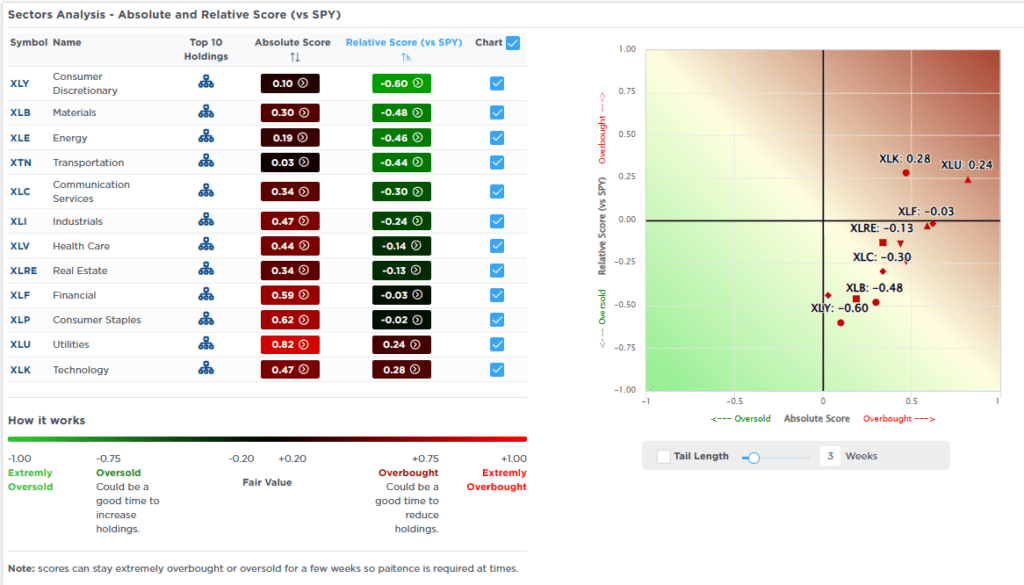
Most Oversold Sector Analysis
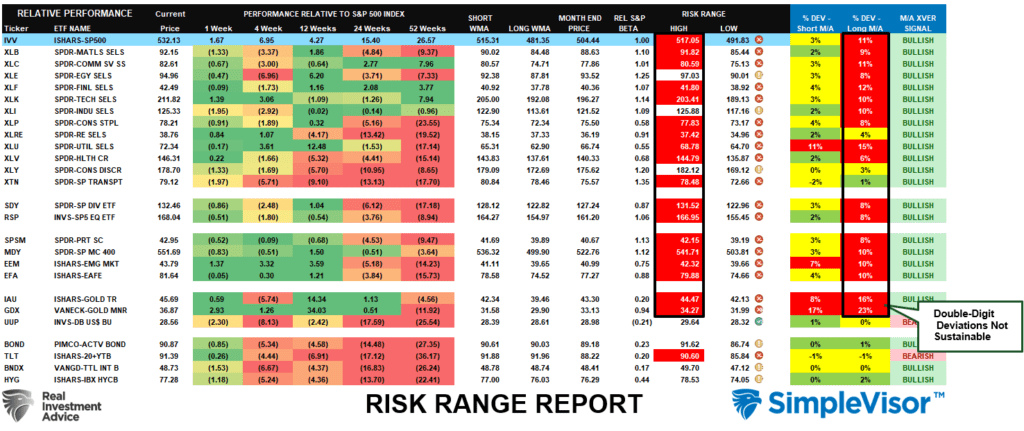
Sector Model Analysis & Risk Ranges
How To Read This Table
- The table compares the relative performance of each sector and market to the S&P 500 index.
- “MA XVER” (Moving Average Crossover) is determined by the short-term weekly moving average crossing positively or negatively with the long-term weekly moving average.
- The risk range is a function of the month-end closing price and the “beta” of the sector or market. (Ranges reset on the 1st of each month)
- The table shows the price deviation above and below the weekly moving averages.
As noted last week:
“Last week’s market rally pushed many sectors and markets well above their monthly trading ranges. In the short term, expect a correction to relieve some overbought conditions”
Those deviations worsened this past week with the market rally to all-time highs. It is important to note that Gold and Gold Miners are extremely deviated from long-term means, which will lead to a deep reversal at some point. Double-digit deviations in other markets and sectors also suggest more extreme overbought conditions. Given that deviations from means will precede a reversion, investors should engage in regular profit-taking and rebalancing as needed to control risk.
Weekly SimpleVisor Stock Screens
We provide three stock screens each week from SimpleVisor.
This week, we are searching for the Top 20:
- Relative Strength Stocks
- Momentum Stocks
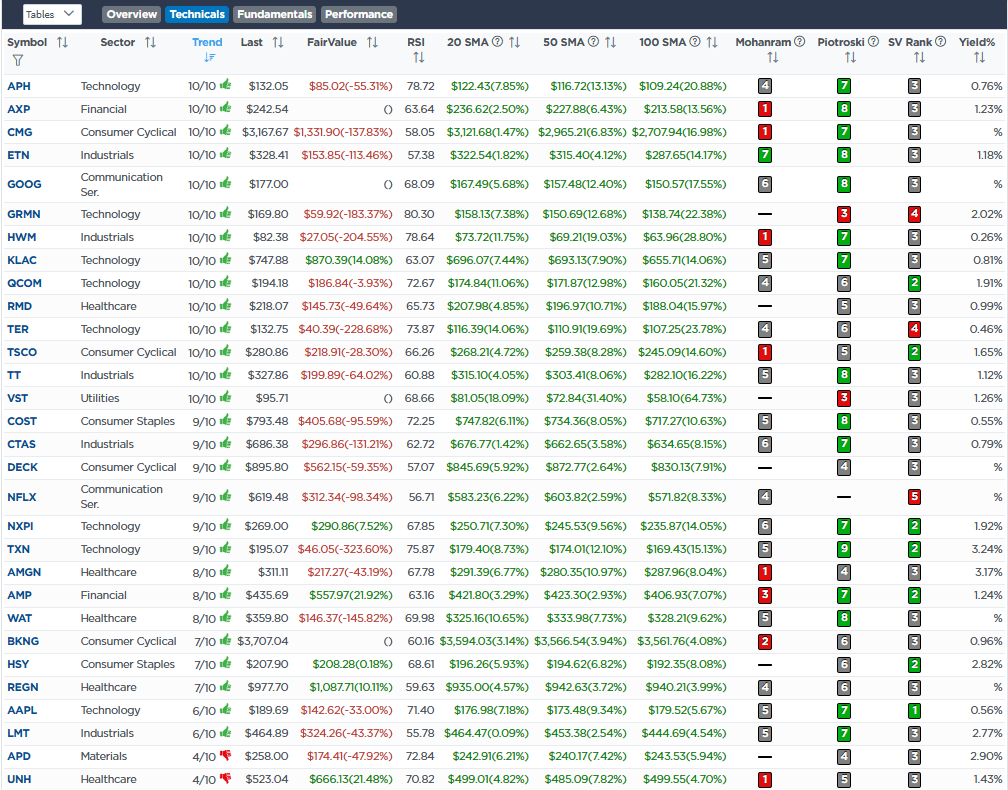
- Fundamental & Technical Strength W/ Dividends
(Click Images To Enlarge)
RSI Screen
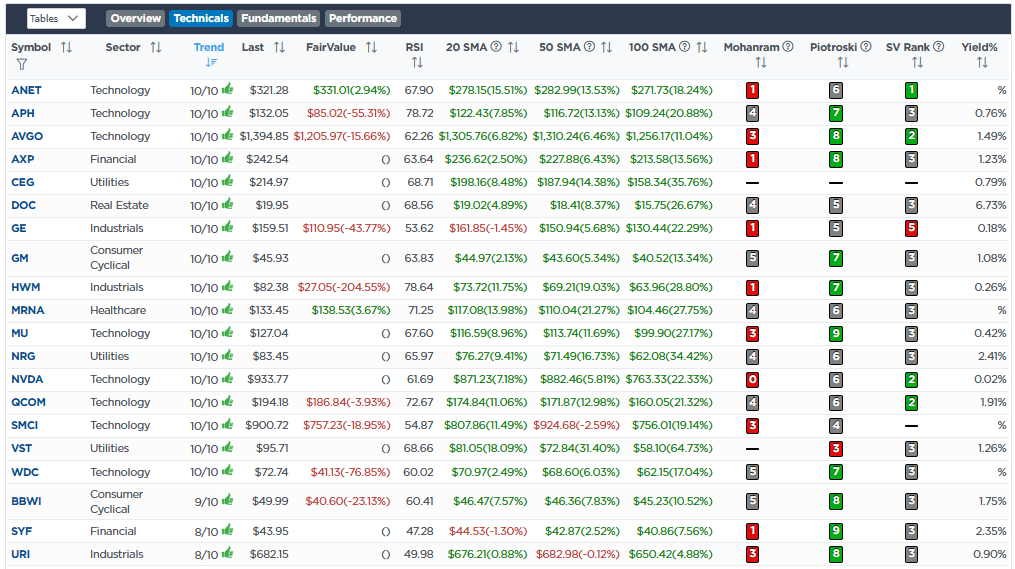
Momentum Screen
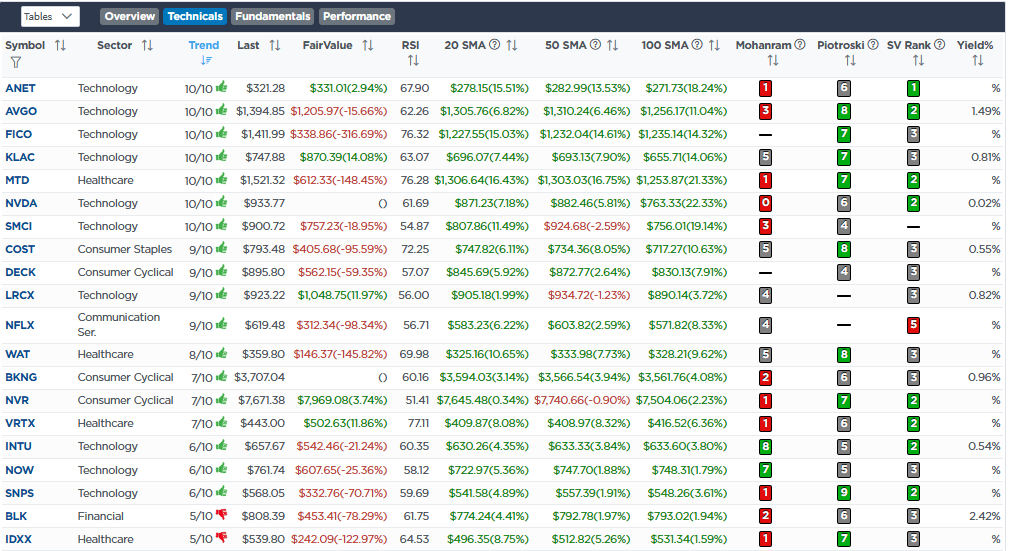
Fundamental & Technical Screen
SimpleVisor Portfolio Changes
We post all of our portfolio changes as they occur at SimpleVisor:
May 15th
“Rising credit and auto loan delinquencies, weak retail sales data, and rising indications of slowing economic growth suggest that consumers are becoming cautious about spending overall. Obviously, near-term data doesn’t tell us the whole story, but it is enough to suggest that reducing our exposure to cyclical and discretionary exposure is likely warranted for now.
As such, we are reducing Visa (V) and shifting that to Public Storage (PSA), which we previously owned. With the Fed set to cut rates, real estate should benefit in general, but storage units should remain primarily recession-proof going forward. In the ETF model, we reduced the SPDR Discretionary ETF (XLY) and added exposure to the SPDR Real Estate ETF (XLRE).”
Equity Model
- Sell 1% of the portfolio in Visa (V)
- Buy 1% of the portfolio in Public Storage (PSA)
ETF Model
- Sell 2% of the portfolio of SPDR Discretionary ETF (XLY)
- Buy 2% of the portfolio of SPDR Real Estate ETF (XLRE)
May 16th
On May 10th, we added a position in National Fuel Gas (NFG) to play in the electricity generation space. To wit:
“Over the last couple of weeks, we have been slowly migrating a portion of the portfolio to benefit from the coming need for energy infrastructure to support the electricity demand required by the U.S. for artificial intelligence, electric cars, and increased computer usage. That demand increase, on top of the already massive base of power consumption used daily, will require increased power production.”
However, when we bought the position, we encountered a liquidity problem trying to add a 1% holding to our portfolios. There was insufficient volume to execute our block trade without significantly moving the price. This presents a dual problem. First, we can not increase the position size in the future as intended. Secondly, if, for some reason, the price reverses and we want to sell, liquidating the position can become problematic.
Therefore, we are selling NFG today and replacing it with a similar company, Oneok (OKE), which also carries a 4.72% yield. This is a one-for-one swap in the portfolio, providing us with the liquidity needed to build the position soon and exit safely when needed.
With the latest retail sales data, we are also reducing our discretionary holdings as the consumer seems to be slowing down faster than many expected. We are closing the position in Genuine Auto Parts (GPC) with a slight loss that we will offset in our previous gains taken in the portfolio before the recent market correction.
Equity Model
- Sell 100% of National Fuel Gas (NFG)
- Sell 100% of Genuine Auto Parts (GPC)
- Initiate a 1% of the portfolio position in Oneok (OKE)

Lance Roberts, C.I.O.
Have a great week!


