Fed Bluffs And Wall Street Calls


In this 06-17-22 issue of “Fed Bluffs And Wall Street Calls.”
- Down Again. Another Tough Week
- Fed Bluffs And Wall Street Calls
- Portfolio Positioning
- Sector & Market Analysis
Follow Us On: Twitter, Facebook, Linked-In, Sound Cloud, Seeking Alpha
Need Help With Your Investing Strategy?
Are you looking for complete financial, insurance, and estate planning? Need a risk-managed portfolio management strategy to grow and protect your savings? Whatever your needs are, we are here to help.
Schedule your “FREE” portfolio review today.

Weekly Market Recap With Adam Taggart
Down Again, Another Tough Week
As we noted in last week’s update:
“Our concern was that the longer the market remained in a tight trading range, the risk of a failed rally increased. While there was certainly room for the market to break to the upside, the multiple levels of resistance immediately overhead limited any advance. The failed rally now adds additional downward pressure on prices near term.
Therefore, from a risk management perspective, we continue to suggest using rallies to reduce exposure and raise cash. Given the failed rally, it is important the retest of the previous lows holds. A break of those lows will confirm the ‘bear market’ is fully engaged.”
Unfortunately, previous support levels did fail to hold, and the market tumbled this week to new lows for the year as the Fed hiked rates by 0.75%, almost ensuring an economic recession.

As noted, the market remains in a very defined downtrend from the January highs. With the market very oversold and pushing 3-standard deviations below the 50-dma, a counter-trend rally within the downtrend is likely. However, given the Fed is tightening policy and the risk of an earnings recession is rising, we continue to suggest using rallies to reduce risk.
It is not surprising that we are getting many questions inquiring whether we are near the “bottom” of the current selloff. Picking the bottom of a “bear market” is always more luck than skill. However, some technical signals and supports suggest we may be closer to a bottom than not.
Still A Correction
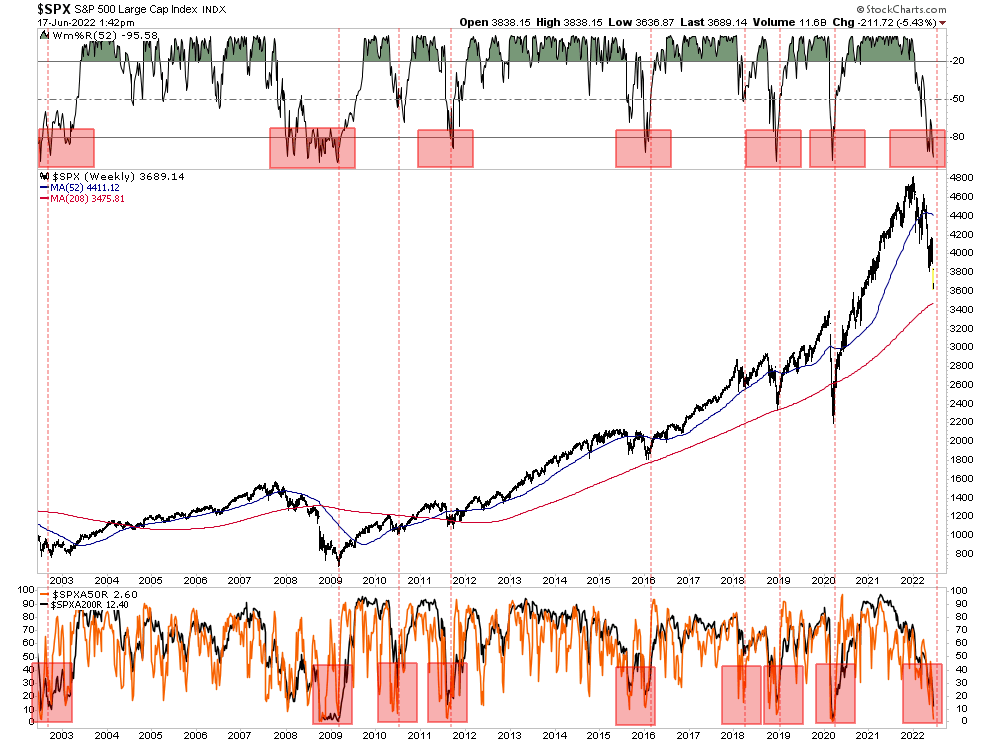
One thing to note is that despite the current decline, the markets are still within a “correction” rather than a “bear market.” The mainstream media uses an arbitrary measure of a 20% decline to declare a “bear market.” However, a “bear market” occurs when prices are no longer trending positively but negatively. If we view the market from 2009 to the present, we can denote the market’s bullish trend compared to the current correction.

As shown, the 3-year moving average has acted as the bullish trend support since the end of the financial crisis. More importantly, the bullish trend remains intact current from the 2009 lows. Notably, the market is currently MORE oversold (top and bottom panels) than at the lows of March 2020 or 2009.
With markets still above the 2020 peak, it is hard to suggest we are in a bear market. But with such deep oversold conditions, one could argue there is potential support for markets near term.
Are We Near A Bottom?
However, there are essential differences between the current market environment and the previous corrections. At previous market bottoms, as noted by the vertical red lines above, the Fed was cutting rates to zero, introducing QE programs, or providing other measures of monetary liquidity.
Today that is not the case, as the Fed is just starting to reduce its balance sheet and hike interest rates aggressively. The reversal of liquidity suggests that any short-term bottom in stocks may not be “the” bottom, particularly as the economy approaches earnings and economic recessions.
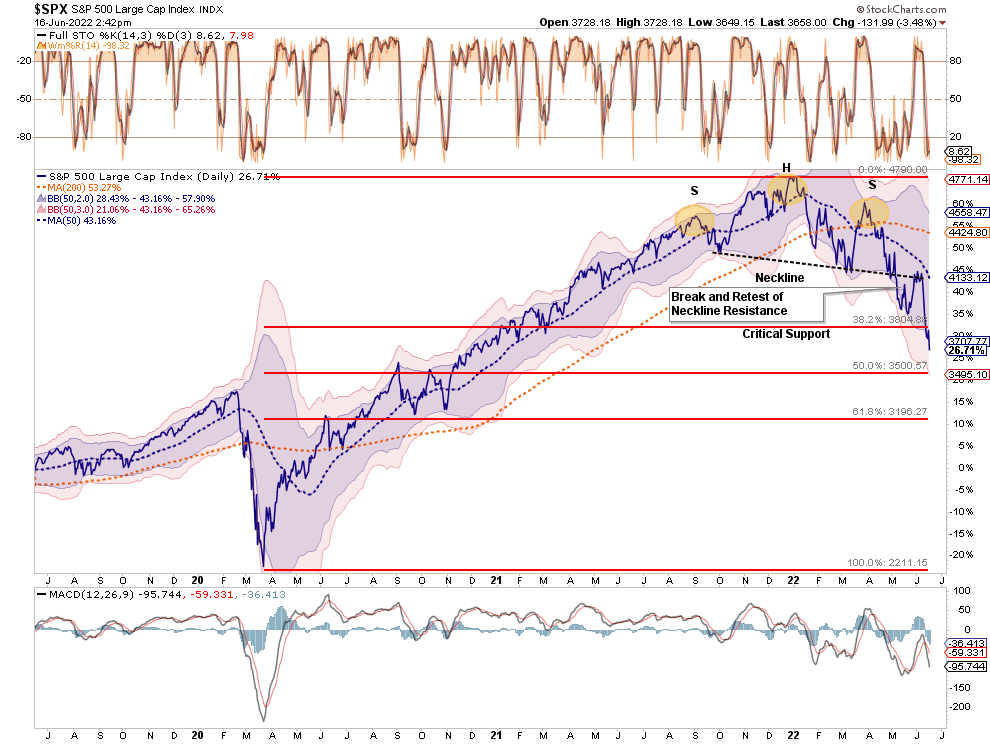
With the market completing a “head and shoulders” topping process and violating important support at the 38.2% Fibonacci retracement level, the next logical support is 3500. Such a correction would wipe out all the gains since the 2020 peak. Such would also push the S&P 500 index nearly 4-standard deviations below the 50-day moving average.
If the market fails to find support at 3500, 3196 becomes the next logical level.
However, the market is currently showing several signals aligned with previous market bottoms. Currently, only 2.6% of stocks in the S&P 500 index are trading above their 50-day moving average. Moreover, only 12.4% are above their respective 200-dma. As shown, with the market oversold and so many stocks trading below their respective moving averages, such typically denotes market lows.
Furthermore, the market selling as of late has been brutal. As noted by BofA:
“More than 90% of stocks in the S&P 500 declined today. It’s the 5th time in the past 7 days. Since 1928, there have been exactly 0 precedents. This is the most overwhelming display of selling in history.”
While none of this data “guarantees” a market bottom is near, history suggests the odds of a reflexive rally remain elevated. We also suspect Wall Street will call the “Fed bluff” on aggressive monetary policy sooner than later.

Fed Bluffs. Wall Street Calls.
The entirety of the financial market currently hinges on the Federal Reserve and its monetary policy outlook. On Wednesday, the Fed hiked the overnight lending rate by 0.75%, citing inflationary pressures. Jerome Powell decided that a “Fed bluff” was the right call to assuage the markets in light of the increase.
“There is no sign of a broader slowdown in the economy that I can see.”
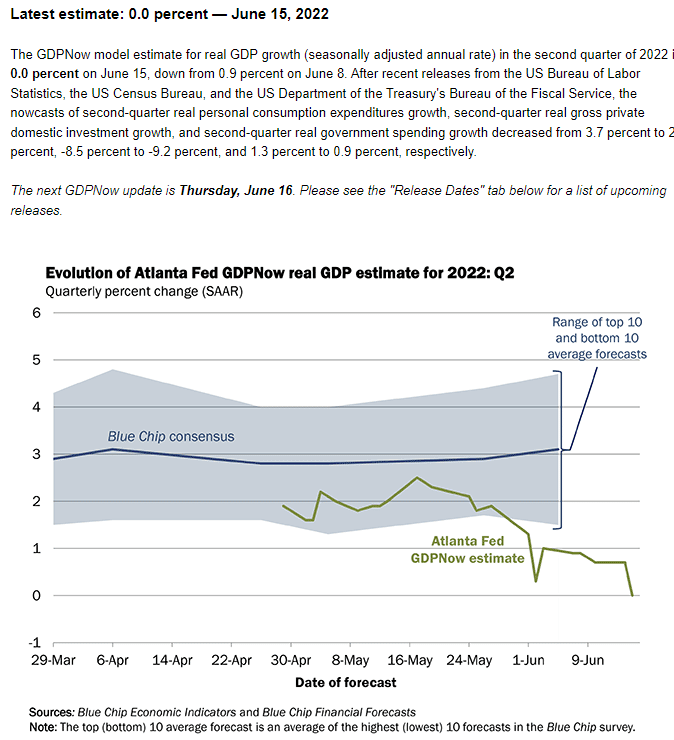
While the Fed may not see signs of a broader economic slowdown, almost every measure of activity in the economy is slowing. For example, the Atlanta Fed’s GDPNow tracker fell 0% last week, down from 0.9% last week.
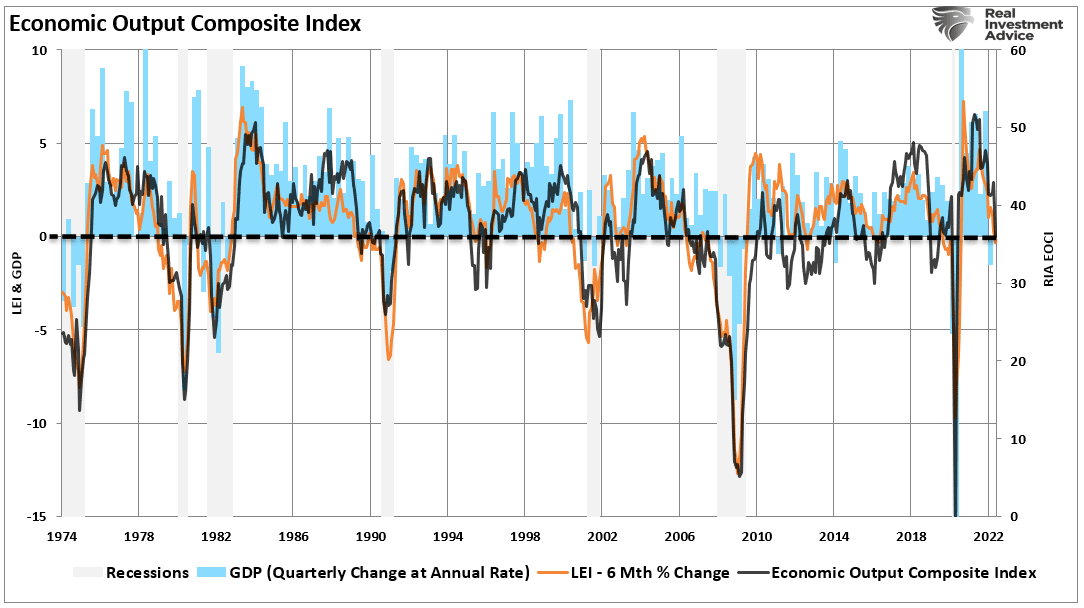
Furthermore, our composite economic index, comprising over 100 data points, both lagging and leading, is also contracting. (The index has a very high correlation to economic activity.)
While the “Fed bluff” seemed to work on Wednesday, Wall Street “called” the Fed pushing stocks below important support on Thursday. The realization that the more aggressive Fed policy increases recession risk led to one of the largest sell programs since the financial crisis.
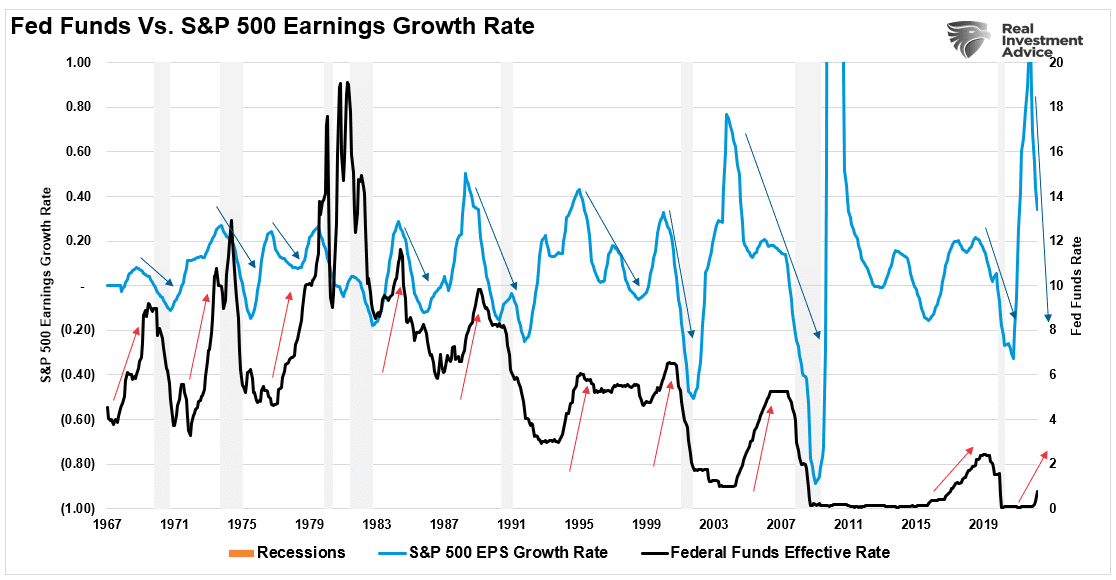
Lastly, given that valuations remain elevated by historical measures, realizing economic recession risks requires further repricing for a coming earnings recession. (Fed rate hikes precede economic slowdowns, recessions, and earnings reversions.)
While the “Fed bluff” was mainly political support for the White House amid a disaster in Presidental approval polls, the one question all investors want to know is when the Fed will pivot.
This Week’s MacroView
When Will The “Fed Bluff” Turn To “Fed Pivot?“
As noted, while the “Fed bluff” tries to convince markets Powell & Co. has things under control, the Fed needs time to hike rates and reduce its balance sheet before the next recession.
In other words, it is a race against time.
As Michael Lebowitz noted earlier this week, the
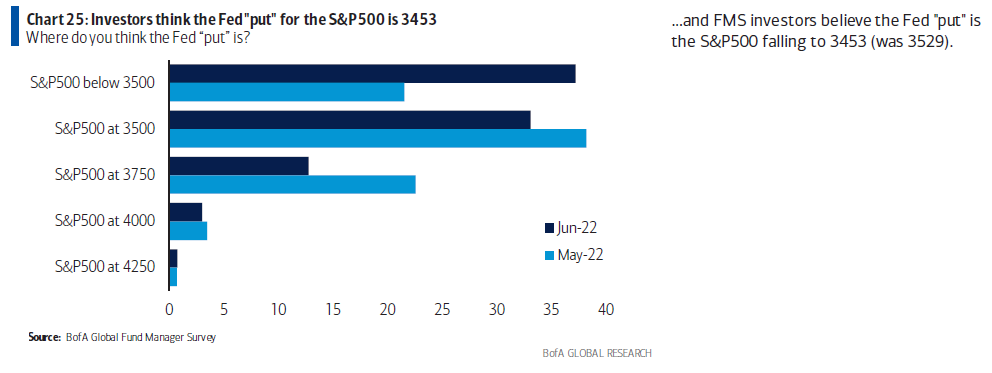
“The illustration below from the Federal Reserve Bank of Chicago helps visualize its mandates. The Dual Mandate Bullseye highlights its 2% core inflation rate and 4.1% unemployment rate objectives.”
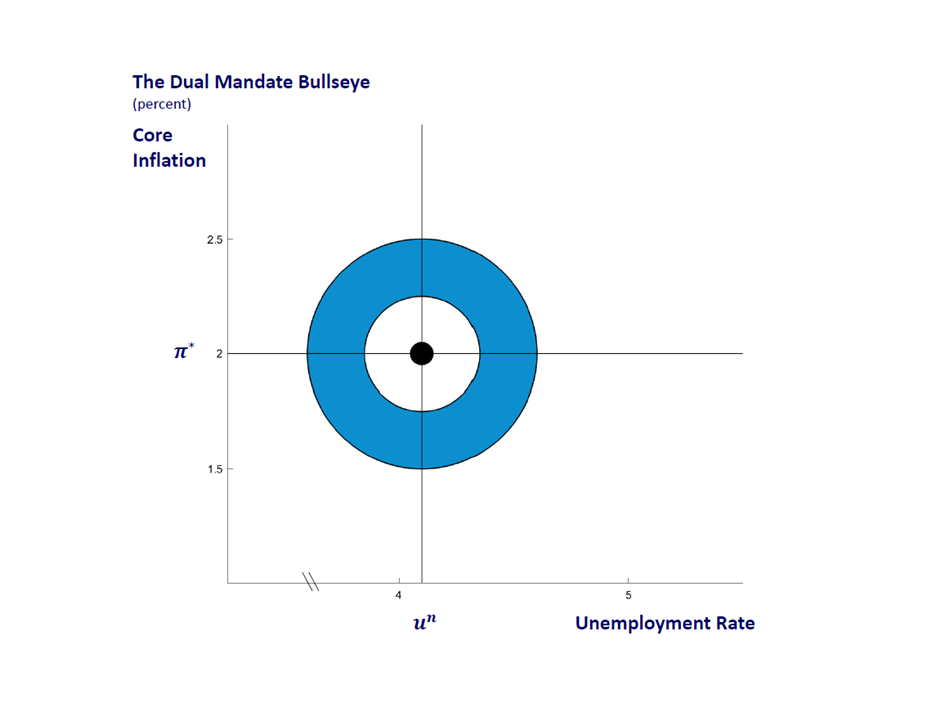
“The Fed is currently way off the mark. As we share below, core CPI is running about 4% above the Fed’s target, and the unemployment rate is about half a percent below their objective.“
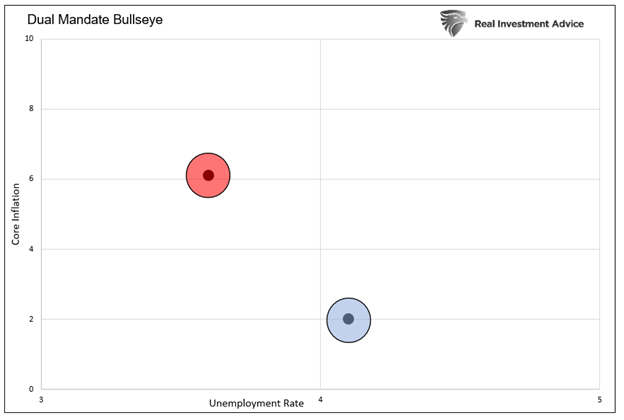
“To address surging inflation, the Fed is taking aggressive actions which might increase joblessness and slow the economy but hopefully reduce inflation.
Higher interest rates and balance sheet reduction (QT) are not good for stock prices. Investors need to consider how much pain the Fed is willing to inflict on stock prices to hit their bullseye. Further, besides significantly lower inflation or a surge in the unemployment rate, what might allow the Fed to deviate from its objectives and save stock prices?”
The most significant risk to the Federal Reserve is “financial stability.” Such is particularly the case with the entirety of the financial ecosystem now more levered than ever. Over the last decade, the Fed has not had to contend with high inflation making it relatively easy to be more hawkish. However, now, as the market calls the “Fed bluff,” his predicament is much worse.
While the Fed may talk a tough game of combating inflation, a recession will take care of that. However, financial instability is a problem that can quickly get out of control with much more significant economic and financial ramifications.
Currently, BofA suggests that some 3500 is the point where the Fed pivots to stave off financial instability.
We will likely soon find out how committed the Fed truly is to the “inflation” fight.
Portfolio Update
As markets remain under pressure, we continue reducing exposure and rebalancing portfolio risks accordingly. There is no easy measure to navigate markets at the moment, but for those who have never been through a bear market, this is just part of the process.
As we discussed, realigning perspective is critical in maintaining control in challenging market environments.
“Anchoring is a heuristic revealed by behavioral finance that describes the subconscious use of irrelevant information, such as the purchase price of a security, as a fixed reference point (or anchor) for making subsequent decisions about that security.
Investors are trained by the financial media to ‘anchor to a fixed point in the market. We measure market performance from the 1st trading day of each year. Or from the peak of an advance.
Yes, the markets are down 20%+ this year but are still up from the previous 2020 peak. Most investors did not buy the 2020 bottom or sell the 2022 peak. These “anchor” points provide little perspective for the average investor regarding where they are relative to their financial goals. However, these “anchors,” tied to constant media updates, feed our emotional decision-making processes driven by “greed” or “fear.”
Those emotionally driven decisions always lead to the worst possible outcomes.
We suggest using any rallies to reduce risk and increase cash levels further until the market provides better clarity. There will be plenty of time to determine if and when the current bearish cycle is over. We remain pretty confident we are not at that point just yet.

My nutrition coach had a great saying about dieting; “make better bad choices.”
We are all going to make bad choices from time to time. The goal is to try and make bad choices that don’t have an outsized effect on our plan. When it comes to dieting, if you eat a burger, order it without cheese and mayonnaise.
When it comes to your portfolio, if you make speculative bets, do it in smaller sizes. Or, if you are leaning towards “panic selling” everything, start by selling some but not all of your holdings.
Importantly, keep your market perspective in check and ensure you aren’t anchoring to something that will lead to poor decisions over time.
More importantly, if you don’t have an investment strategy and discipline you are stringently following, that is an ideal place to begin.
Have a great week.
Market & Sector Analysis
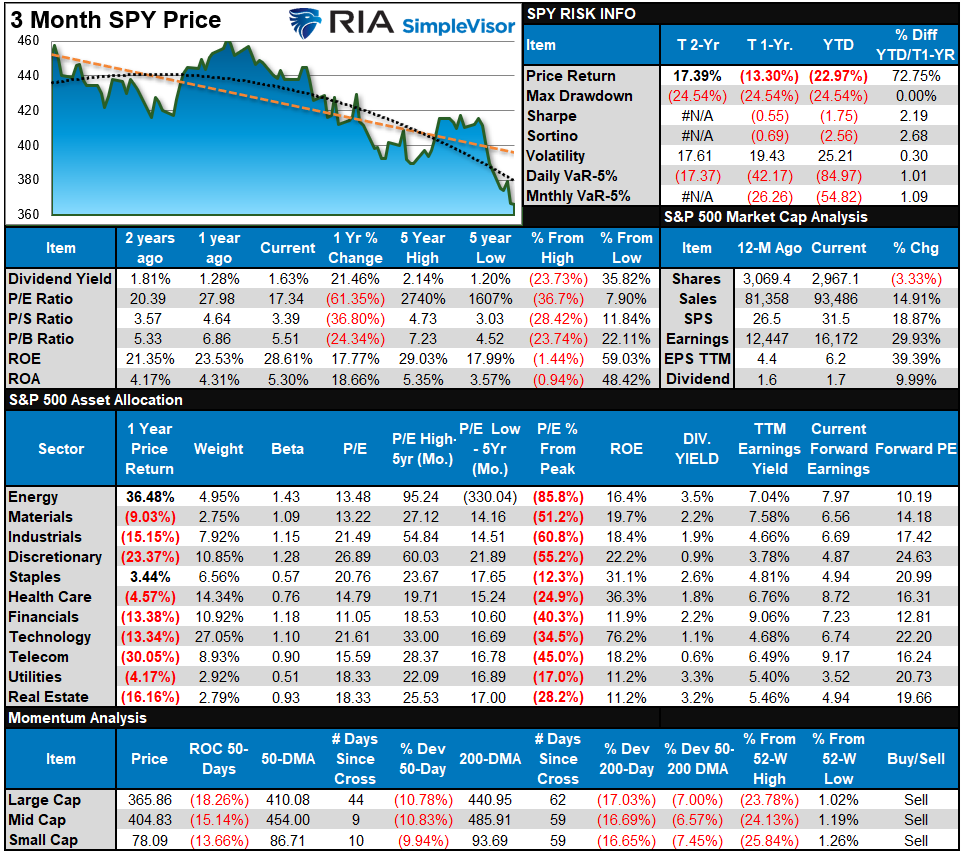
S&P 500 Tear Sheet
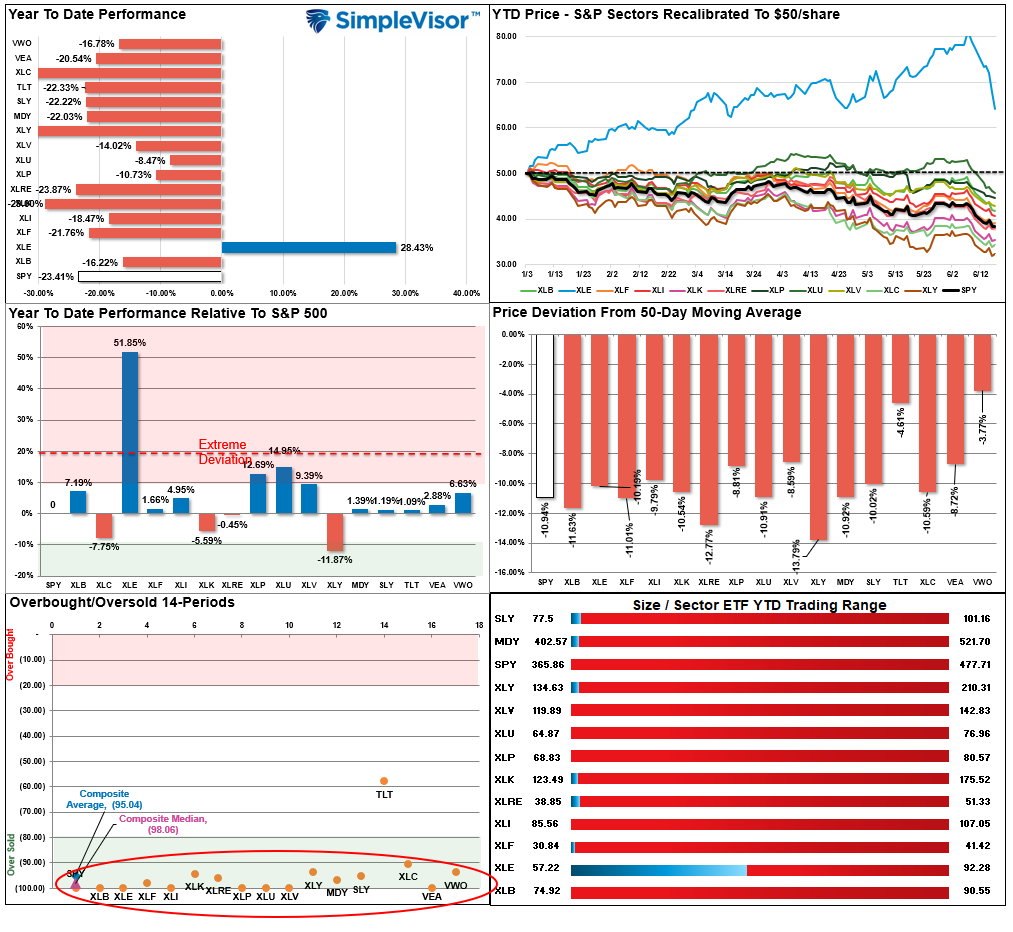
Relative Performance Analysis
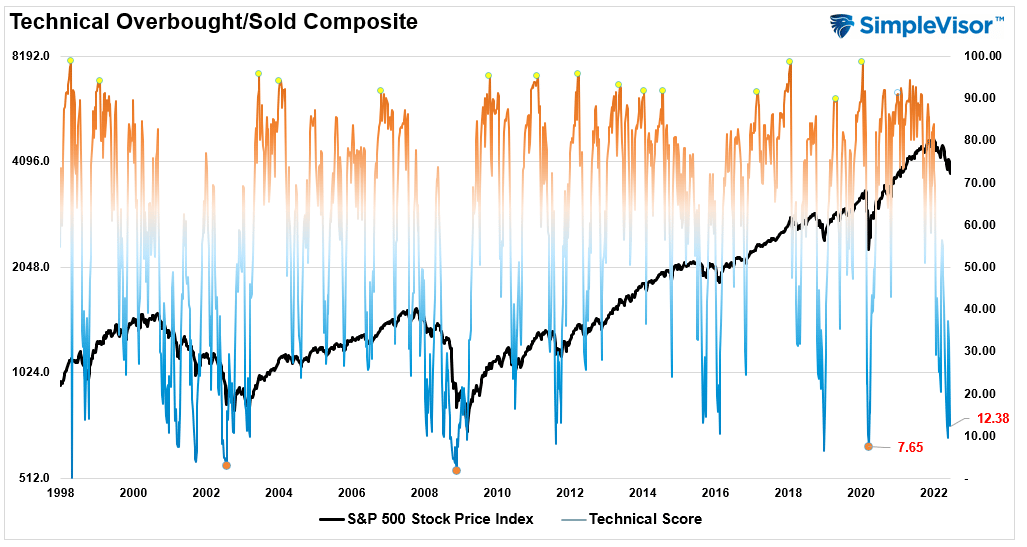
Technical Composite
The technical overbought/sold gauge comprises several price indicators (RSI, Williams %R, etc.), measured using “weekly” closing price data. Readings above “80” are considered overbought, and below “20” are oversold. The current reading is 12.58 out of a possible 100.
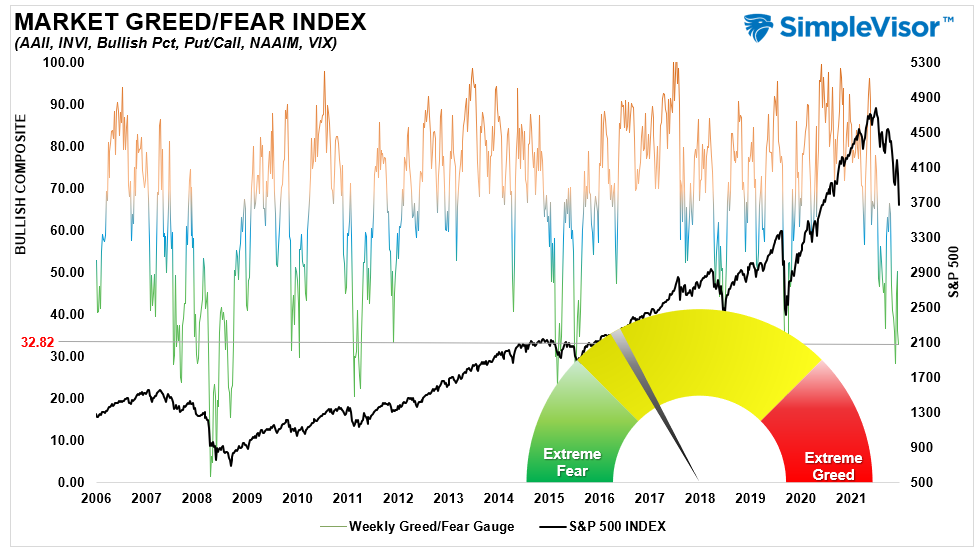
Portfolio Positioning “Fear / Greed” Gauge
The “Fear/Greed” gauge is how individual and professional investors are “positioning” themselves in the market based on their equity exposure. From a contrarian position, the higher the allocation to equities, to more likely the market is closer to a correction than not. The gauge uses weekly closing data.
NOTE: The Fear/Greed Index measures risk from 0 to 100. It is a rarity that it reaches levels above 90. The current reading is 32.82 out of a possible 100.
Sector Model Analysis & Risk Ranges
How To Read This Table
- The table compares the relative performance of each sector and market to the S&P 500 index.
- “M/A XVER” is determined by whether the short-term weekly moving average crosses positively or negatively with the long-term weekly moving average.
- The risk range is a function of the month-end closing price and the “beta” of the sector or market. (Ranges reset on the 1st of each month)
- The table shows the price deviation above and below the weekly moving averages.
- The complete history of all sentiment indicators is under the Dashboard/Sentiment tab at SimpleVisor.

Weekly Stock Screens
Each week we will provide three different stock screens generated from SimpleVisor: (RIAPro.net subscribers use your current credentials to log in.)
This week we are scanning for the Top 20:
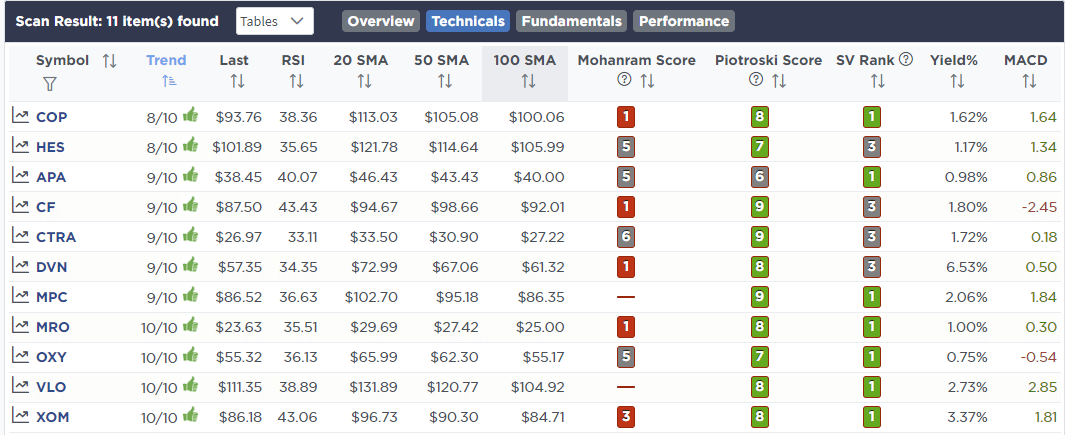
- Relative Strength Stocks
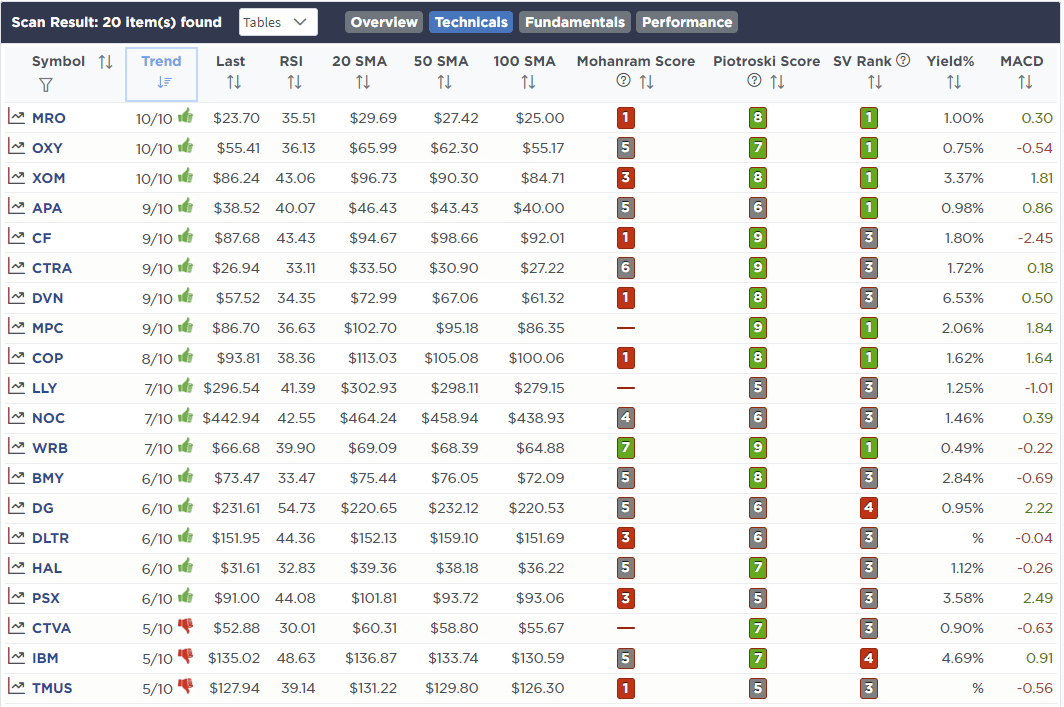
- Momentum Stocks
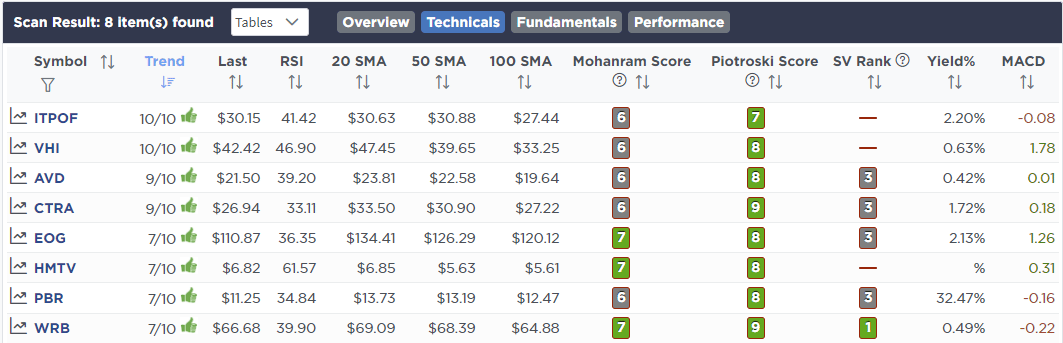
- Technically Strong With Strong Fundamentals
These screens generate portfolio ideas and serve as the starting point for further research.
(Click Images To Enlarge)
RSI Screen
Momentum Screen
Technical & Fundamental Strength Screen
SimpleVisor Portfolio Changes
We post all of our portfolio changes as they occur at SimpleVisor:
June 13th
“As noted in the Market Sector Buy/Sell Review this morning, there are several areas of the market breaking key supports, along with the S&P index taking out support and triggering a MACD sell signal. While we have been raising cash and hedging risk over the last two weeks, we are taking further actions to cut exposure heading into the Fed meeting on Wednesday and options expiration on Friday.
Note: We added to the S&P 500 Short (SH) today but may take it back off at the end of the day if markets finish near lows. With the market down nearly 10% in 3-days, a bounce to add it to portfolios is likely.”
Equity Model
- Selling 100% of AMD (AMD), Nvidia (NVDA), Ford (F), and Goldman Sachs (GS)
- Selling 100% of IEF to prepare for adding to TLT to lengthen the bond duration.
- Increase S&P 500 Short (SH) to 5% of the portfolio.
ETF Model
- Reducing SPDR Financials ETF (XLF) from 3% to 1%
- Cutting SPDR Real Estate ETF (XLRE) from 2.5% to 1.5%
- Reducing SPDR Technology ETF (XLK) from 8% to 6%.
- Selling down SPDR Healthcare ETF (XLV) from 9% to 8%.
- Selling 100% of IEF to prepare for adding to TLT to lengthen the bond duration.
- Increasing S&P 500 Short (SH) to 5% of the portfolio.
June 14th
“This morning we reduced our S&P 500 Short position by 50% for a couple of reasons:“
- The market is oversold on a short-term basis and could bounce on any surprise comments from the Fed tomorrow.
- We are holding a lot of cash after the sales we made yesterday, so reducing the hedge a bit here doesn’t change our downside protection much but will allow the portfolio to participate a bit better during a potential bounce.
“We sold the position with a small gain after yesterday’s decline. Therefore, we don’t have to worry about wash sale rules to add it back to the model on any bounce over the next few days.“
Both Models
- Sell 50% of the S&P 500 Short ETF (SH)
June 17th
“With the market back to more extreme oversold levels on a short-term basis, and trading into 3-standard deviations below the 50-dma, we are set up for a decent reflexive rally back to 4000 on the index. While there is downside risk to the markets currently, we are well underweight equities and are holding a large cash position. Therefore, we are going to take the profits in the remaining shares of our Short S&P 500 Index (SH) trade and look to add back that hedge on any rally.”
Equity & ETF Models
- Sell 100% of the S&P 500 Short ETF (SH)

Lance Roberts, CIO
Have a great week!


