Russell Explodes Higher As Rotation Takes Hold


Inside This Week’s Bull Bear Report
- Russell 2000 Explodes Higher
- How We Are Trading It
- Research Report – Can Mega-Caps Continue Their Dominance?
- Youtube – Before The Bell
- Market Statistics
- Stock Screens
- Portfolio Trades This Week
Market Hits A Snag
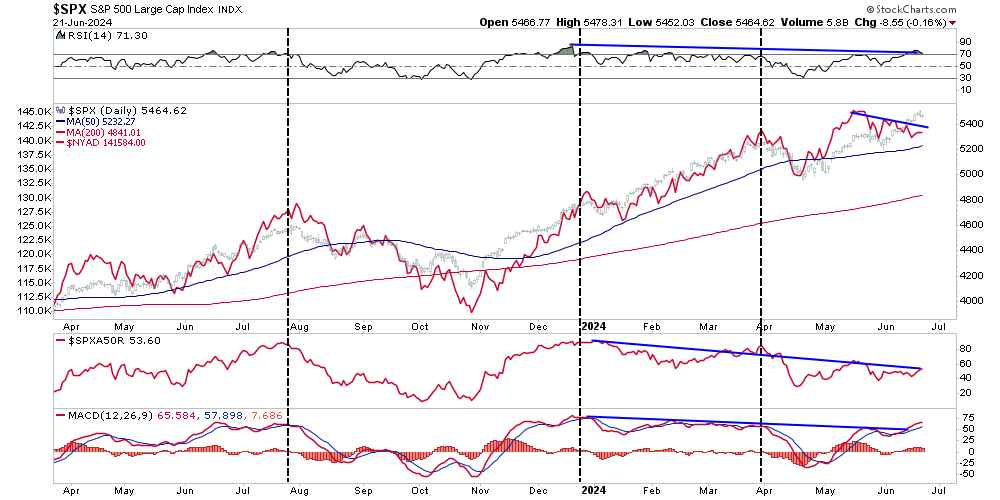
Last week, we noted that the market did flip the previous “sell signal,” with stocks topping 5600 for the first time. However, that move also pushed the market back into extremely overbought territory, and the deviation from the 50-DMA is quite significant. As noted:
“Such suggests that, as we saw in late May and June, the market will either consolidate or correct back to the 20-DMA. If the bulls can hold that level again, as they have, the market could continue to push higher. Such is possible given the current exuberance surrounding the Fed cutting rates. However, if the 20-DMA fails, as in early April, the 50-DMA becomes the next logical support, with the 100-DMA close behind. Such would encompass another 3-5% correction.“
On Friday, the market broke the 20-DMA and flipped the MACD indicator back onto a short-term “sell signal.” While we will likely see a rally early next week, a failure to close above the 20-DMA may suggest a further correction to the 50-DMA. A further correction is possible with the market oversold and triggering a fresh sell signal. Those triggers led us to take profits out of several positions this past week to hedge against a further decline. We will raise cash levels further if technical deterioration continues.
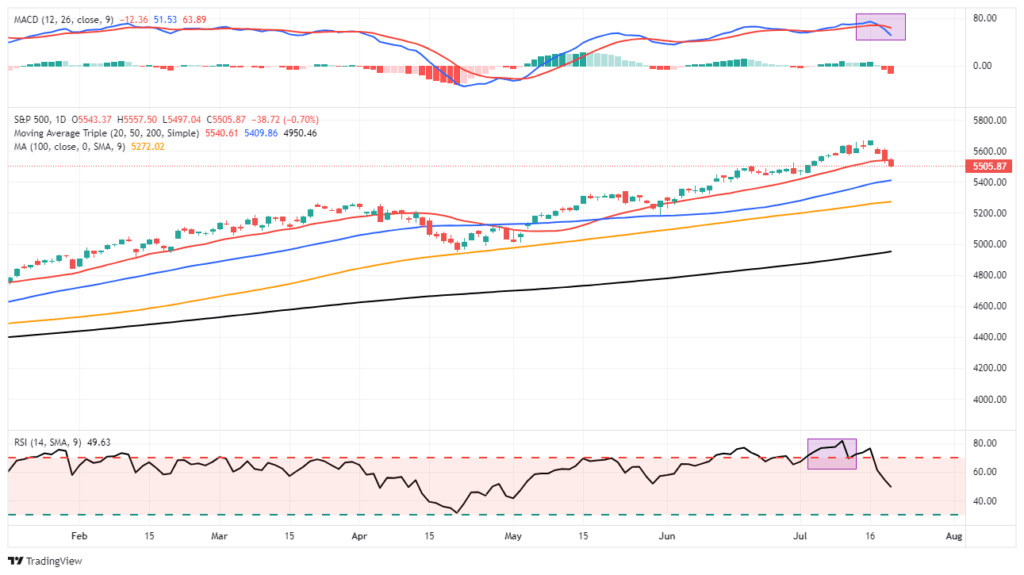
While there has been some angst this week over the pullback, this remains an ordinary correction in a bullish market trend. As shown, volatility remains suppressed, suggesting no real market panic.
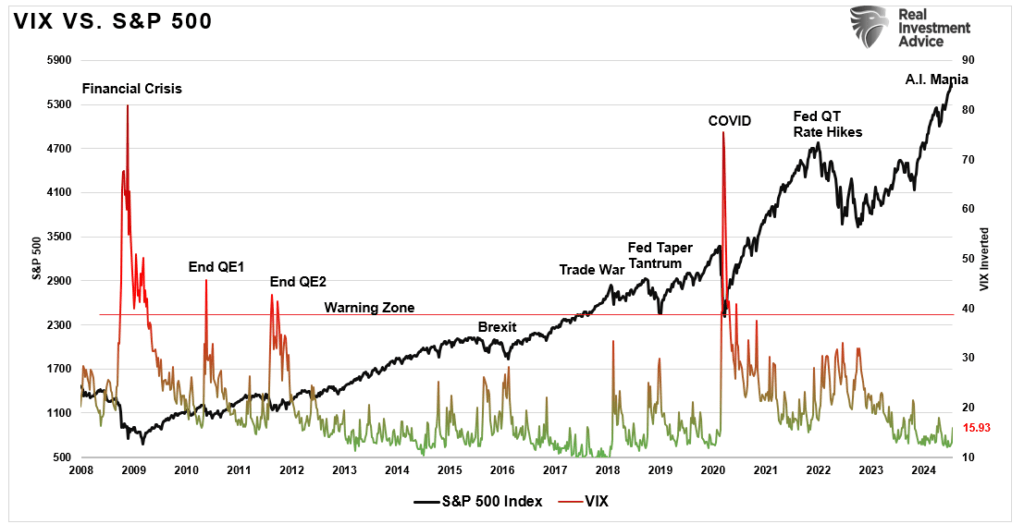
While expected for some time, this correction process could accelerate into a more significant decline. However, few indicators indicate a more severe crack in market internals. Next week, the market will provide more clues about what happens next.
The big story this past week was the rapid rotation from the “Mega-cap” stocks to the Russell 2000. That rotation surprised many managers, leading to a rapid derisking of portfolios. To wit:
“The de-grossing activity over the past 5 sessions is the largest since Nov ’22 and ranks in the 99th percentile on a 5-year lookback.”
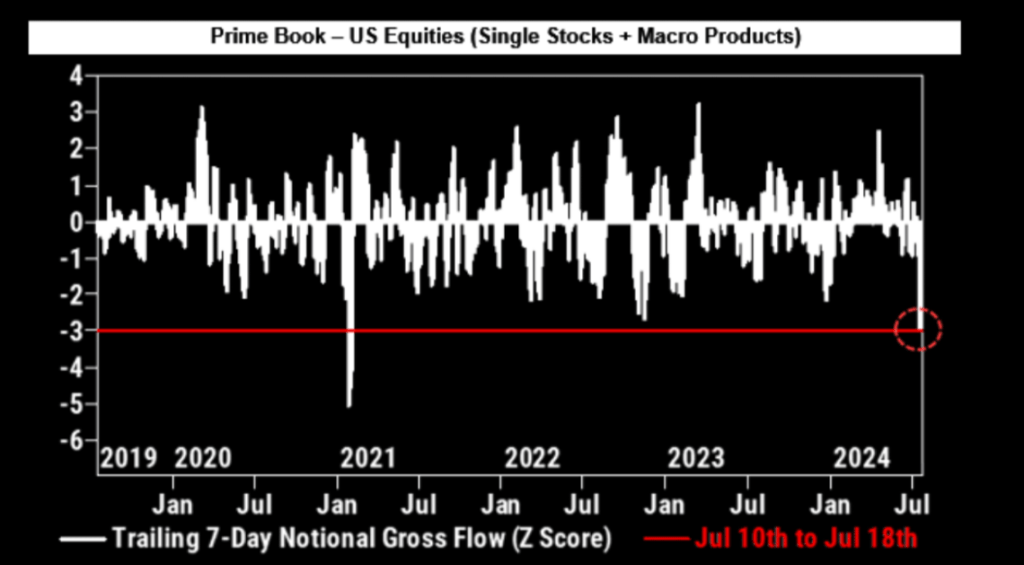
However, we will explore this week whether this rotation is sustainable or just a function of short-covering.
Need Help With Your Investing Strategy?
Are you looking for complete financial, insurance, and estate planning? Need a risk-managed portfolio management strategy to grow and protect your savings? Whatever your needs are, we are here to help.

Russell Explodes Higher As Rotation Begins
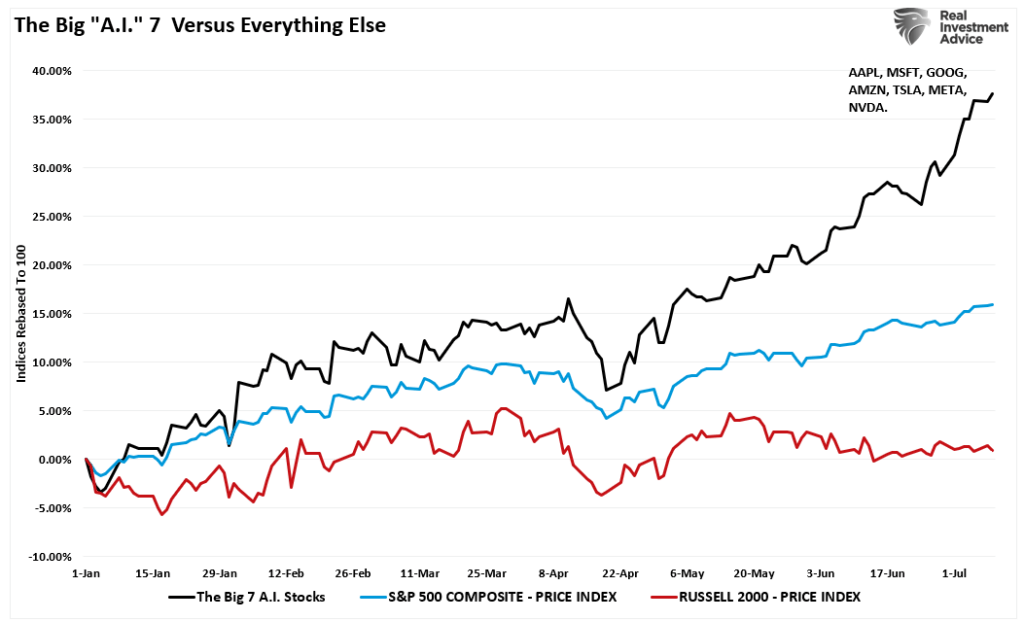
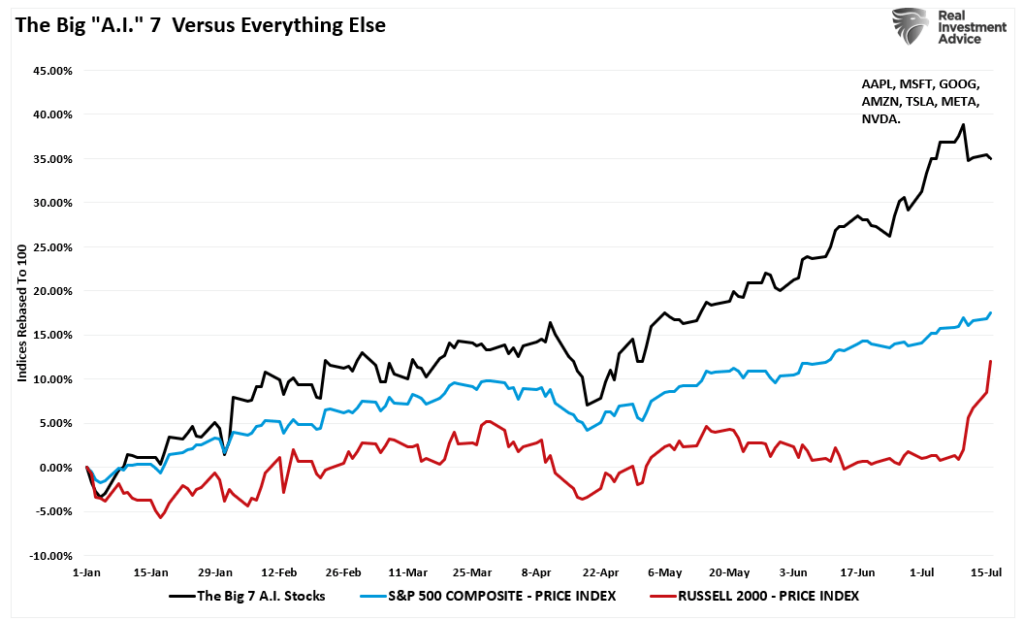
This year’s big story has been the massive outperformance of the “Magnificent 7” stocks compared to “everything else.” The performance gap was immense through the end of last week, as nothing seemed to deter the chase into just a small handful of stocks.
In mid-June, we noted in “Bad Breadth” that the lopsided rally certainly caused some concern. To wit:
While the market is making all-time highs as momentum continues, its breadth is narrowing. The number of stocks trading above their respective 50-DMA continues to decline as the market advances, along with the MACD signal. Furthermore, the NYSE Advance-Decline line and the Relative Strength Index (RSI) have reversed, adding to the negative divergences from a rising market. While this does not mean the market is about to crash, it does suggest that the current rally is weaker than the index suggests.
These negative divergences have often preceded short to intermediate-term corrective market actions. At this point, investors tend to make two mistakes. The first is overreacting to these technical signals, thinking a more severe correction is coming. The second is taking action too soon.
Despite those concerns, the market continued to push higher, given the strong momentum push behind those stocks.
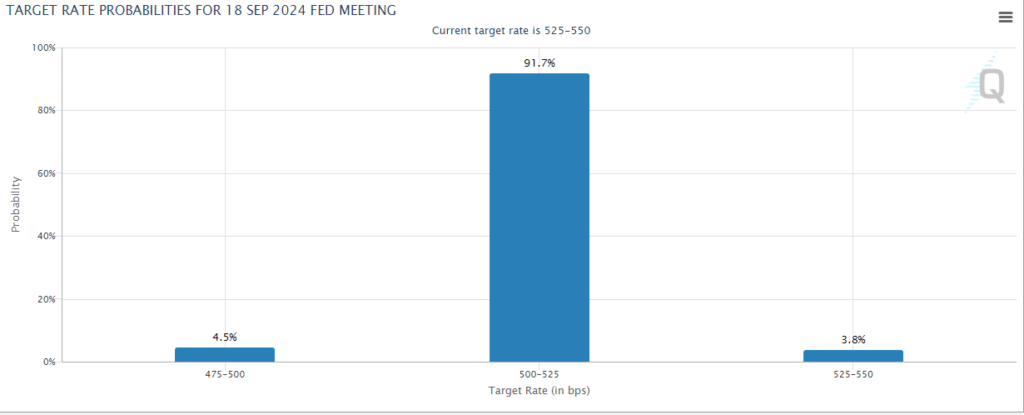
However, that sentiment changed last week following a weaker-than-expected inflation report. With inflation cooling and Jerome Powell stating he wants to act sooner rather than later, the odds of a rate cut by September surged higher. At the same time, the 10-year treasury rate fell further, which supported interest rate-sensitive sectors of the market.
That drop in yields created a “panic” rotation in the market from the “Mega-7” stocks to “everything else.” However, despite that surge, the performance gap is still substantial year-to-date.
As shown, the drop in yields catalyzed the recent rotation. However, that is more of an anomaly than not.
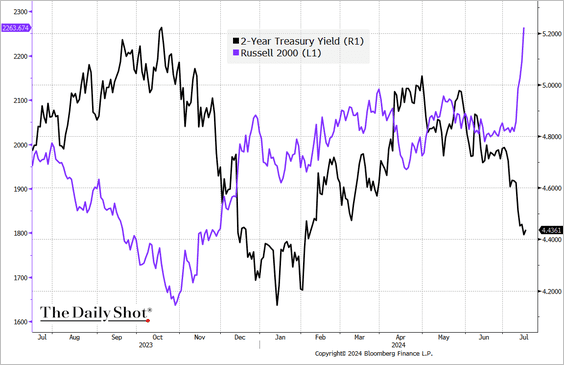
On a longer-term basis, the decline in yields has not supported rallies in the Russell 2000. That is because when yields are declining, they reflect weakening economic activity on which smaller-capitalization companies are dependent for earnings.
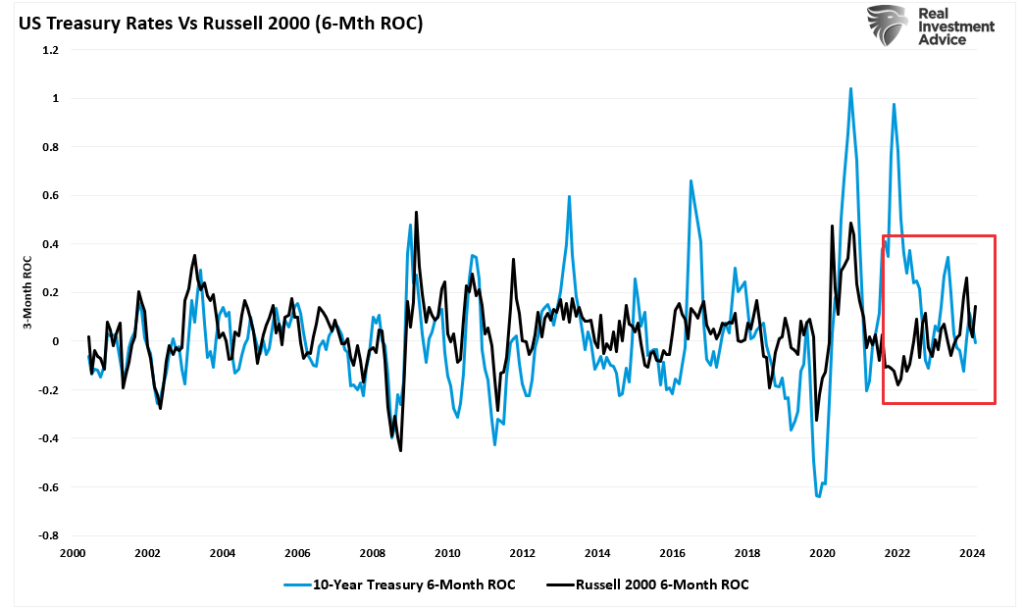
The recent run in Russell is more likely a result of massive short-covering in many of those companies and a risk rotation from the mega-cap stocks. Such extreme and rapid rotations have historically been unsustainable, but could this time be different?
Is This The Russell’s Big Moment?
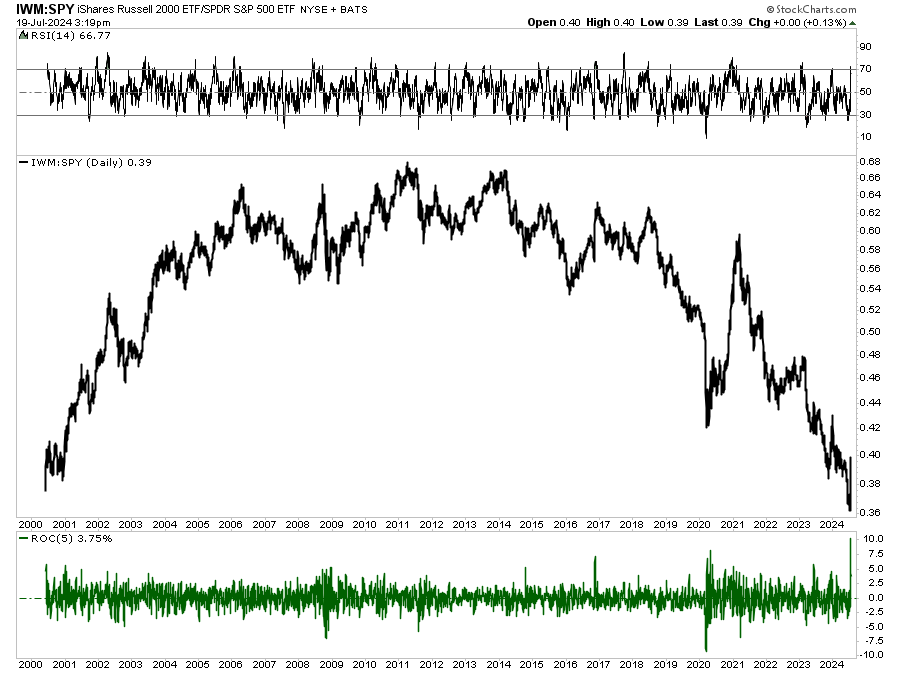
There has been consistent chatter about the Russell 2000’s lack of performance relative to other markets for the last couple of years. The commentary primarily consists of the idea that, eventually, a rotation would occur, and the Russell 2000 would shine. However, that underperformance is not recent; it has accelerated over the last decade. More importantly, it is not just the Russell 2000 but virtually every major market, including Gold, Bonds, and Oil, over that time frame. In other words, you have consistently underperformed the benchmark index if you owned assets other than the S&P 500 and the Nasdaq over the last decade.
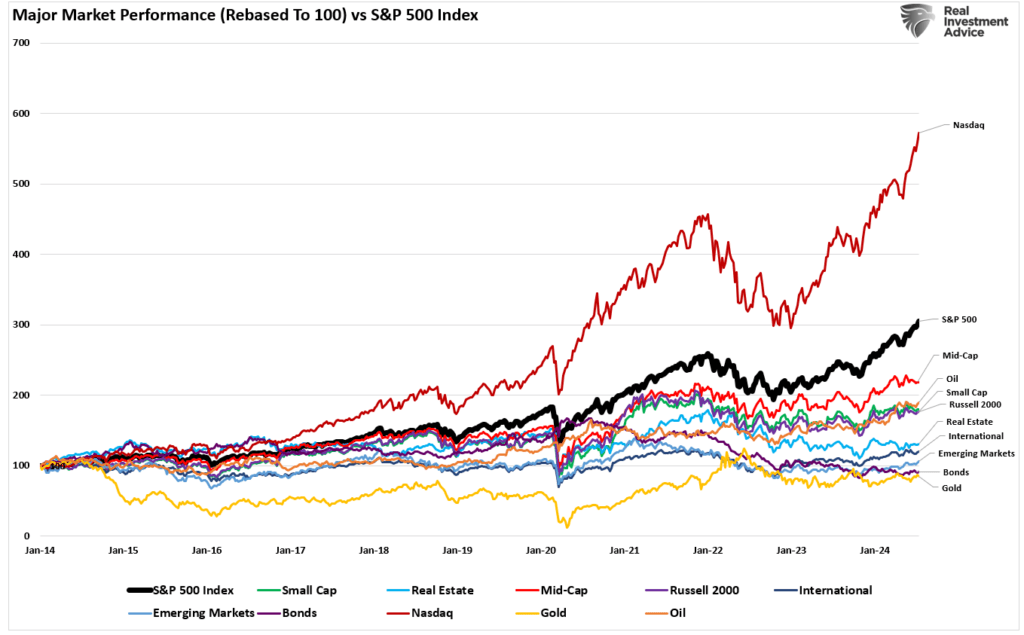
That is the problem with benchmarking the performance of your portfolio to an index.
More importantly, while the Russell 2000 index has seen a terrific run over the last few days, keeping that rally in context is essential. First, if you had invested in Russell 2000 since the beginning of 2022, you would still not be back to even.
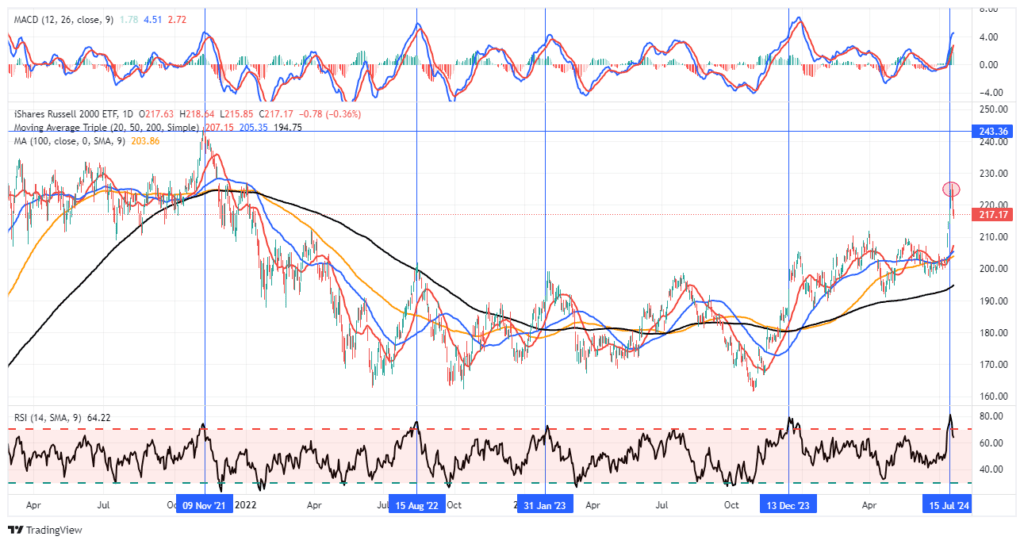
Secondly, as I noted on Twitter on Wednesday, the 5-day rate of change was enormous. Such a change has only occurred a few times in the last 25 years. Those extremes have rarely been sustainable and typically lead to lower returns in the short term.
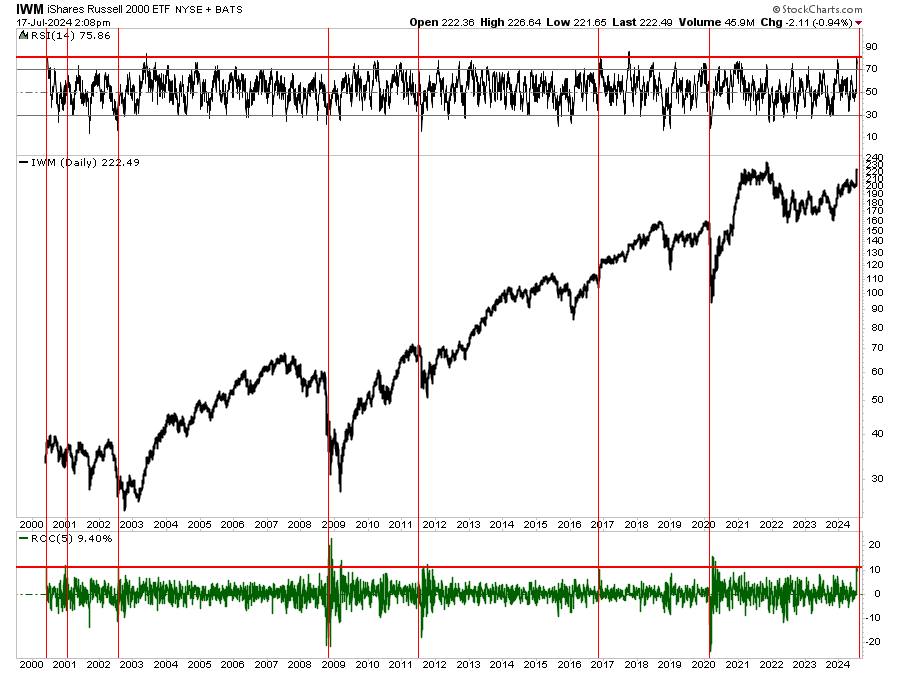
From a technical perspective, the recent rally has become extremely extended and overbought. Previously, such periods have been an excellent place to take profits and rebalance risks. Such rapid increases have historically been unsustainable, but that doesn’t mean a rally can not continue. However, the more extreme deviations suggest these stocks will likely need to correct or consolidate before the rally can continue.
Lastly, while many hope this is a new paradigm shift from large to small caps, we have repeatedly seen these short-term rotations since 2014. Each time, the short-term burst of outperformance gave way back to large caps.
While it is certainly possible for this rotation to be “different this time,” the index will need to conquer numerous headwinds.
Headwinds Remain
With the Fed cutting rates and the prospect of a pro-growth, tax-cut, and tariff-friendly President, it is unsurprising to see narratives about why the market rally will broaden with Small and Mid-capitalization companies taking leadership.
However, while such could be the case, many problems still plague these companies.
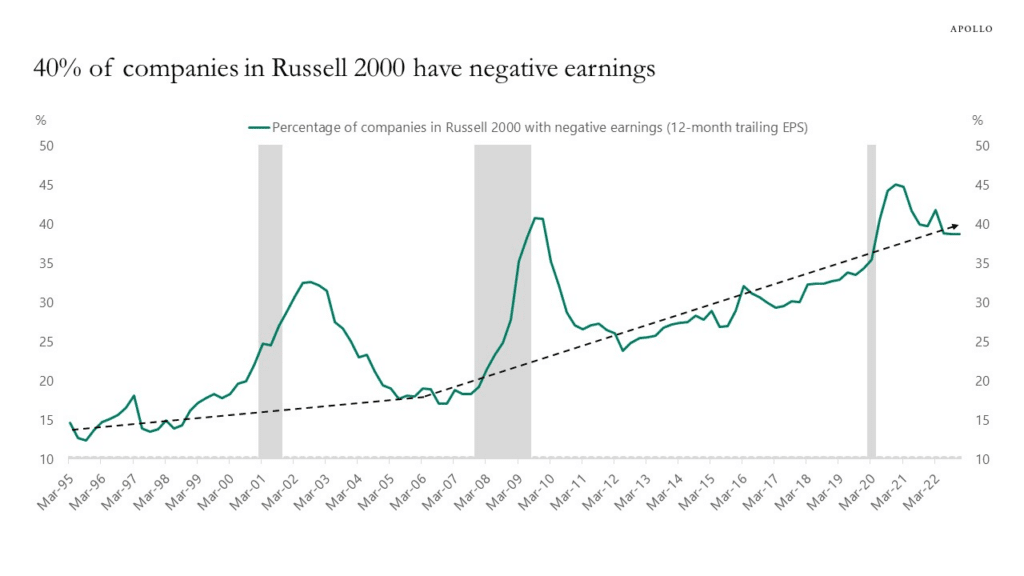
First, nearly 40% of the Russell 2000 is unprofitable. As we discussed previously:
“However, some issues also plague smaller capitalization companies that remain. The first, as noted by Goldman Sachs, remains a fundamental one.
“I’m surprised how easy it is to find someone who wants to call the top in tech and slide those chips into small cap. Aside from the prosect of short-term pain trades, I don’t get the fundamental argument for sustained outperformance of an index where 1-in-3 companies will be unprofitable this year.”
As Apollo’s chart below shows, in the 1990s, 15% of companies in the Russell 2000 had negative 12-month trailing EPS. Today, that share is 40%.
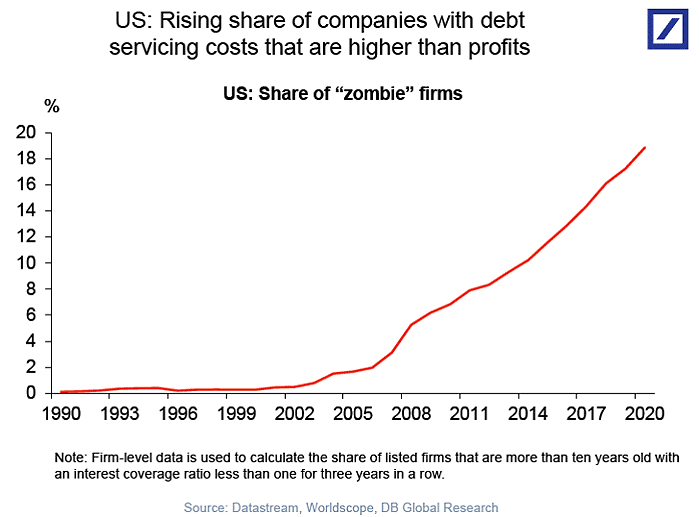
Secondly, many of the companies in the Russell 2000 are heavily leveraged and dependent on debt issuance to stay afloat (a.k.a. zombies). These companies are highly susceptible to actual changes in the underlying economy.
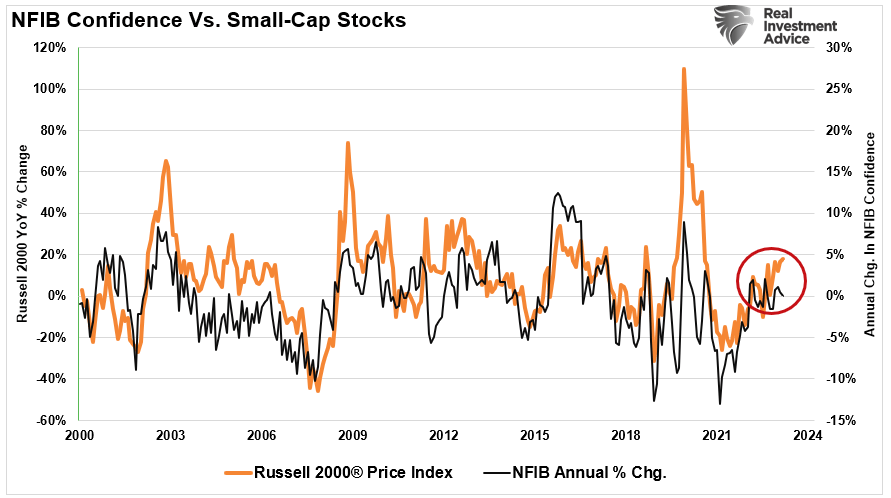
As noted, small-cap companies are highly dependent on more robust economic activity. We see this issue by comparing the annual rate of change in the sentiment of the National Federation of Independent Business to that of Russell 2000. The current gap is likely unsustainable. Either the economy will improve markedly, boosting small business sentiment, or Russell will catch down to the sentiment. That is something worth paying attention to.
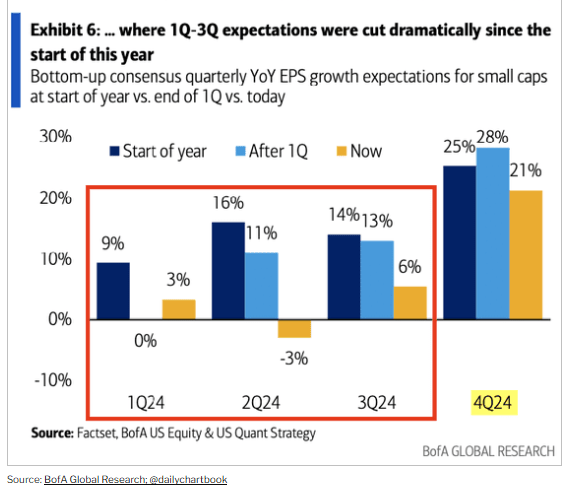
Furthermore, with a slowing economy, these companies depend highly on the consumer to generate revenues. As consumption decreases, so does their profitability, which will weigh on share performance. Already this year, earnings expectations for small-cap companies have been cut sharply. While analysts are still optimistic looking forward, the risk to those expectations is at risk as the economy slows.
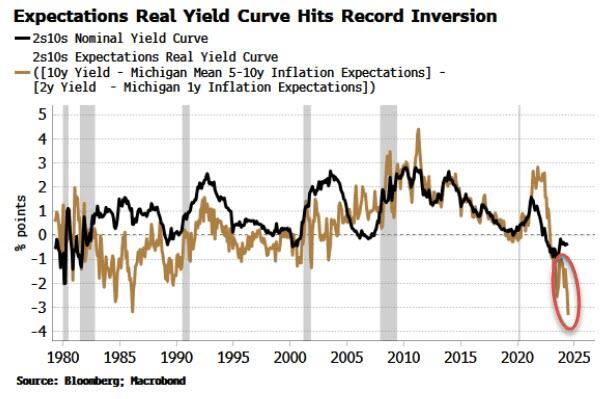
Such was a point made by Simon White via Bloomberg last week:
“The yield curve based on inflation expectations has flattened significantly and is now more inverted than it ever has been – and it will remain under pressure in the event of a Trump presidential victory. This “expectations curve” shows that consumers are anticipating much tighter financial conditions than inferred by the market via the nominal yield curve, presenting a risk to consumption, broader economic growth and equity valuations and returns.“
Lastly, the companies in the Russell 2000 (a good proxy for small- and mid-capitalization companies) do not have the financial capital to execute large-scale buybacks to support asset prices and offset slowing earnings growth by reducing share count. As noted previously, since 2000, corporations have been the sole net buyers of equities, which has created a very substantial outperformance over time between the S&P 500 and the Russell 2000.
That dynamic will not change, and if corporations continue to remain the sole net buyers of equities, then we will likely see a return to underperformance by the Russell 2000.
How We Are Trading It
We have discussed the need for a correction in the large-cap stock indices for the last few weeks. We suspect that while the recent rotation has been quite breathtaking, it is most likely a temporary phenomenon. Large caps, particularly the “Mega-7,” are correcting that more extreme overbought condition. However, we suspect managers will buy the decline needing that exposure, particularly since most earnings growth comes from those companies.
Notably, please do not mistake our position. There are certainly reasons why the Russell can continue its rally going forward. However, that rally will most likely become much more modest as the realities of a slowing economic environment and earnings growth become factors.
The current rotation is a healthy process within the bullish market environment. Portfolio managers can derisk their overweight technology positions and gain an opportunity in the Russell 2000. This rotational process can undoubtedly last for a while, which could keep the broader markets from a more significant decline. However, the increased volatility can make such a rotation hard to navigate, so move slowly for now.
As noted, the Russell is highly overbought. If you want to add some small or mid-cap exposure to your portfolio, you may be rewarded for being patient for a better entry opportunity.
Have a great week.
Research Report
Subscribe To “Before The Bell” For Daily Trading Updates
We have set up a separate channel JUST for our short daily market updates. Please subscribe to THIS CHANNEL to receive daily notifications before the market opens.
Click Here And Then Click The SUBSCRIBE Button
Subscribe To Our YouTube Channel To Get Notified Of All Our Videos
Bull Bear Report Market Statistics & Screens

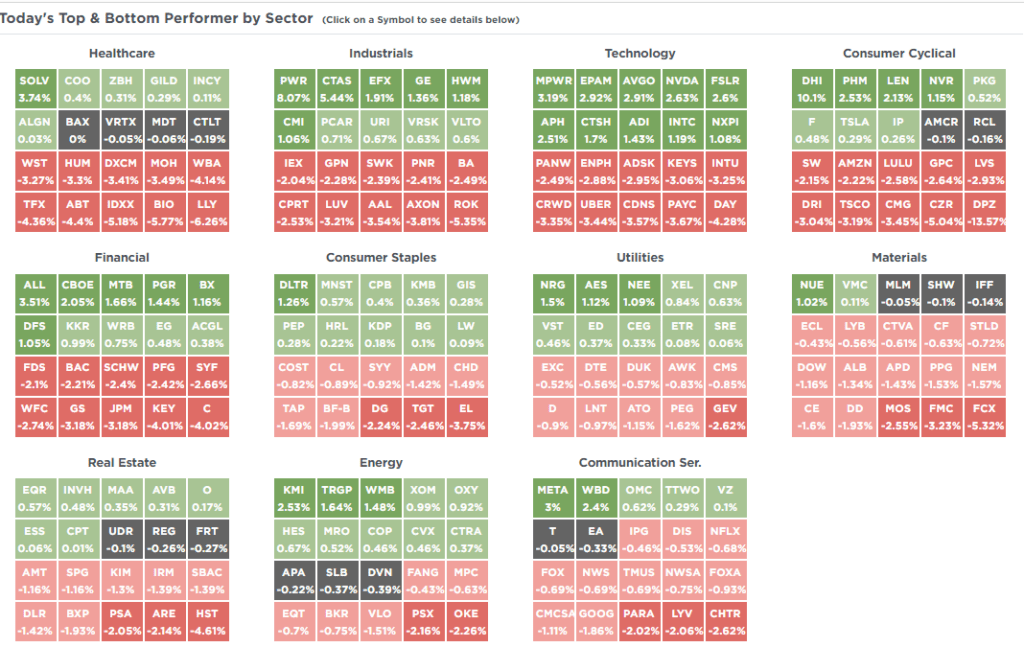
SimpleVisor Top & Bottom Performers By Sector
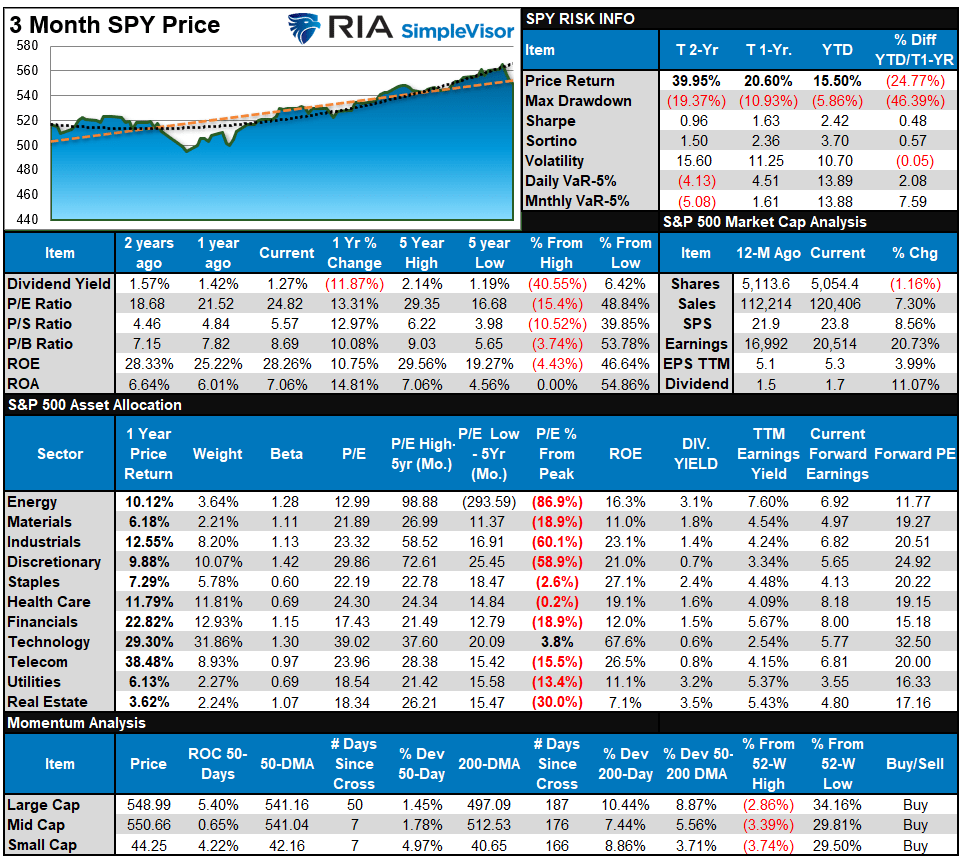
S&P 500 Weekly Tear Sheet
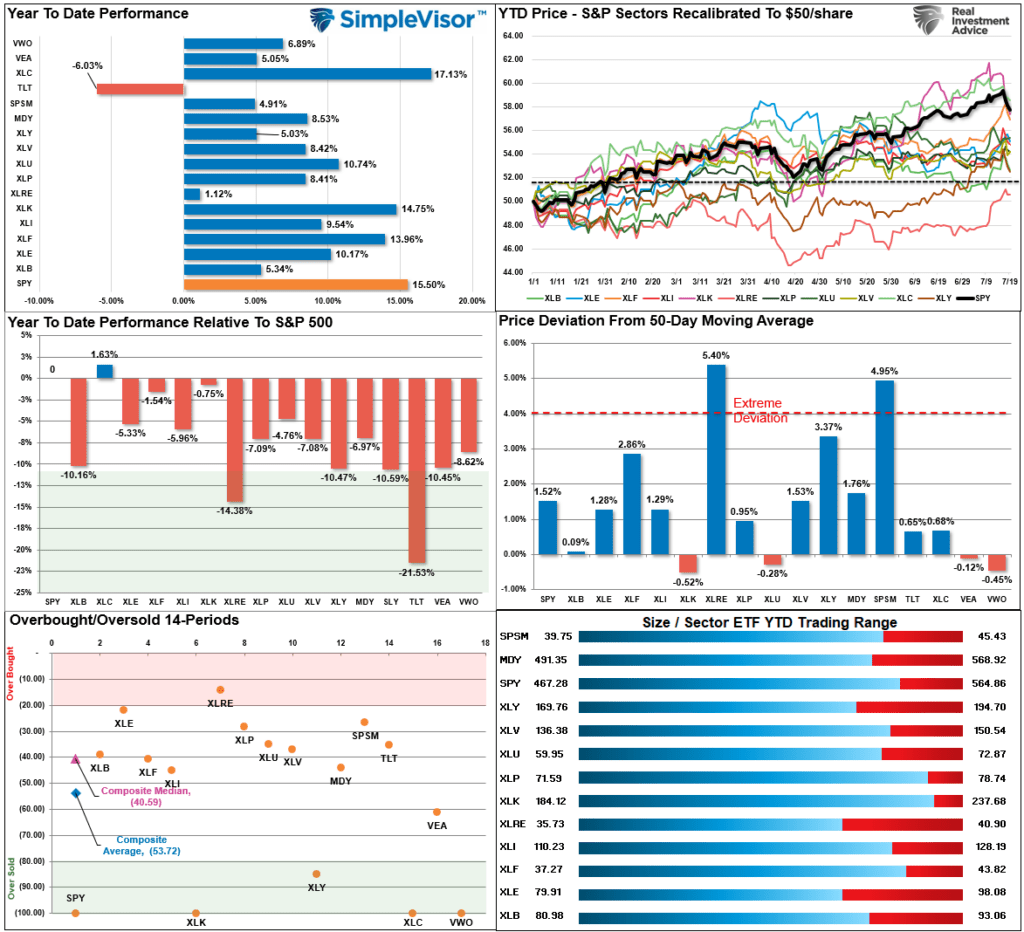
Relative Performance Analysis
As we have discussed over the last few weeks, the recent surge above 5600 took the markets into more extreme overbought territory. Historically, such overbought conditions lead to either a consolidation or short-term correction. That correction began this past week, and while the S&P 500 is due for a short-term bounce, we suspect there may be more corrective action to occur before it is complete. Reduce risk by taking profits and raising cash levels as needed.
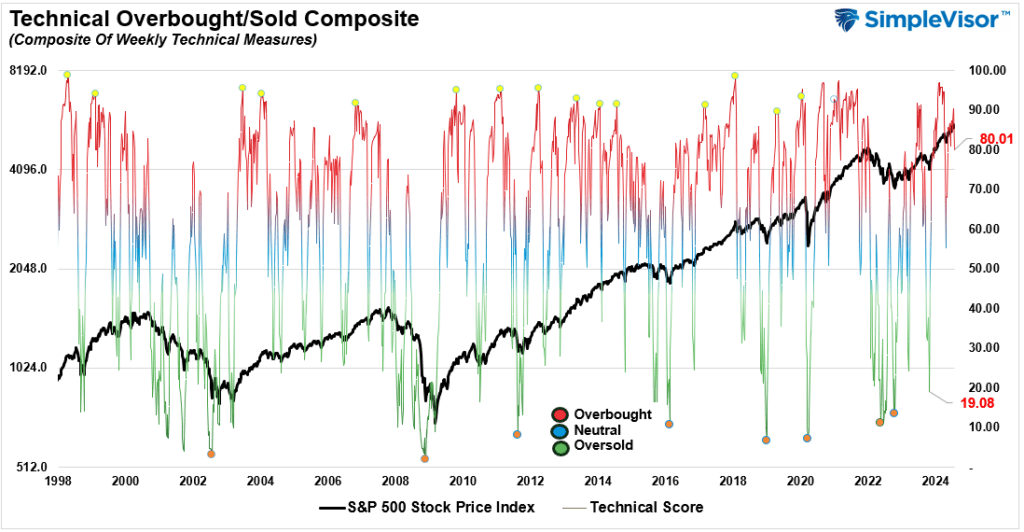
Technical Composite
The technical overbought/sold gauge comprises several price indicators (R.S.I., Williams %R, etc.), measured using “weekly” closing price data. Readings above “80” are considered overbought, and below “20” are oversold. The market peaks when those readings are 80 or above, suggesting prudent profit-taking and risk management. The best buying opportunities exist when those readings are 20 or below.
The current reading is 80.01 out of a possible 100.
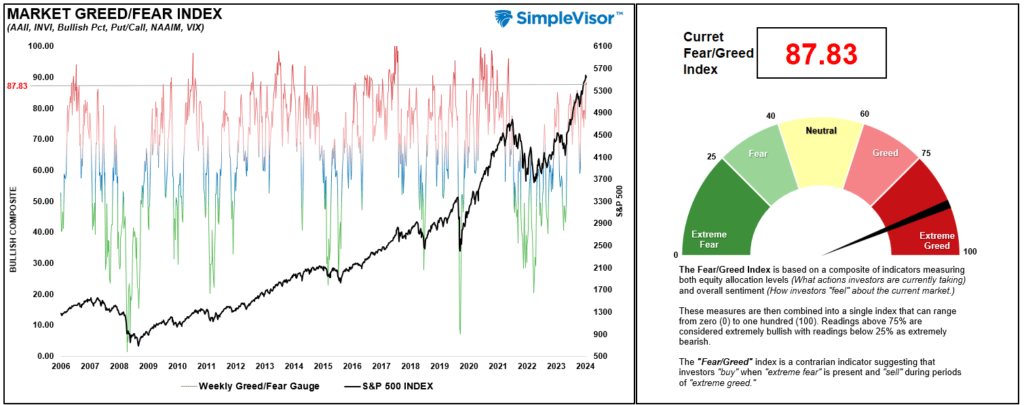
Portfolio Positioning “Fear / Greed” Gauge
The “Fear/Greed” gauge is how individual and professional investors are “positioning” themselves in the market based on their equity exposure. From a contrarian position, the higher the allocation to equities, the more likely the market is closer to a correction than not. The gauge uses weekly closing data.
NOTE: The Fear/Greed Index measures risk from 0 to 100. It is a rarity that it reaches levels above 90. The current reading is 87.83 out of a possible 100.
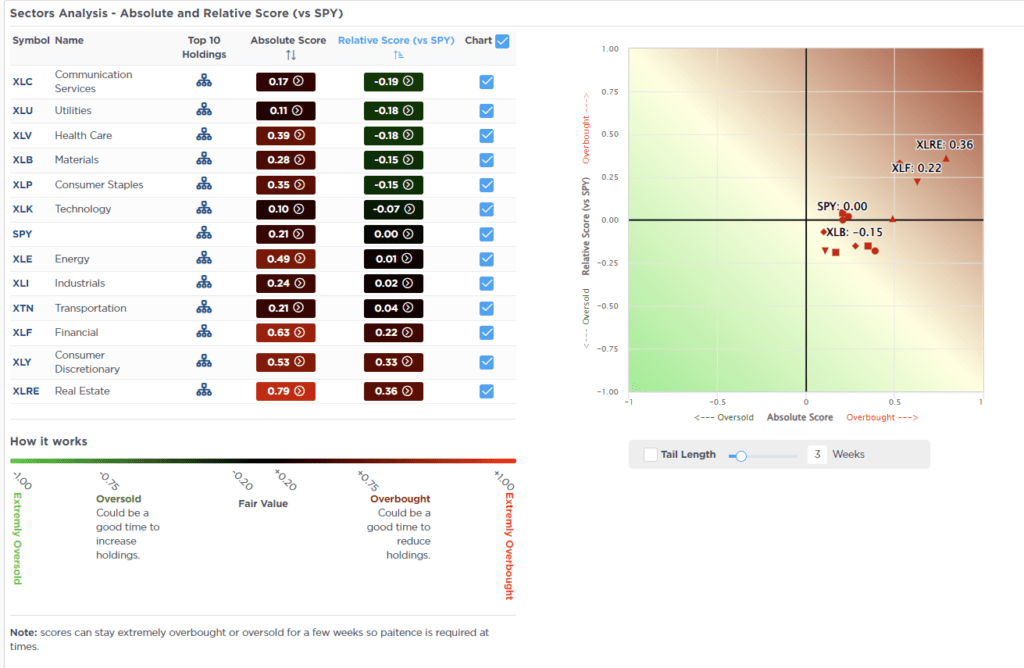
Relative Sector Analysis
Most Oversold Sector Analysis
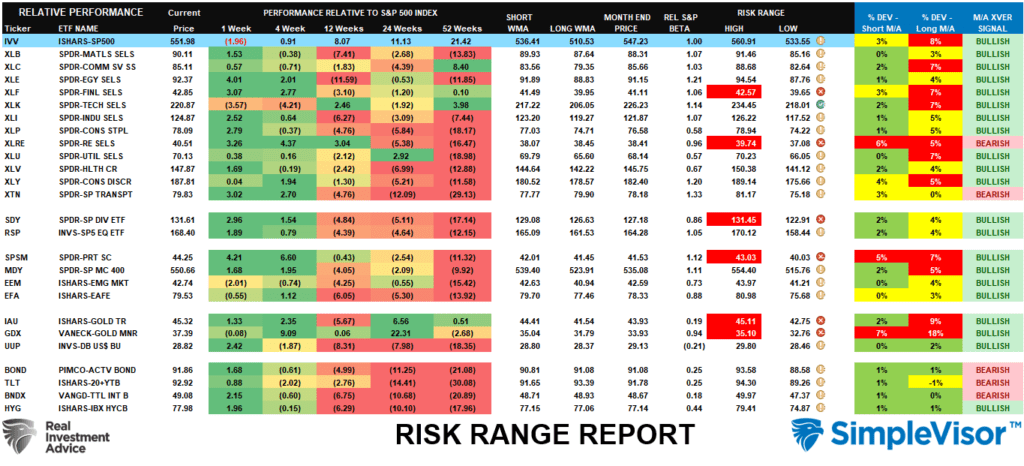
Sector Model Analysis & Risk Ranges
How To Read This Table
- The table compares the relative performance of each sector and market to the S&P 500 index.
- “MA XVER” (Moving Average Crossover) is determined by the short-term weekly moving average crossing positively or negatively with the long-term weekly moving average.
- The risk range is a function of the month-end closing price and the “beta” of the sector or market. (Ranges reset on the 1st of each month)
- The table shows the price deviation above and below the weekly moving averages.
Last week, we noted that several sectors and markets, including the S&P 500, traded well above their respective risk/reward ranges. Such was particularly the case with Gold and Gold Miners, whose deviations from long-term moving averages were double digits. Unsurprisingly, many of those more extreme deviations were corrected in the past week. Financials, Real Estate, Small Caps, Gold, and Gold Miners are still extended, so we may see more consolidation next week. Continue to manage risk for now.
Weekly SimpleVisor Stock Screens
We provide three stock screens each week from SimpleVisor.
This week, we are searching for the Top 20:
- Relative Strength Stocks
- Momentum Stocks
- Fundamental & Technical Strength W/ Dividends
(Click Images To Enlarge)
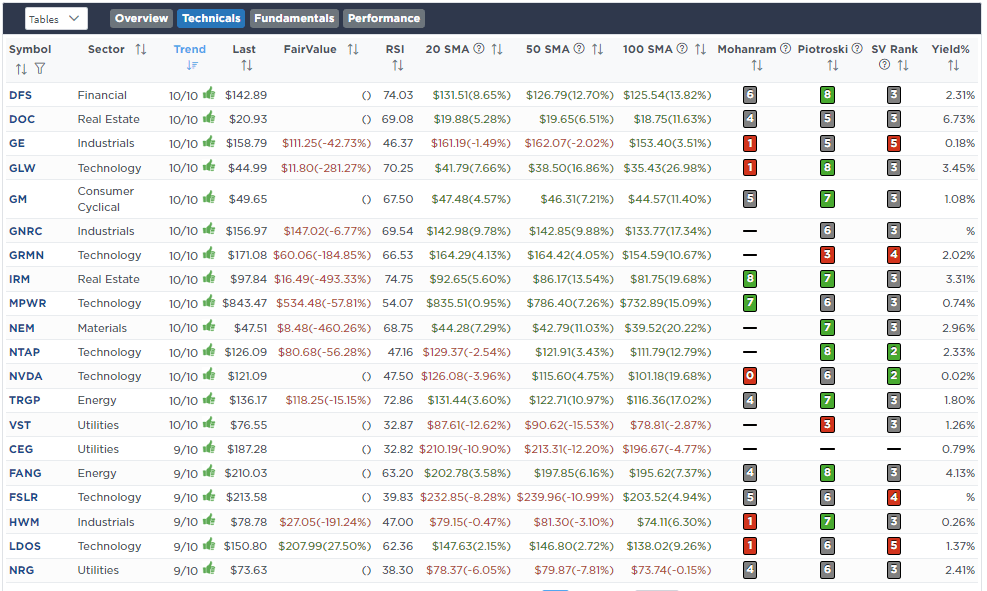
RSI Screen
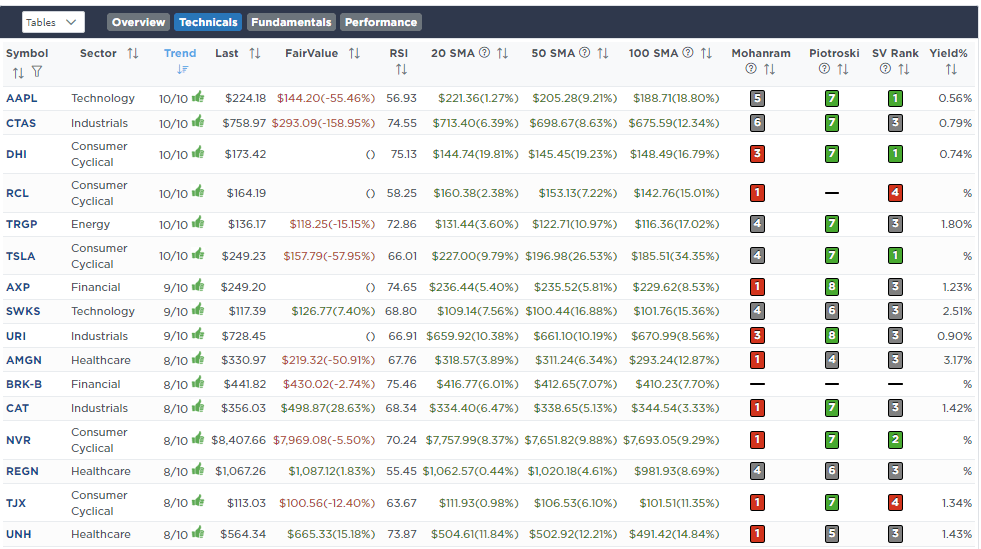
Momentum Screen
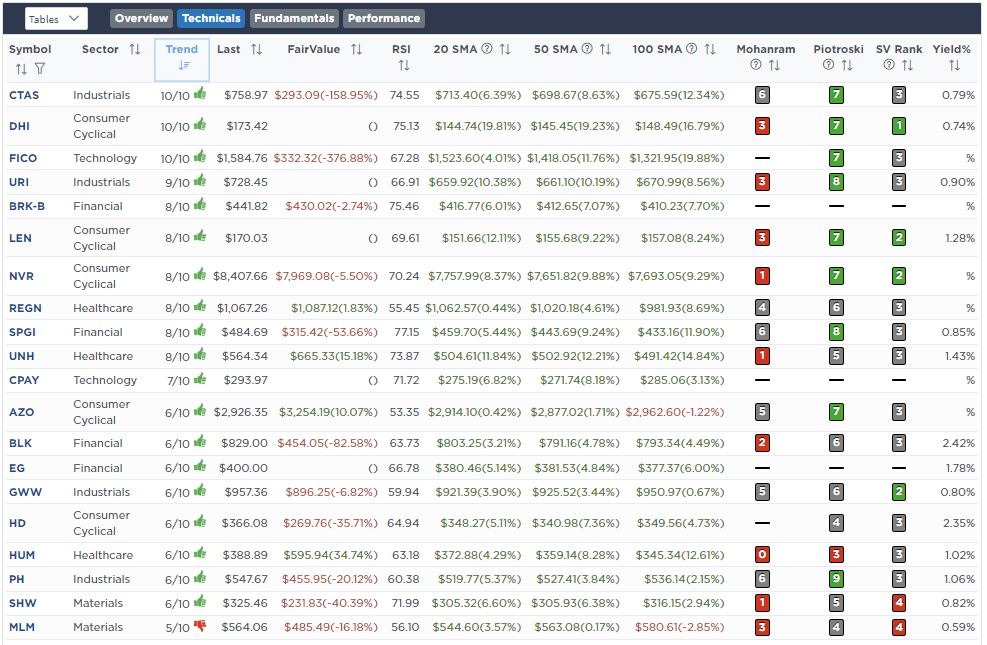
Fundamental & Technical Screen
SimpleVisor Portfolio Changes
We post all of our portfolio changes as they occur at SimpleVisor:
July 16th
Today, we are beginning to rebalance the portfolios a bit. This process will likely continue over the next couple of weeks as we begin risk mitigation processes for a potential pre-election correction.
In the equity model, we are rebalancing AMD (AMD) and NVIDIA (NVDA) back to target portfolio weights of 2.25% each.
In the ETF model, we are reducing the Semiconductor ETF (SMH) to 2% of the portfolio.
We will hold the excess cash in reserves until the market provides the next buy signal.
Equity Model
- Reduce AMD and NVDA to 2.25% each of the portfolio.
ETF Model
- Reduce SMH to 2% of the portfolio value.
July 18th
“We are continuing our process of derisking portfolios by rebalancing positions back to their target weights. This process reduces current position sizes and raises cash, which will help alleviate portfolio deterioration during a market correction.
In the Equity Model, we are reducing the weight of the following positions.
Amazon (AMZN), Ely Lilly (LLY), Google (GOOG), Apple (AAPL), Diamond Back Energy (FANG), Palo Alto Networks (PANW), Walmart (WMT), and United Technologies (RTX)
In the ETF Model, we are reducing the weight of the Technology sector ETF (XLK) and the Financial sector ETF (XLF).”
Equity Model
- Reduce to target portfolio weights – AMZN, LLY, GOOG, AAPL, FANG, PANW, WMT, and RTX.
ETF Model
- Reduce to target portfolio weights – XLF and XLK

Lance Roberts, C.I.O.
Have a great week!


