Equities Bounce Back Ending The April Correction


Inside This Week’s Bull Bear Report
- Equities Bounce Back
- How We Are Trading It
- Research Report –The Investment “Holy Grail” Doesn’t Exist
- Youtube – Before The Bell
- Market Statistics
- Stock Screens
- Portfolio Trades This Week
Equities Bounce Back Ending April Correction
Last week, we discussed whether the recent rally from the lows was just a sucker rally ahead of a more significant decline. Our assessment was that was likely not the case. To wit:
“The market surged higher on Thursday and Friday, supported by Apple’s massive $110 billion stock buyback program. With a MACD “buy signal” triggered on Friday and the market not overbought yet, a push above resistance at the 50-DMA seems likely next week. That break of resistance should allow the bulls an opportunity to retest 5200 over the next month or so.
However, while the bullish market setup is intact in the near term, we continue to expect another decline this summer before the election. Historically, institutional players are reticent about holding long exposures heading into an election, so we often see weakness in September and October.”
This past week, the market broke above the 50-DMA with a solid confirmation of the MACD “buy signal.” Currently, the market is decently overbought after the advance, so a pullback to retest the 50-DMA would be welcome. Such a pullback would turn the 50-DMA from previous resistance into support and reduce some overbought conditions.
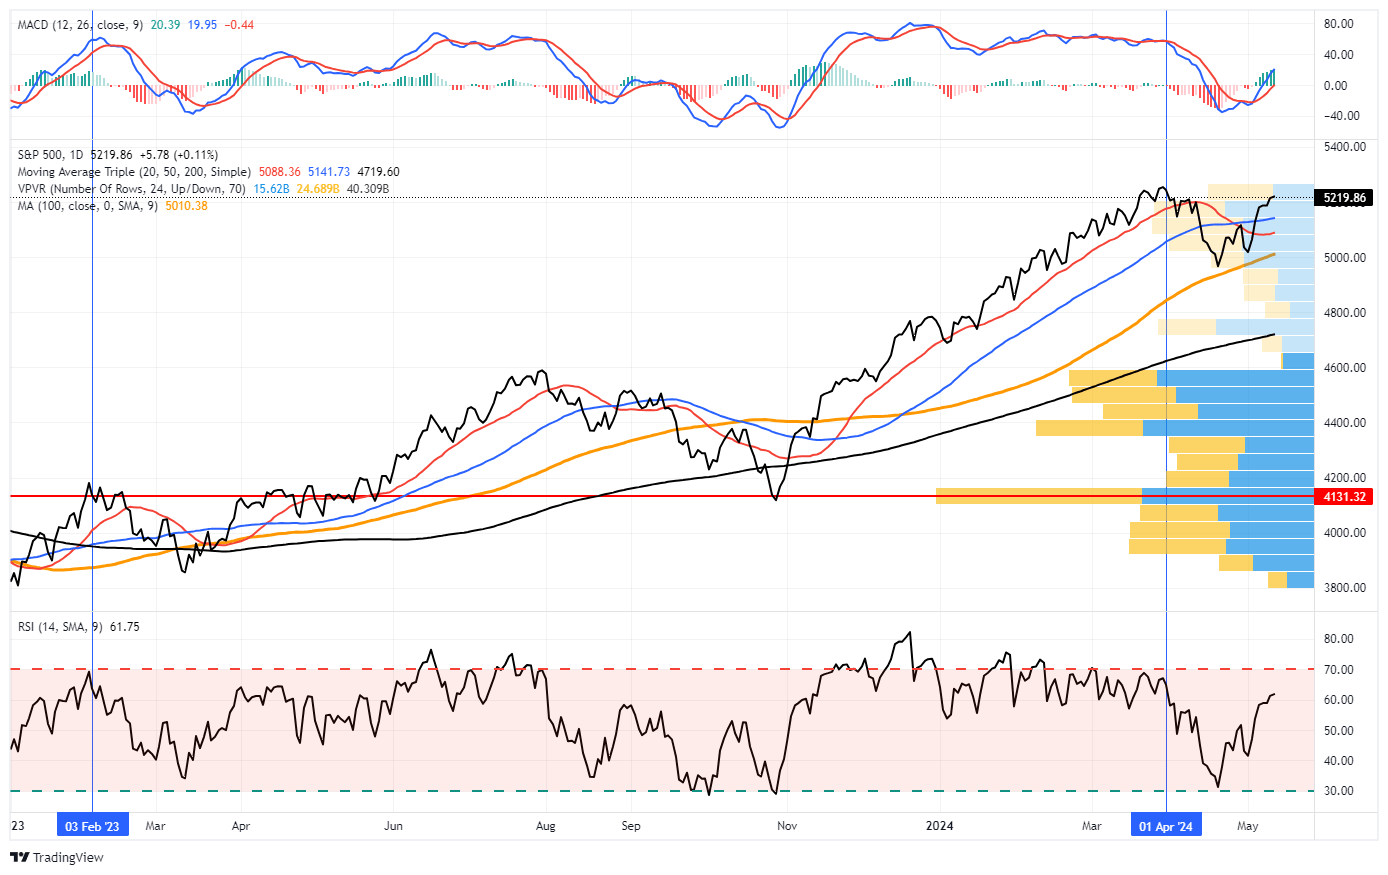
Notably, the breakout above key resistance and the reversal of the volatility index suggest that the recent correction is over. However, while the April correction may be over, as noted above, there is still a decent probability of another correction before the Presidential election in November. As shown below, such tends to be a statistical normality during Presidential election years.

Of course, that is just the “average,” meaning that Presidential election years have been better and worse. As such, we must continue monitoring and reacting to the market as the macro and micro environments evolve.
However, there are reasons to expect that the current bull market may have some room to run, at least over the next few months.
Need Help With Your Investing Strategy?
Are you looking for complete financial, insurance, and estate planning? Need a risk-managed portfolio management strategy to grow and protect your savings? Whatever your needs are, we are here to help.

Digging A Little Deeper
While the short-term technical setup suggests the recent correction is over, other factors could continue supporting further progress.
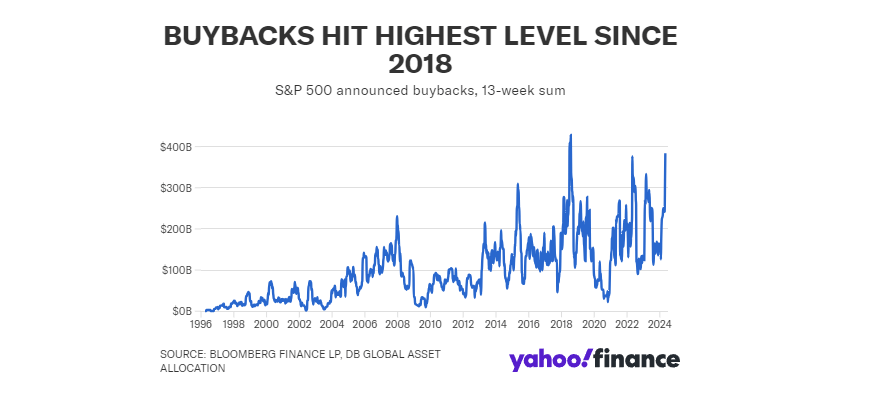
The first, as noted in “Powell Sparks A Buying Frenzy,” the window to resume corporate share repurchases (buybacks) has reopened. The window for buybacks will remain open until June 14th. As noted by Yahoo Finance:
“Companies have announced share repurchases of more than $383 billion in the last 13 weeks, up 30% from the year-earlier period and the largest sum since June 2018, per research from Deutsche Bank. The total includes Apple’s $110 billion plan, the largest buyback in history.”
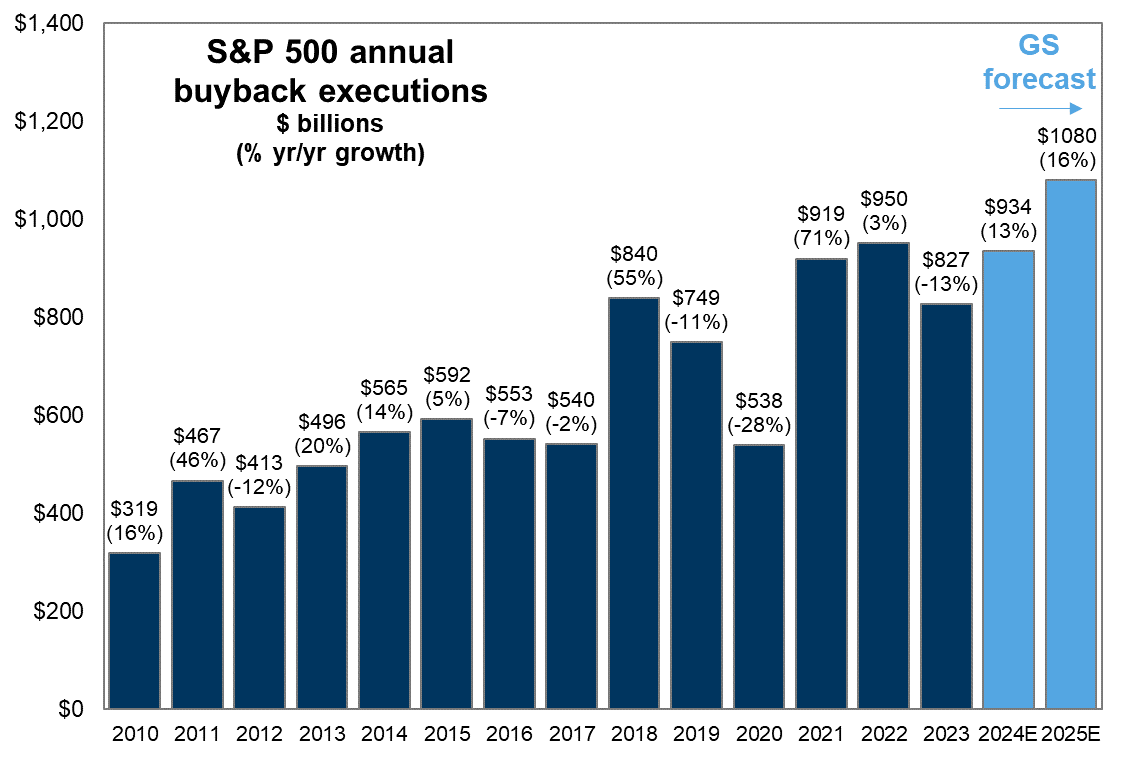
Goldman Sachs recently noted that an estimated $934 billion of buybacks is scheduled in 2024. This suggests that U.S. corporations will again be the largest purchasers of equities this year. Critically, 17.3% of annual executions will take place between May and June 14th, or an estimated $162 billion running at $5.5 billion per trading day.
But it isn’t just corporations buying equities over the next few months. During the 5.5% correction in April, sellers exhausted themselves. As noted previously, “buyers live lower:”
“However, at some point, for whatever reason, this dynamic will change. Buyers will become more scarce as they refuse to pay a higher price. When sellers realize the change, they will rush to sell to a diminishing pool of buyers. Eventually, sellers will begin to ‘panic sell’ as buyers evaporate and prices fall.”
Crucially, that selling pressure continues until those wanting to sell have eventually sold. For retail investors, that is usually near the market lows. As shown below, that happened over the last month as sellers exhausted themselves just in time for the market to reverse into rally mode.
We warned individuals not to become overly bearish during the correction.
“Continue to remain long equities and look for opportunities to add to positions opportunistically. When the MACD issues its next buy signal, it will coincide with an improvement in the overall market and provide a better entry point for investors.“
However, while we expect the current rally to continue in the near term, there are some notable risks to the bullish narrative heading into the last half of the year.
Equities (And Buybacks) Are Dependent On Growth
While buybacks and earnings will support higher asset prices over the next two months, things become less certain once we enter the year’s second half.
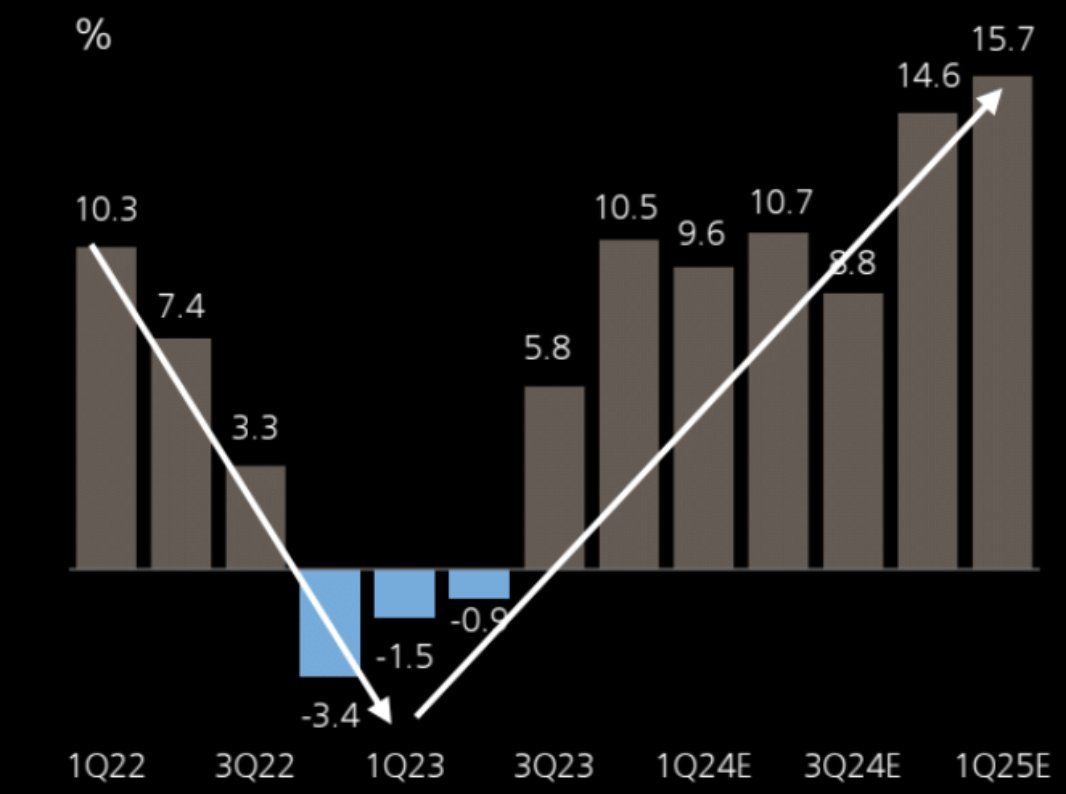
Currently, analysts are rapidly upgrading economic growth estimates.

Such is an important consideration given that earnings come from economic activity. As shown, there is a very high correlation between earnings and GDP growth over time. The outliers are associated with economic disruptions that created sharp declines in earnings during the recession, followed by sharp rebounds as economic activity resumed.

Unsurprisingly, given the correlation between economic growth and corporate earnings, a more optimistic view of economic expansion translates into stronger earnings expectations.
However, there is a reasonable expectation that economic growth may not achieve those more bullish forecasts. As we discussed previously, the economic surge we saw post-pandemic was a function of the massive inputs from monetary and fiscal policies. Economic growth resulted from the enormous increase in the M2 money supply.

We also see the same issue in the annual rate of change in M2 vs. nominal GDP. Over the next four quarters, economic growth will likely slow further as less monetary support weighs on activity.
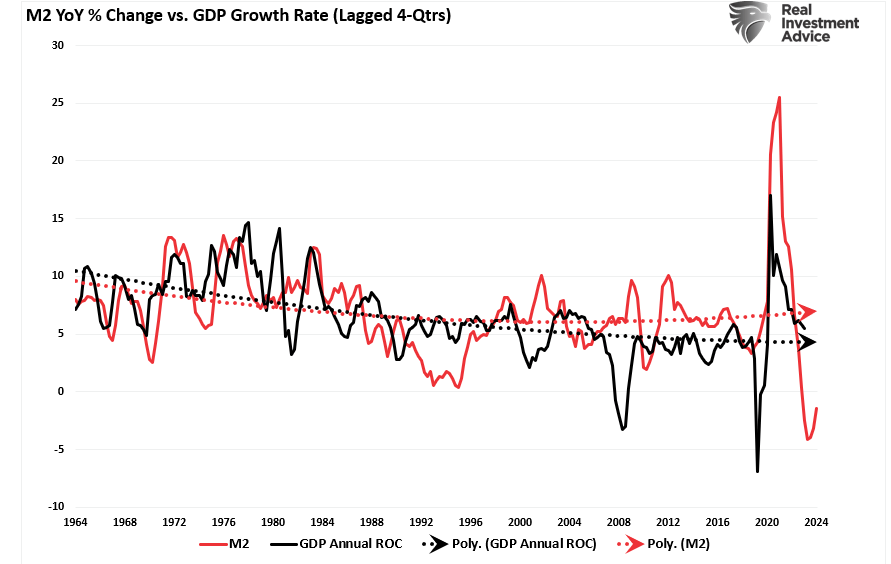
While the annual growth rate in GDP is declining and will likely continue to do so, the surge in economic growth from those massive monetary infusions supported the increase in earnings. As such, the annual increase in earnings supported higher prices for market equities from October 2022 to the present.
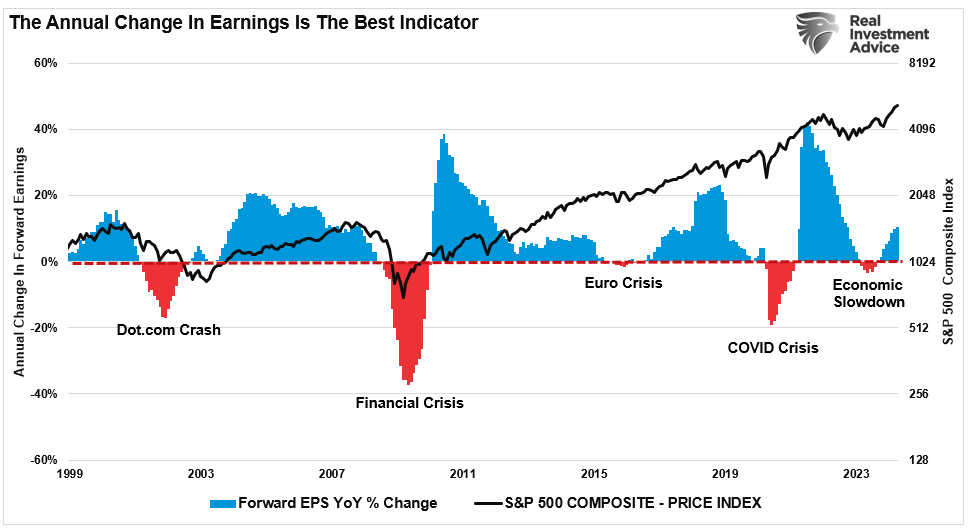
However, earnings growth will become more challenging if the economy slows down.
The Other Challenge To Equities And Earnings
There is an essential caveat to all the earnings data above. It is all based on the cumulative total of all equities in the S&P 500 index. However, there is a story beneath the surface that investors should pay close attention to – all earnings growth is not equal.
The S&P 500 index’s earnings growth centers on just six (6) companies. If you strip out the earnings of those six companies, earnings growth is negative. In other words, economic growth is likely weaker than headlines suggest.

However, outside of the near-term surge in earnings growth for those six companies, support for equities slows markedly over the last half of this year.

Such is an important consideration and returns us to the primary support for equities: buybacks.
Unsurprisingly, CEO confidence also improved as the economy improved from October 2022, coinciding with an improvement in earnings. As shown, buybacks improve with CEO confidence. Such is unsurprising because as economic growth increases, so do earnings. Companies can then use those increased earnings and subsequent cash flow to increase capital expenditures, issue dividends, or repurchase stock.
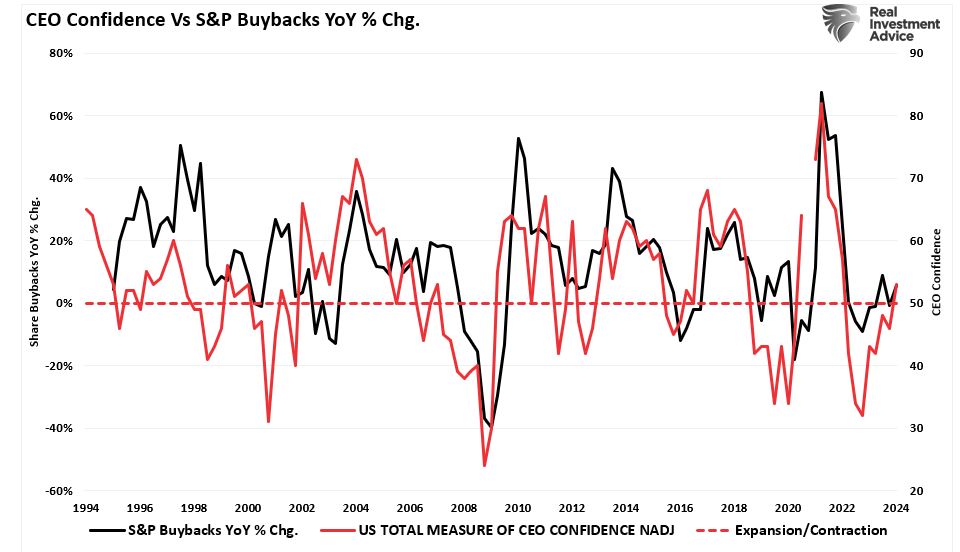
However, if the economy, and ultimately earnings growth, slows, CEO confidence could become more troubled again.
An interesting case was made that the recent data, which has been much stronger than expected, may encounter some headwinds.
A Key Reason Data May Disappoint
Over the last few quarters, economic growth, employment, and inflationary data have all surprised on the upside. As we discussed previously, much of that growth is a function of the federal government’s ongoing fiscal spending through various bills like the Inflation Reduction Act and the CHIPs Act.
One explanation for this has been the surge in Federal expenditures since the end of 2022 stemming from the Inflation Reduction and CHIPs Acts. The second reason is that GDP was so grossly elevated from the $5 Trillion in previous fiscal policies that the lag effect is taking longer than historical norms to resolve.”
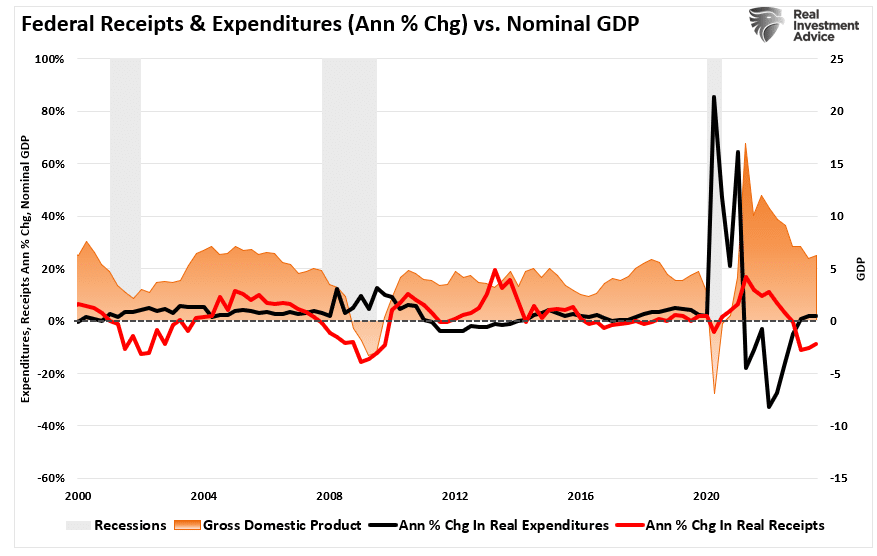
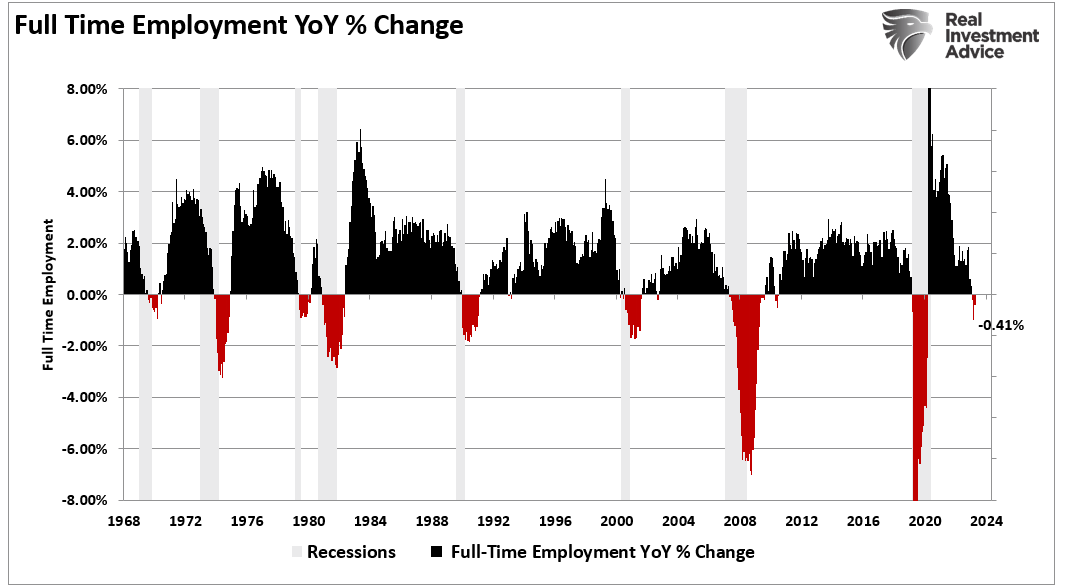
However, as noted above, much of that monetary excess has worked its way through the system, and lately, we see emerging signs of the U.S. economy slowing down. The first quarter’s real GDP report slowed to just 1.6% annualized growth, and April’s employment fell to just 175,000. Notably, full-time jobs, critical to supporting a family with sufficient income and benefits, have turned negative, which historically only occurs during recessionary periods.
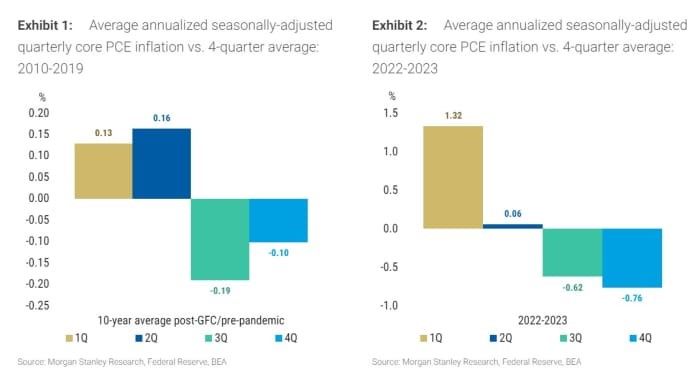
However, over the next few quarters, the seasonal adjustment in calculating official economic data will reverse from boosting economic reports to subtracting from them. Morgan Stanley noted that the “residual seasonality” factor will cause this impact.
“Residual seasonality isn’t a new thing, but what was a small observed factor from 2010 to 2019 has emerged as a giant one now. To quantify the impact, Morgan Stanley employs a technique comparing the average annualized numbers for a quarter to the four-quarter average. For the preceding two years, core PCE prices — the inflation numbers that mean the most to the Fed — have seen a giant 1.32 percentage point boost to first-quarter numbers that erode as the year progresses.
This residual seasonality has also been seen elsewhere, in the employment cost index series and unit labor cost data in the productivity numbers. When so many price metrics display residual seasonality and a similar strengthening pattern, investors would be forgiven for gaining confidence that the pattern will continue in the coming year.
Translated into hard numbers, Morgan Stanley expects the three-month annualized rate of core PCE inflation to fall to 1.81% for the Dec. 2024 data released in January 2025 and the six-month annualized to fall to 1.96%.” – MarketWatch
Unfortunately, if that is correct, the reversal of economic strength could weigh on earnings and buybacks, reducing equity growth rates.
However, the good news is that, as Morgan Stanley notes, “bond yields could fall dramatically as inflation data disappoint the higher-forever true believers.”
In other words, “buy bonds.”
How We Are Trading It
As we stated last week, the important lesson for investors is to pay less attention to “media headlines.” While “doom and gloom” will get “clicks and views,” it is not the best way to manage your portfolio.
The correction we discussed in March is likely complete and could provide another few months of tepid gains heading into the two months before the election. As we have discussed before, given the very contentious nature of this particular match-up this year, a bit of derisking in the markets ahead of voting day would be unsurprising. However, we will focus more on that later in the summer.
With earnings season behind us and buybacks returning in force, the only risk to the market currently is a surge in inflationary pressures and/or a reversal by the Federal Reserve to a more “hawkish” stance. Given the current economic data, neither of those events is likely to happen between now and the next FOMC meeting.
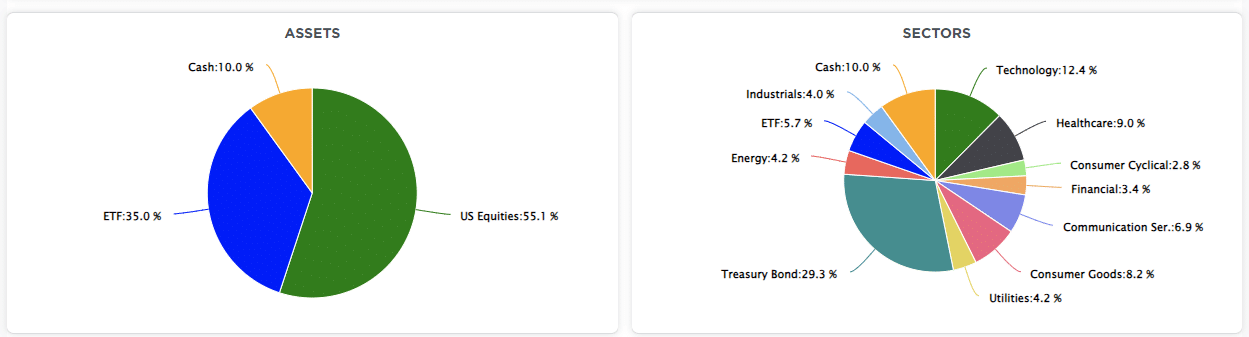
We have rebalanced our portfolios and used the recent correction to add to our Equity and Dividend Equity models. (You can track those portfolios in real-time by subscribing to the newly redesigned SimpleVisor platform.)
However, as is always the case, continue to manage risk accordingly.
Have a great week.
Research Report
Subscribe To “Before The Bell” For Daily Trading Updates
We have set up a separate channel JUST for our short daily market updates. Please subscribe to THIS CHANNEL to receive daily notifications before the market opens.
Click Here And Then Click The SUBSCRIBE Button
Subscribe To Our YouTube Channel To Get Notified Of All Our Videos
Bull Bear Report Market Statistics & Screens

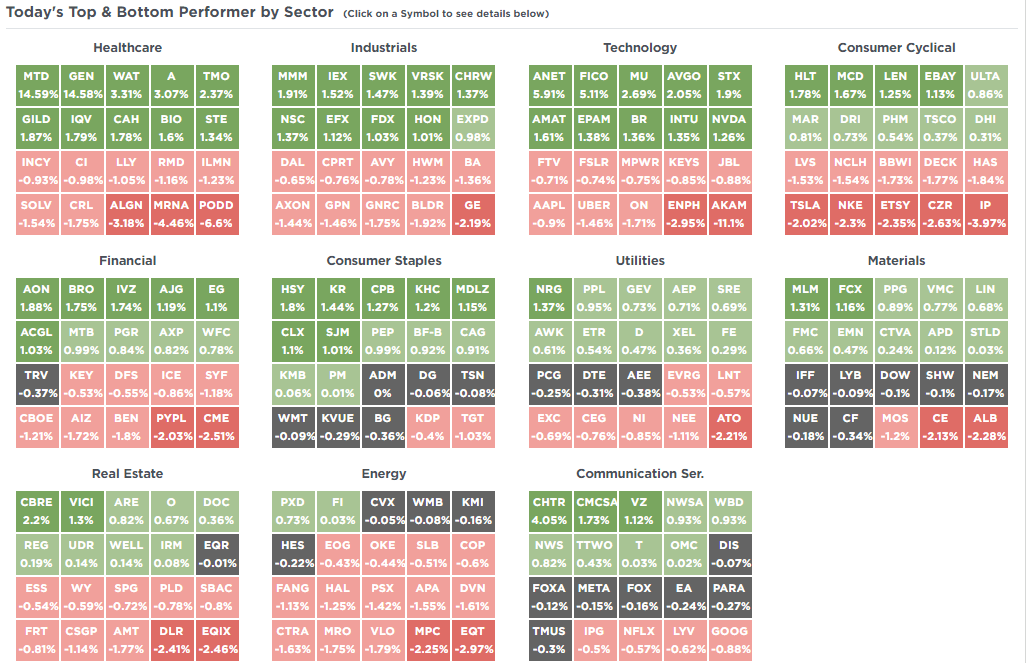
SimpleVisor Top & Bottom Performers By Sector
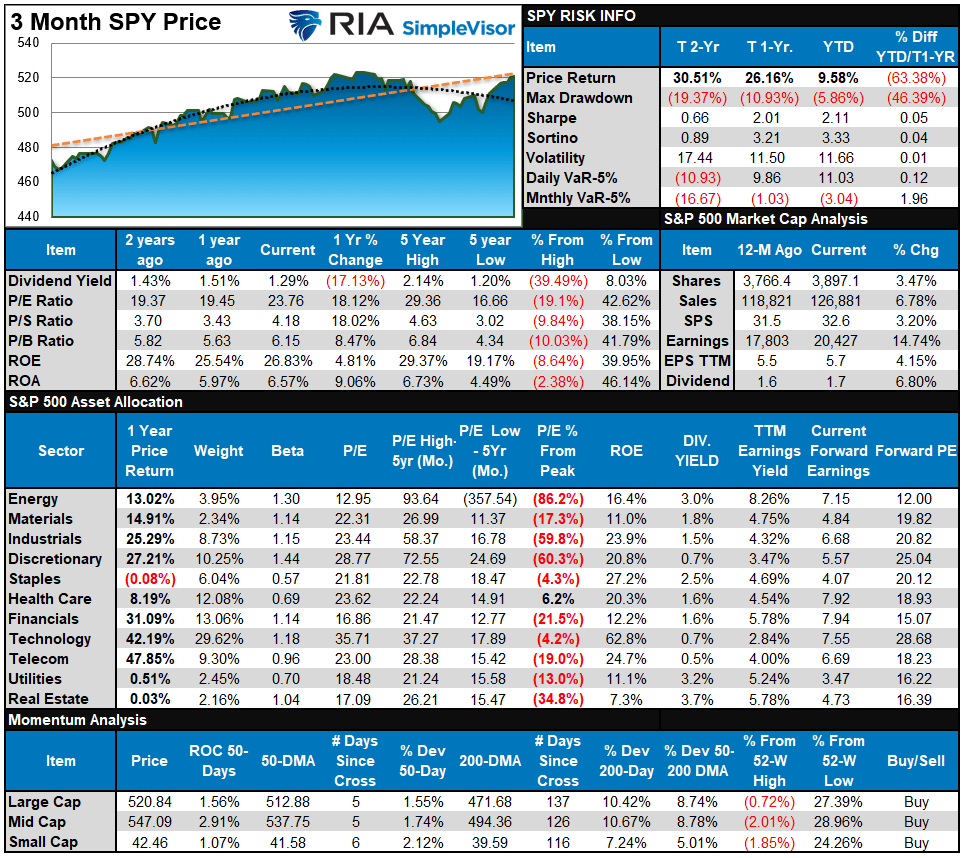
S&P 500 Weekly Tear Sheet
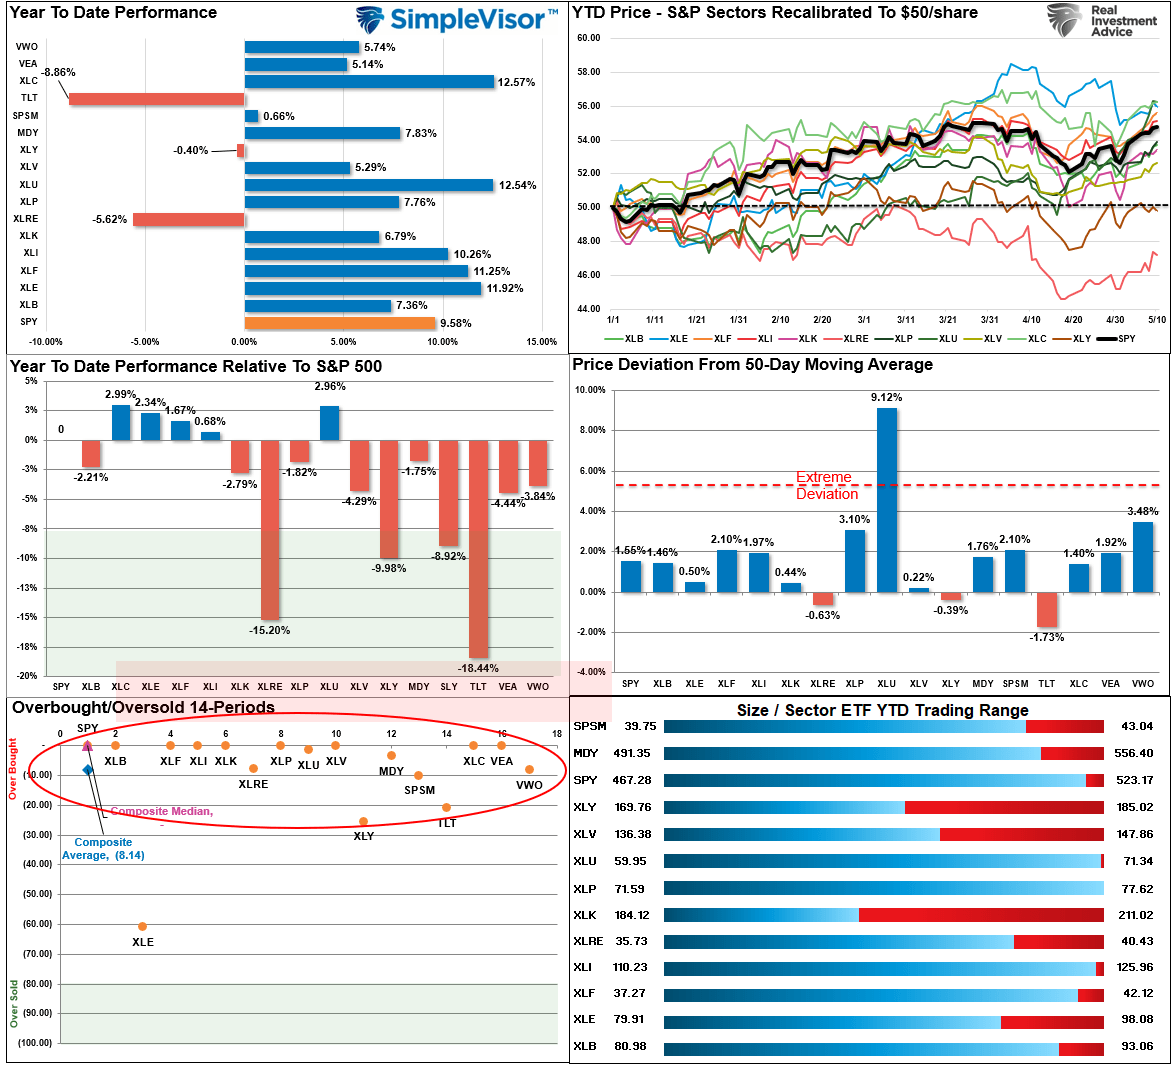
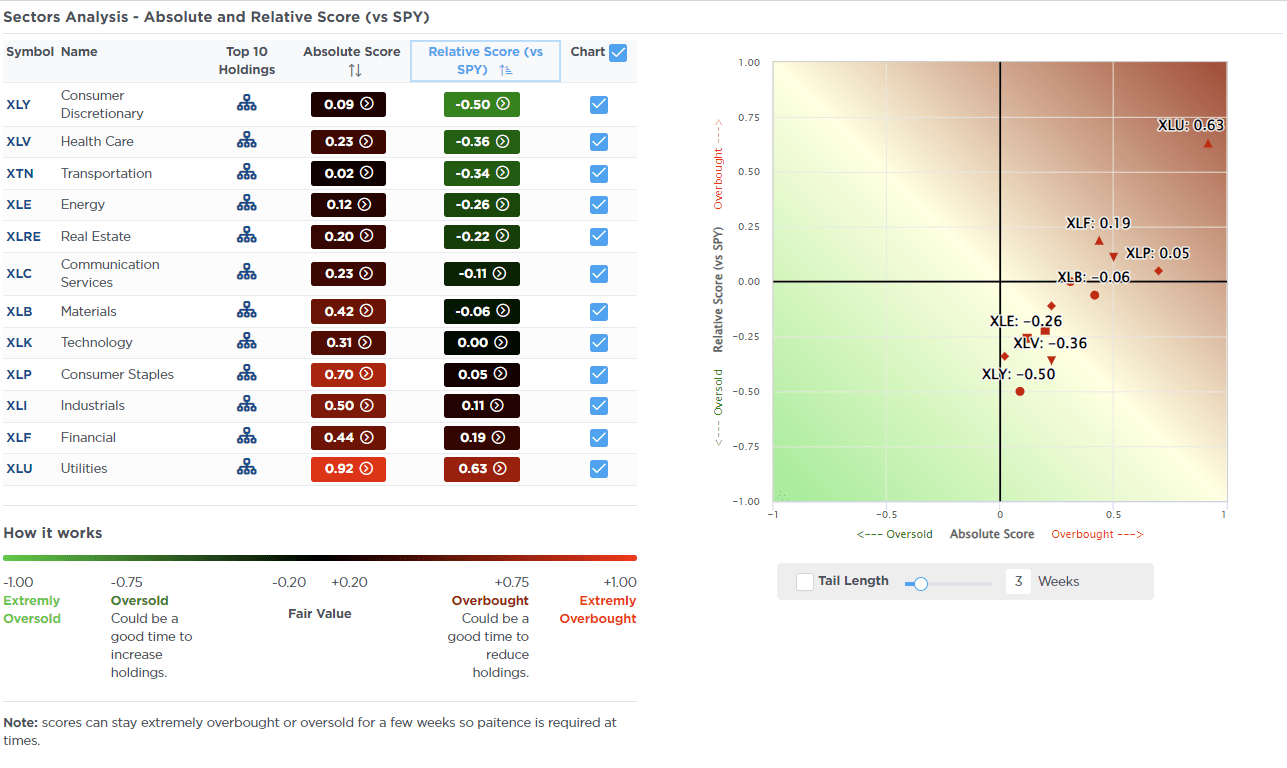
Relative Performance Analysis
Last week, we suggested that with most sectors’ short-term overbought conditions, we could see some selling pressure next week as traders profit from the recent rally. While the market managed to eak out a gain last week, there were several bouts of selling along the way. As shown, with most sectors and markets extremely short-term overbought, expect a short-term pullback next week, particularly if economic data weighs on rate cut expectations.
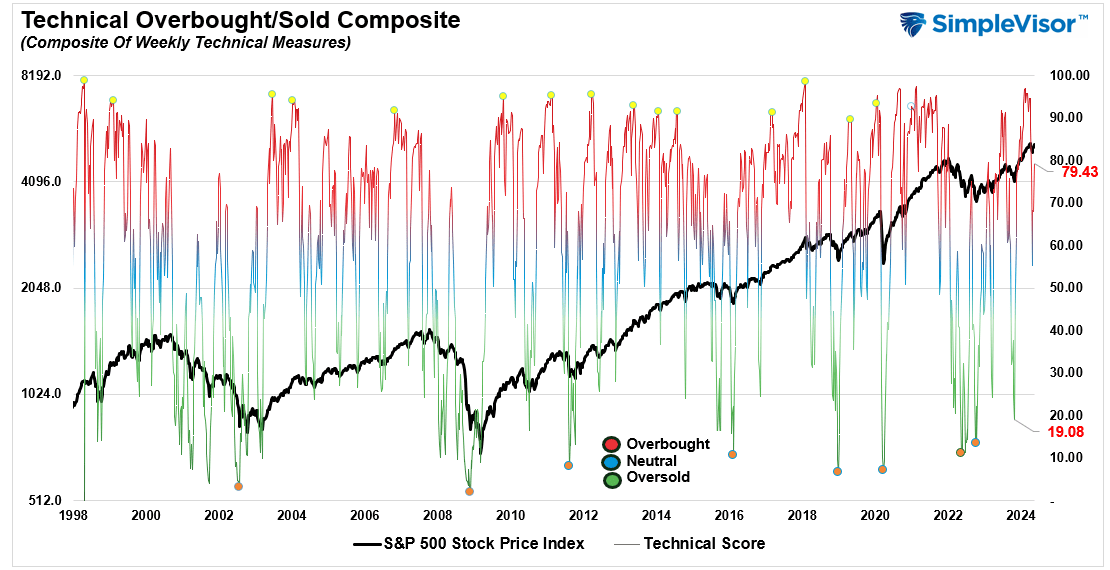
Technical Composite
The technical overbought/sold gauge comprises several price indicators (R.S.I., Williams %R, etc.), measured using “weekly” closing price data. Readings above “80” are considered overbought, and below “20” are oversold. The market peaks when those readings are 80 or above, suggesting prudent profit-taking and risk management. The best buying opportunities exist when those readings are 20 or below.
The current reading is 79.43 out of a possible 100.
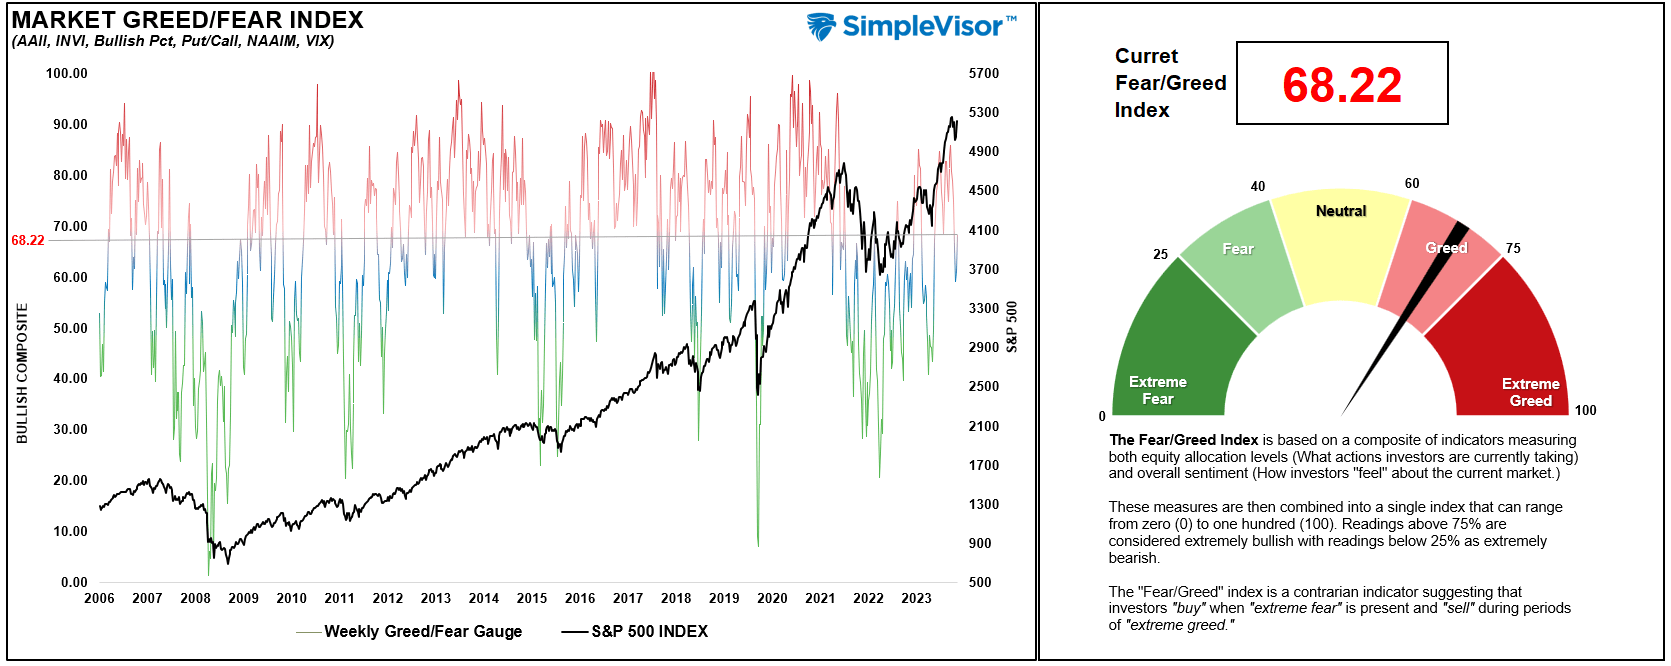
Portfolio Positioning “Fear / Greed” Gauge
The “Fear/Greed” gauge is how individual and professional investors are “positioning” themselves in the market based on their equity exposure. From a contrarian position, the higher the allocation to equities, the more likely the market is closer to a correction than not. The gauge uses weekly closing data.
NOTE: The Fear/Greed Index measures risk from 0 to 100. It is a rarity that it reaches levels above 90. The current reading is 68.22 out of a possible 100.
Relative Sector Analysis
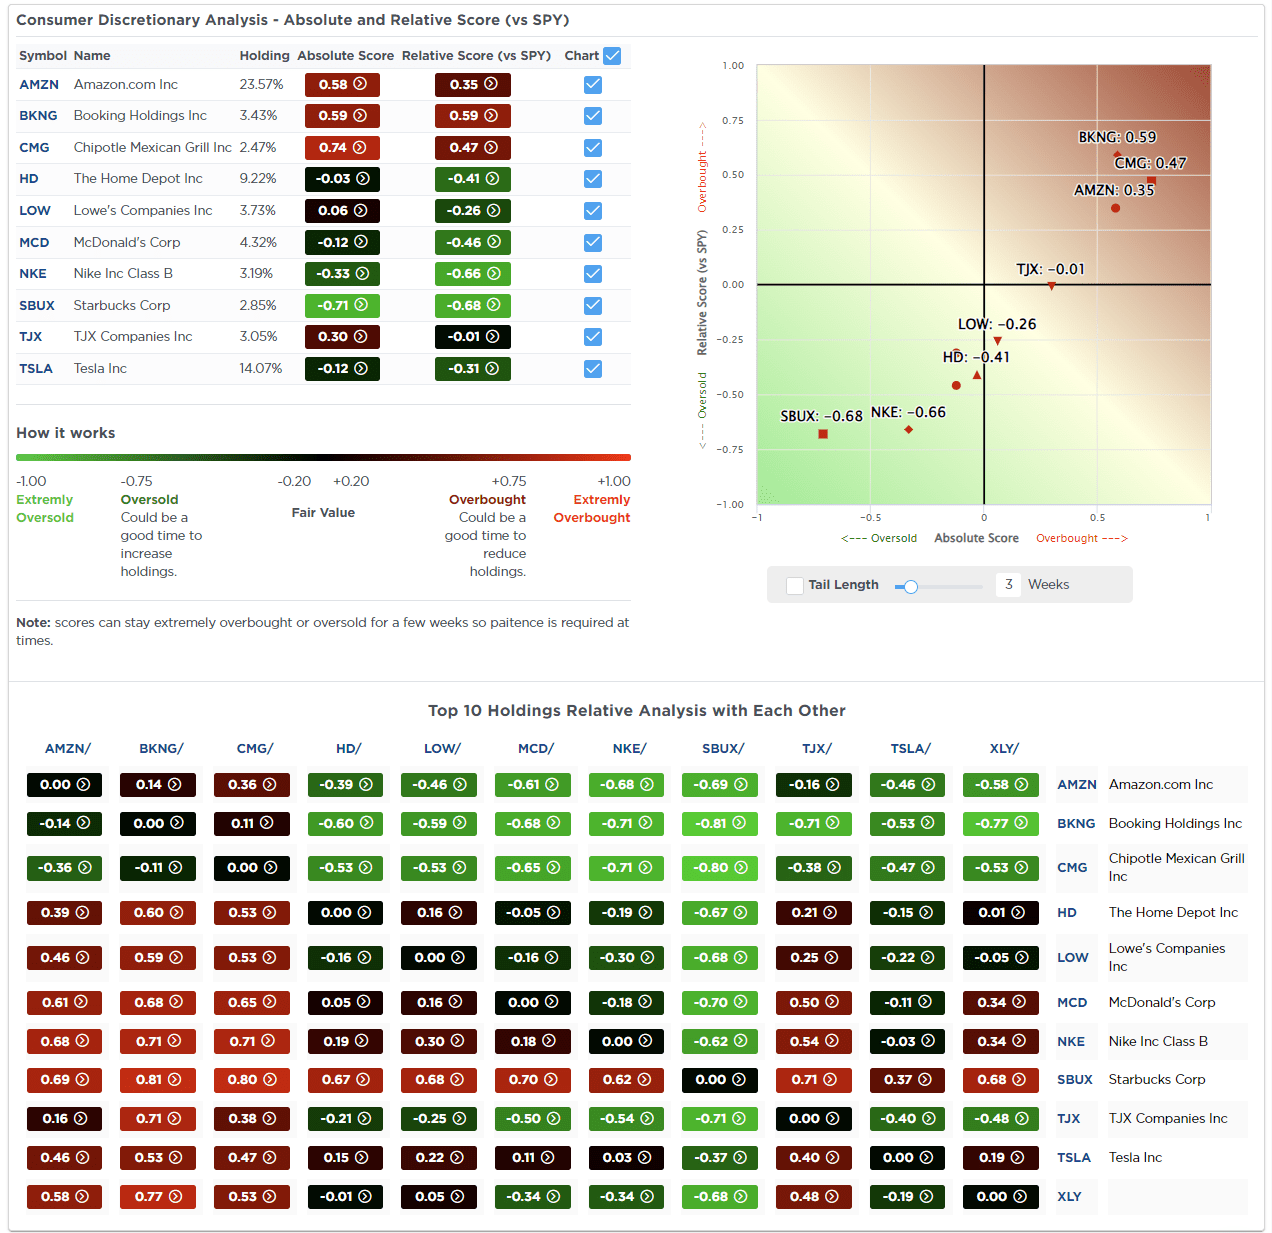
Most Oversold Sector Analysis
Sector Model Analysis & Risk Ranges
How To Read This Table
- The table compares the relative performance of each sector and market to the S&P 500 index.
- “MA XVER” (Moving Average Crossover) is determined by the short-term weekly moving average crossing positively or negatively with the long-term weekly moving average.
- The risk range is a function of the month-end closing price and the “beta” of the sector or market. (Ranges reset on the 1st of each month)
- The table shows the price deviation above and below the weekly moving averages.
As noted last week:
“That bounce came and there is potentially further upside in the near term, with many sectors reversing some of their previous double-digit deviations from long-term weekly means.”
Last week’s market rally pushed many sectors and markets well above their monthly trading ranges. In the short term, expect a correction to relieve some overbought conditions. However, in the far right column, you will note that every major market and sector has reversed to a longer-term bullish MACD crossover except for the dollar. Given this is weekly data, these bullish signals tend to last for quite some time. Therefore, for now, the risk of a resurgence of a bear market is very low.

Weekly SimpleVisor Stock Screens
We provide three stock screens each week from SimpleVisor.
This week, we are searching for the Top 20:
- Relative Strength Stocks
- Momentum Stocks
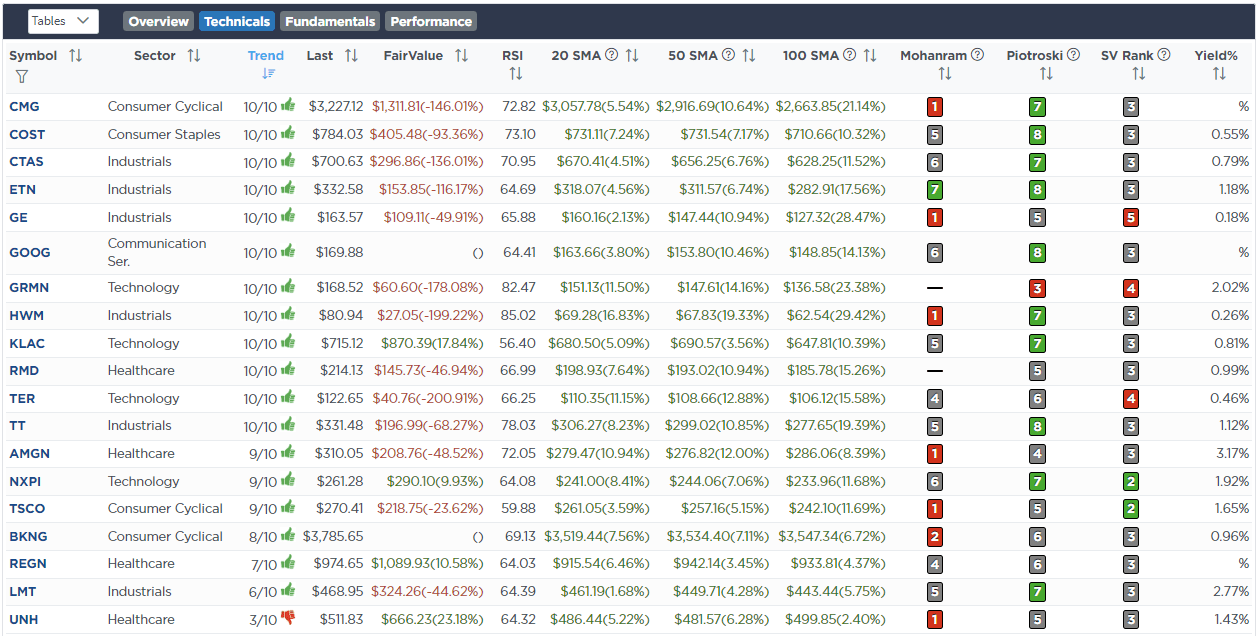
- Fundamental & Technical Strength W/ Dividends
(Click Images To Enlarge)
RSI Screen

Momentum Screen

Fundamental & Technical Screen
SimpleVisor Portfolio Changes
We post all of our portfolio changes as they occur at SimpleVisor:
May 10th
“Over the last couple of weeks, we have been slowly migrating a portion of the portfolio to benefit from the coming need for energy infrastructure to support the electricity demand required by the U.S. for artificial intelligence, electric cars, and increased computer usage. That demand increase, on top of the already massive base of power consumption used daily, will require increased power production.
As such, we are taking some profits from Exxon Mobil (XOM) and Duke Energy (DUK), which are currently overbought and extended. Fundamentally, these are great companies, and we will add back to them when we have a price correction. We are diversifying our energy production and utilities sector by adding small starter positions in National Fuel Gas (NFG) and GE Vernova (GEV). Both of these companies are overbought short-term, so we are expecting a price correction that we can increase our position weighting in.
We certainly expect some increased volatility from these holdings, which we are keeping small in the portfolio for now. However, over the long term, the power generation needed to support Artificial Intelligence should be a major tailwind for these companies.”
Equity Model
- Sell 1% of the portfolio of Exxon Mobil (XOM
- Reduce Duke Energy (DUK) by 1% of the portfolio
- Initiate a 1% position in National Fuel Gas (NFG)
- Add a 1% position in GE Vernova (GEV)

Lance Roberts, C.I.O.
Have a great week!


