The Confidence Dichotomy


Inside This Week’s Bull Bear Report
- The Confidence Dichotomy
- How We Are Trading It
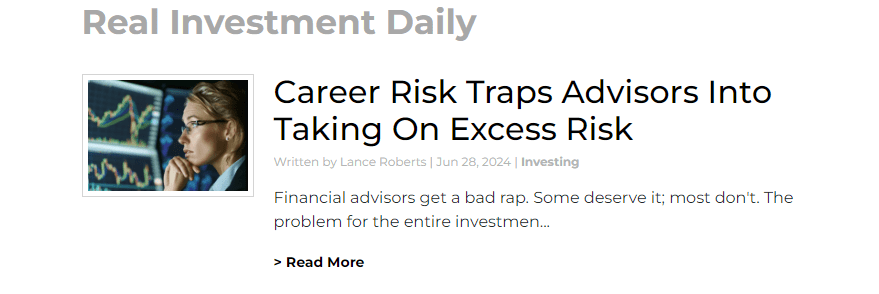
- Research Report – Career Risk Traps Advisors Into Taking Excess Risk
- Youtube – Before The Bell
- Market Statistics
- Stock Screens
- Portfolio Trades This Week
Market Ends Q2 On A Good Note
Last week, we did an in-depth discussion of the worsening breadth of the market. However, the critical point was that investors make two mistakes regarding such data. To wit:
“The first is overreacting to these technical signals, thinking a more severe correction is coming. The second is taking action too soon.
Yes, these signals often precede corrections, but there are also periods of consolidation when the market trades sideways. Secondly, reversals of overbought conditions tend to be shallow in a momentum-driven bullish market. These corrections often find support at the 20 and 50-day moving averages (DMA), but the 100 and 200-DMAs are not outside regular corrective periods.
If you remember, in March, we discussed the potential for a 5% to 10% correction due to many of the same concerns noted above. That correction of 5.5% came in April. We are again at a juncture where a 5-10% correction is likely. The only issue is that it could come anytime between now and October. As is always the case, timing is always the most significant risk.”
As shown, the market’s monthly seasonality supports that view of a potential correction later this summer. July tends to be a decent performance month, with an average return of more than 2%.
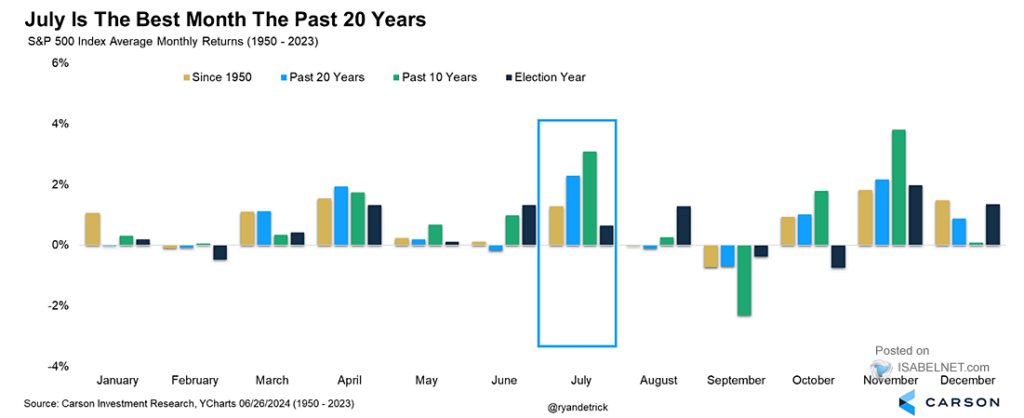
That boost in performance in July is supported by the kick-off of the Q2 earnings season. Such is particularly the case as investor sentiment is extremely bullish, which will continue to put a bid under stocks in the short term.
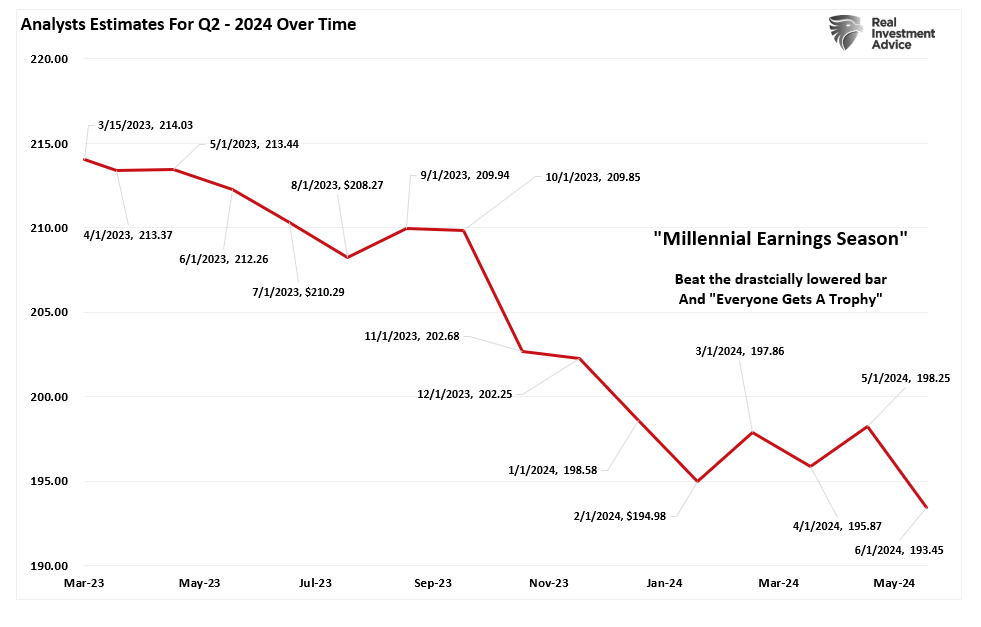
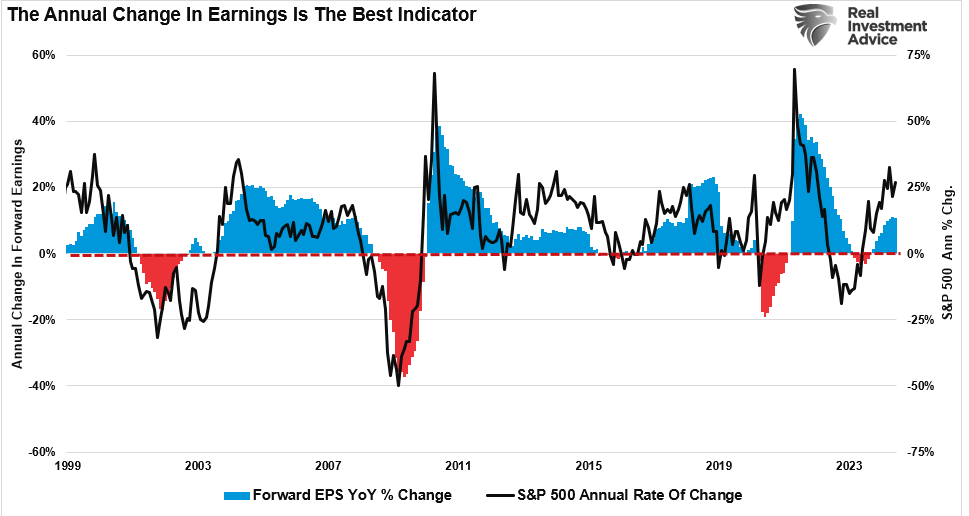
Speaking of earnings, analysts have been extremely busy over the last 30 days, slashing estimates. In June, Q2 earnings estimates for the S&P 500 index were cut by $5/share to the lowest level yet. Interestingly, while Wall Street continues to boast confidence in rising asset prices, they have cut estimates from $214/share in March last year to just $193/share. Such suggests a dichotomy between expected market performance and the economy, which is where earnings come from.
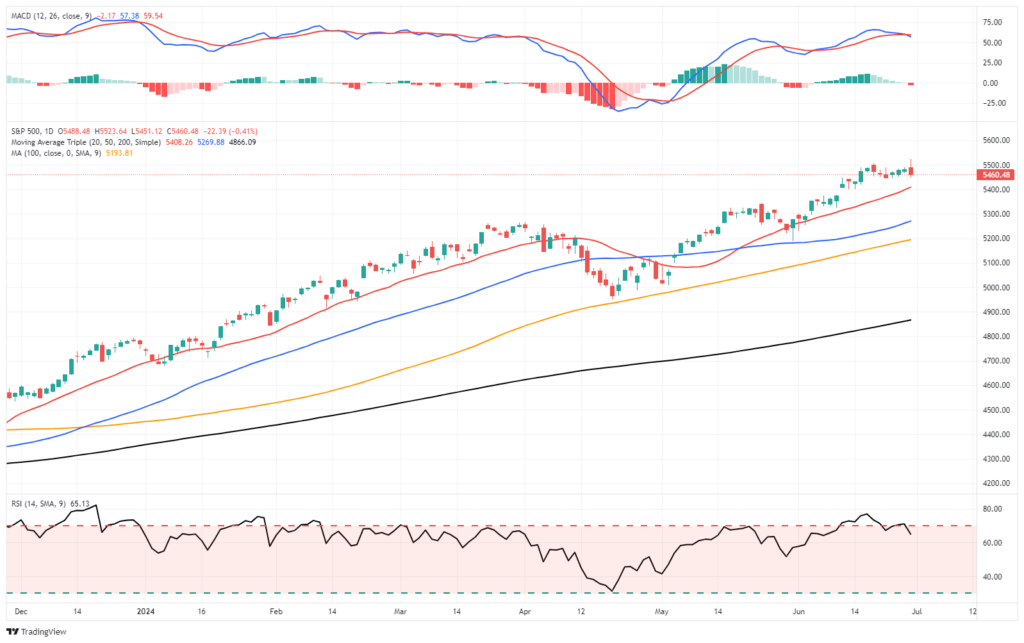
Nonetheless, the market remains overbought short-term and has triggered a short-term MACD “sell signal,” which could limit the upside in the near term. Continue to manage portfolio risk accordingly, but the bullish trend remains intact.
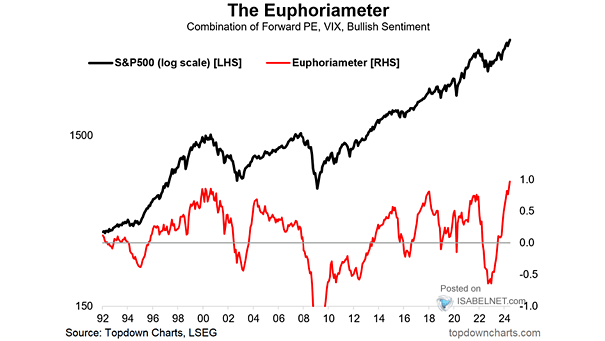
As noted, consumers are incredibly optimistic about higher asset prices in the future, but there is a growing dichotomy between the market and their views on the economy.
Need Help With Your Investing Strategy?
Are you looking for complete financial, insurance, and estate planning? Need a risk-managed portfolio management strategy to grow and protect your savings? Whatever your needs are, we are here to help.

Deteriorating Confidence In The Economy
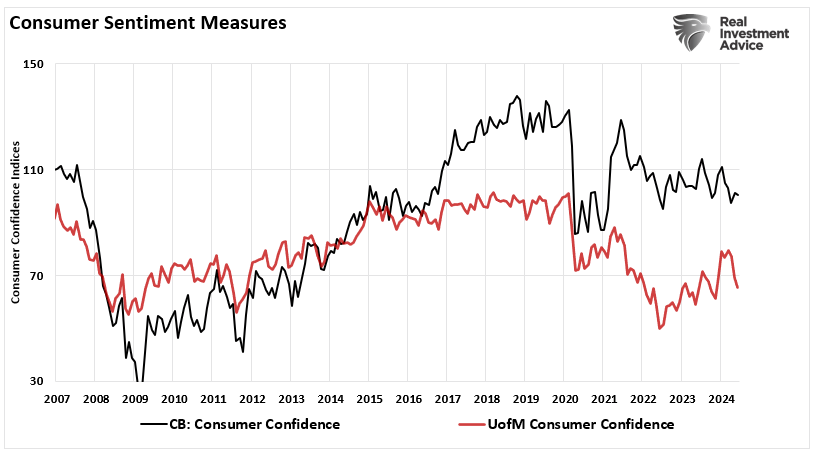
The last consumer confidence survey from the Conference Board continues to confirm much of what we already knew: the consumer is under pressure. The latest survey was lower than last month’s, and the prior month’s data was revised lower than previously thought. These downward revisions of previous data have been occurring since December. As shown, the Conference Board measure has declined since 2021, but the University of Michigan measures have declined since the Pandemic shutdown.
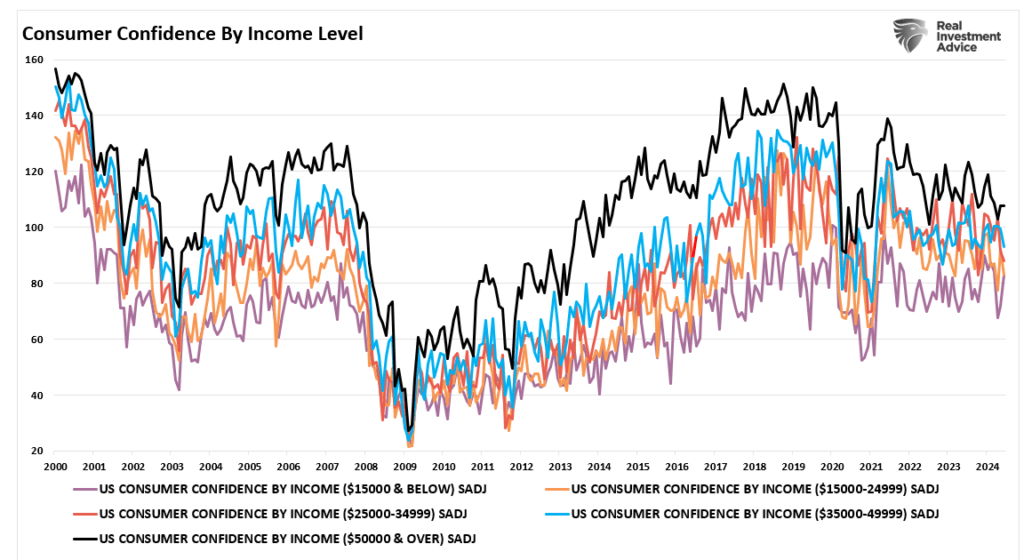
Unsurprisingly, that deterioration in confidence is across all income strata measured by the Conference Board.
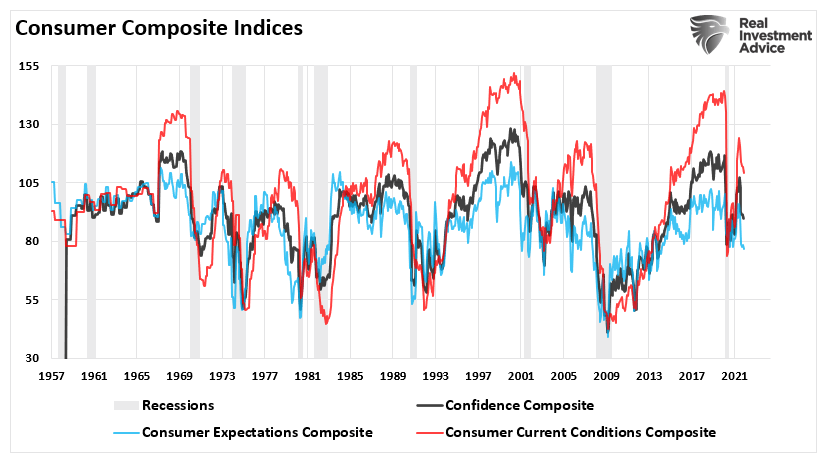
The chart below shows our Consumer Confidence Composite index, an average of the University of Michigan and Conference Board measures. Rather than just using one survey to measure consumer confidence, the composite index gives us a broader picture of consumer health. As shown, there is a decent correlation between confidence and the markets. Such should be unsurprising, as consumption is roughly 70% of the economy, providing corporate revenue and earnings. Notably, the recent market rally has detached meaningfully from the economy’s primary driver—the consumer.

The recent decline in confidence is apparent across all the measures: current conditions, expected conditions, and present situation. Notable, such sharp downturns, as currently seen in the composite index, usually have preceded deeper economic slowdowns and recessions.
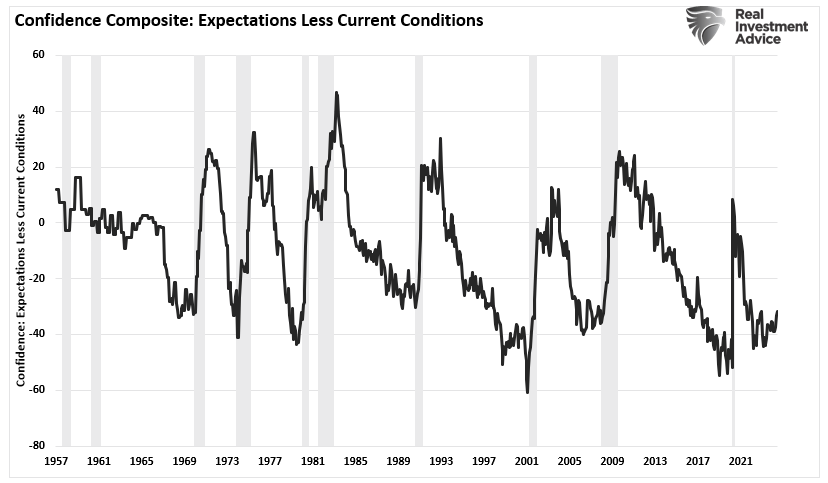
One of the recessionary indicators we track, along with the 6-month change in the Leading Economic Index, inverted yield curves, and our economic composite, is the spread between current and expected conditions in the confidence index. That measure, as shown, has turned up from its recent lows, which has historically indicated the onset of slower economic growth and recessions.
Confidence Leads The Economy
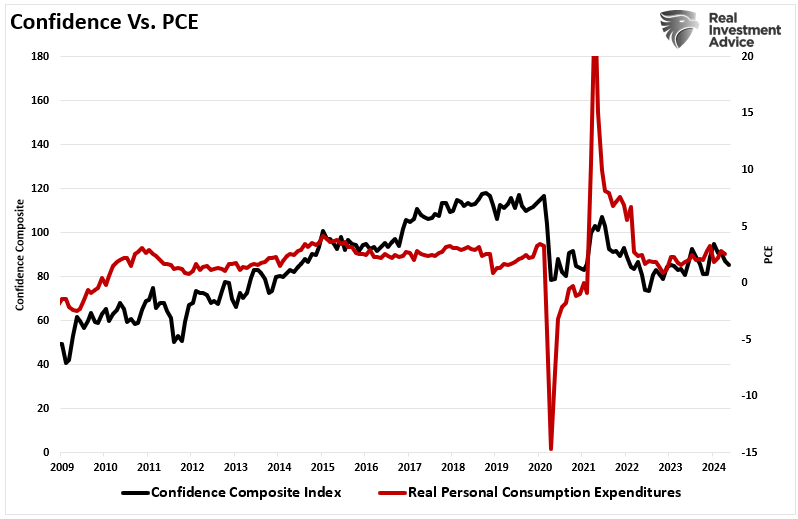
It should be logical that if the consumer comprises roughly 70% of the economic growth equation, the strength or weakness of that confidence should lead to changes to the overall economy. There is a natural correlation between the changes in consumer confidence and personal consumption expenditures.
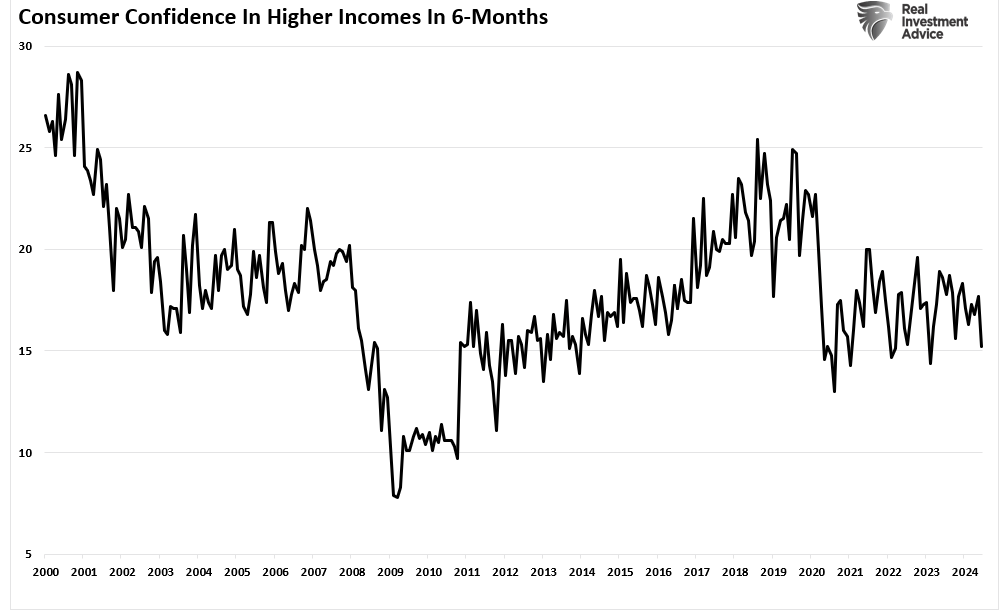
Currently, consumer confidence in the things that directly impact their spending ability is under pressure. As shown, their confidence in employment not being so plentiful has risen sharply.

Of course, if they are concerned about being unable to find work or keeping their current employment, their confidence in higher future incomes declines.
Unsurprisingly, when consumers lack confidence about employment and future incomes, this affects their current and future spending plans. As such, declines in consumer confidence lead to declines in Personal Consumption Expenditures (PCE), which comprise nearly 70% of the economic growth calculation.
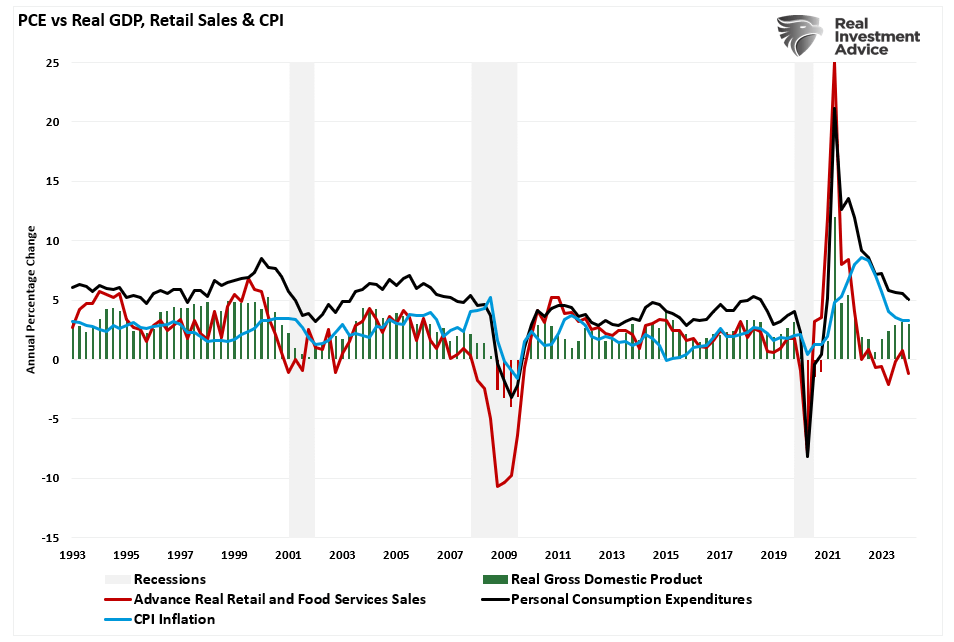
As I discussed in “Consumer Data Suggests Weakening Economy,” the strength of the consumer is all-important to economic growth.
“As shown, retail sales tend to lead PCE. The recent uptick in economic growth during the last two quarters of 2023 coincided with an uptick in retail sales activity. However, that has since reversed, suggesting we will likely see slowing economic growth and lower inflation readings by the end of this year.”
Such is critical to the outlook for the markets.
“Given the current state of consumer data and the potential for slower economic growth in the months ahead, current Wall Street [earnings] expectations seem overly optimistic. Furthermore, given the correlation between earnings and economic growth, a more cautious outlook would seem in order.”
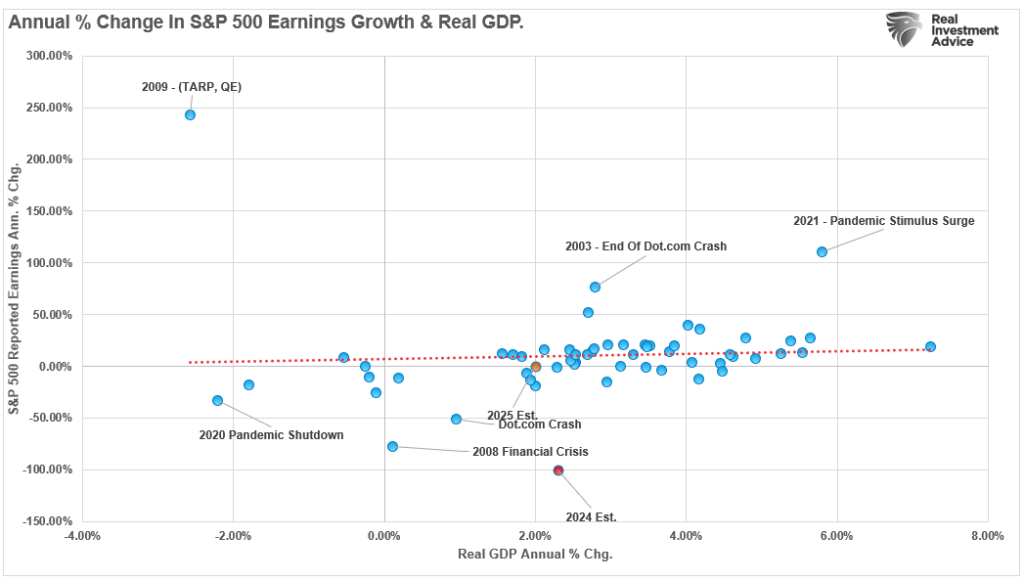
In other words, analysts expect roughly a 20% increase in earnings into 2025, requiring strong consumer economic activity to generate the needed revenue. However, confidence measures suggest that economic growth may disappoint, substantially dragging on market returns given the correlation to earnings growth.
Therein lies the confidence dichotomy.
The Confidence Dichotomy
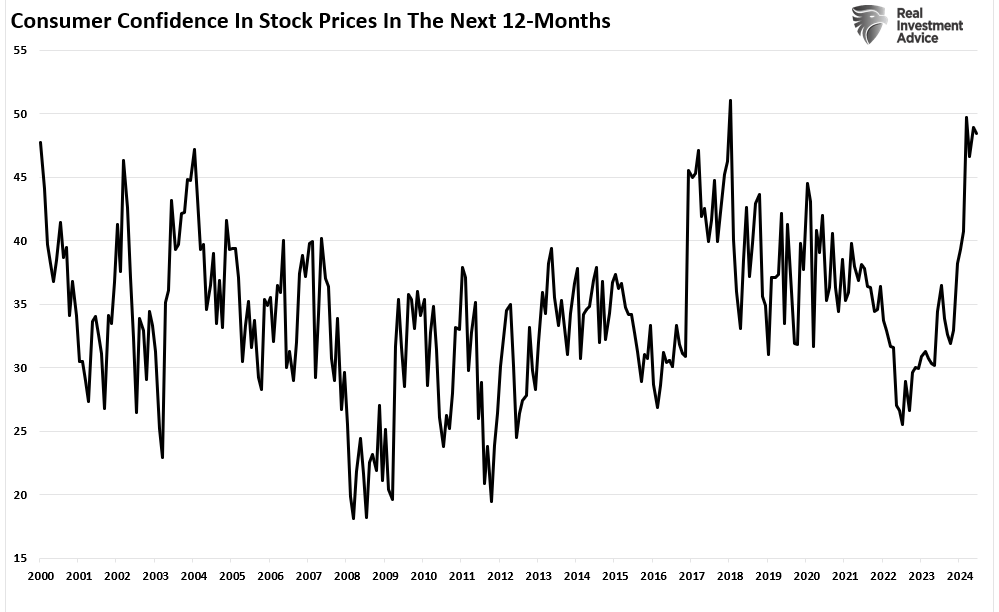
While consumers are not very confident about the economy, they are highly optimistic about the stock market. In that same consumer confidence report from the Conference Board, the expectations for rising stock prices over the next 12 months are near the highest on record.
Such is unsurprising and noted in the recent New York Federal Reserve consumer data release. To wit:
The New York Fed’s latest consumer survey found that expectations that stocks will be higher in the next 12 months rose from 39% to 41% since last month’s reading. At the same time, inflation expectations dropped slightly. Consumer sentiment numbers have recently highlighted how certain demographics are thriving while others aren’t, but with the market near all-time highs, it’s no surprise that those who own stocks are feeling good.” – Yahoo Finance
The chart below shows the annual change in consumer surveys of higher stock prices.
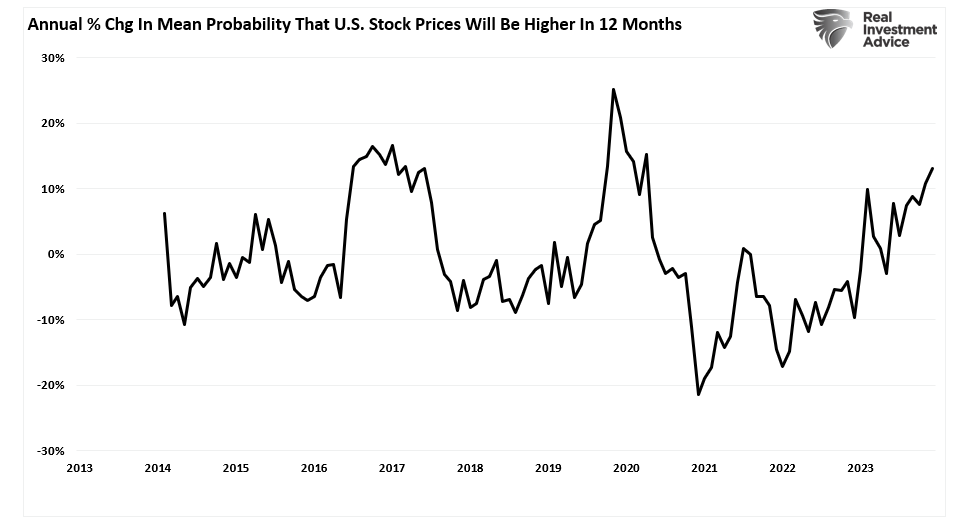
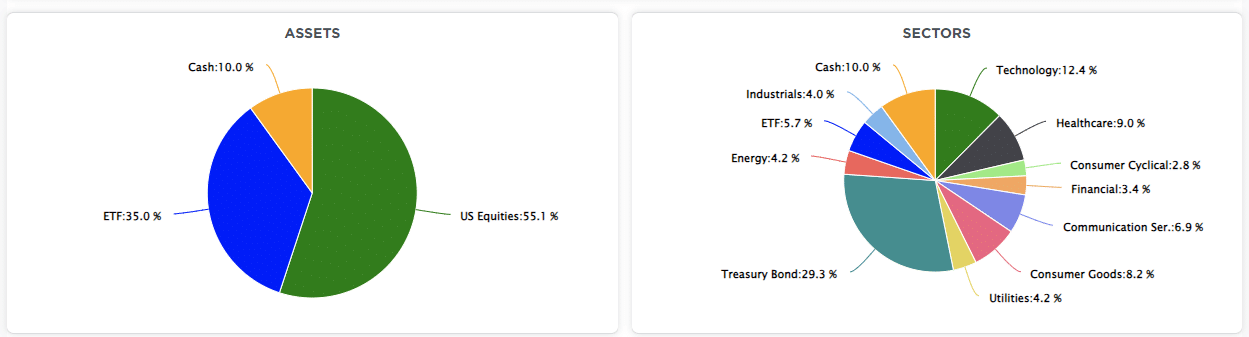
Consumers are exceedingly exuberant about higher stock prices despite the erosion of the underlying economic data. That stock market confidence is reflected in the record level of household equity allocations. Notably, those peaks in household equity allocations have often correlated to more critical peaks in the financial markets.
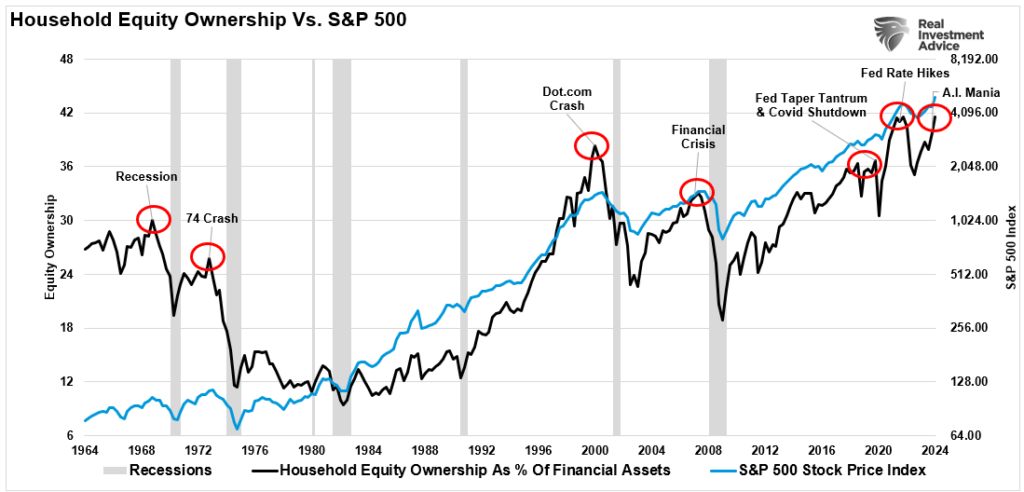
Bob Farrell once quipped that investors tend to buy the most at the top and the least at the bottom. Given the current economic and fundamental dynamics, it seems likely that the dichotomy between economic confidence and market confidence cannot exist indefinitely.
I have no clue how or when that gap between the economy and market exuberance closes. However, if history serves as any guide, it tends to happen when investors are confident that “stocks can only go up.”
We have certainly seen how this movie has ended previously.
How We Are Trading It
From a portfolio management perspective, we have to trade the market we have rather than the one we think should be. Such can make battling emotions difficult from week to week. However, as noted, we expect a correction this summer to provide a better risk/reward opportunity to increase equity exposure.
For now, the bullish trend continues but is overbought. While we increased our equity exposure in April, we remain underweight overall. We will likely reduce the equity exposure as we head into earnings season. However, as discussed above, we want to be confident that we are not acting too early or too much.
As is always the case, good portfolio risk management is about making small moves today that can have an outsized impact tomorrow.
- Tighten up stop-loss levels to current support levels for each position.
- Hedge portfolios against significant market declines.
- Take profits in positions that have been big winners
- Sell laggards and losers
- Raise cash and rebalance portfolios to target weightings.
Notice, nothing in there says, “Sell everything and go to cash.”
Just manage risk as needed to mitigate the impact of a sudden reversal.
Have a great week.
Research Report
Subscribe To “Before The Bell” For Daily Trading Updates
We have set up a separate channel JUST for our short daily market updates. Please subscribe to THIS CHANNEL to receive daily notifications before the market opens.
Click Here And Then Click The SUBSCRIBE Button
Subscribe To Our YouTube Channel To Get Notified Of All Our Videos
Bull Bear Report Market Statistics & Screens

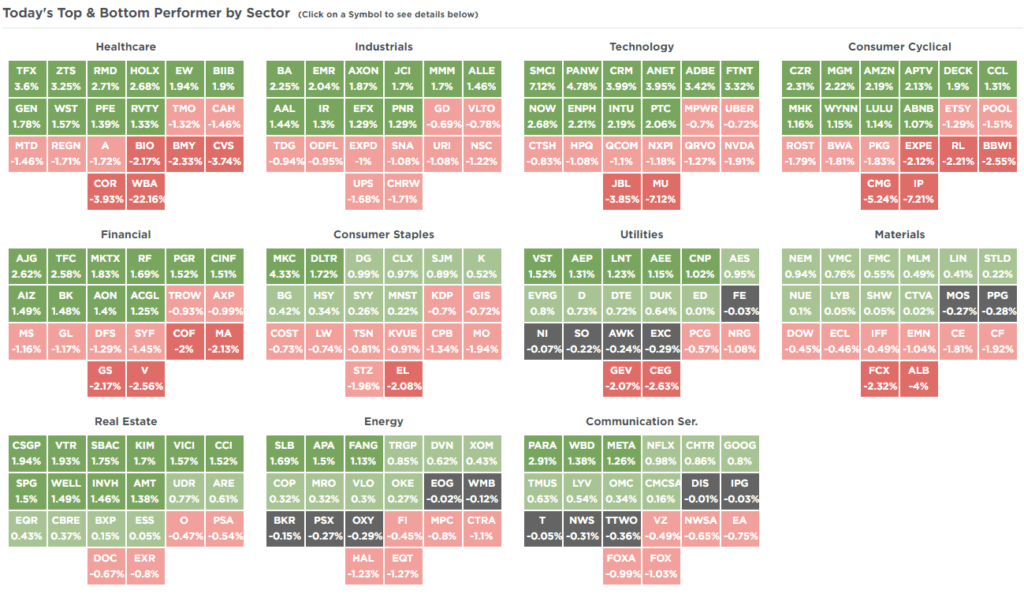
SimpleVisor Top & Bottom Performers By Sector
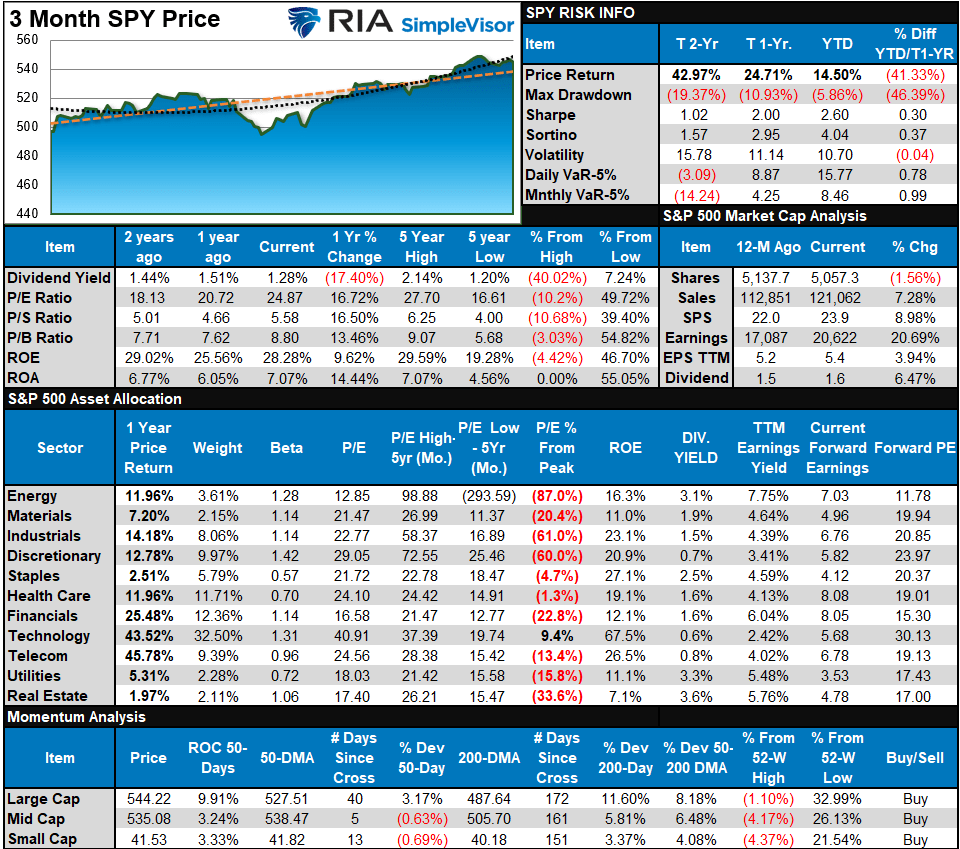
S&P 500 Weekly Tear Sheet
Relative Performance Analysis
Last week, we noted:
“Not much changed this past week, even though we did see some profit-taking in Technology stocks heading into Friday’s massive options expiration day. The market remains overbought even though those overbought conditions started to reverse this past week. The bullish backdrop remains, but the potential upside seems limited heading into the end of the month”
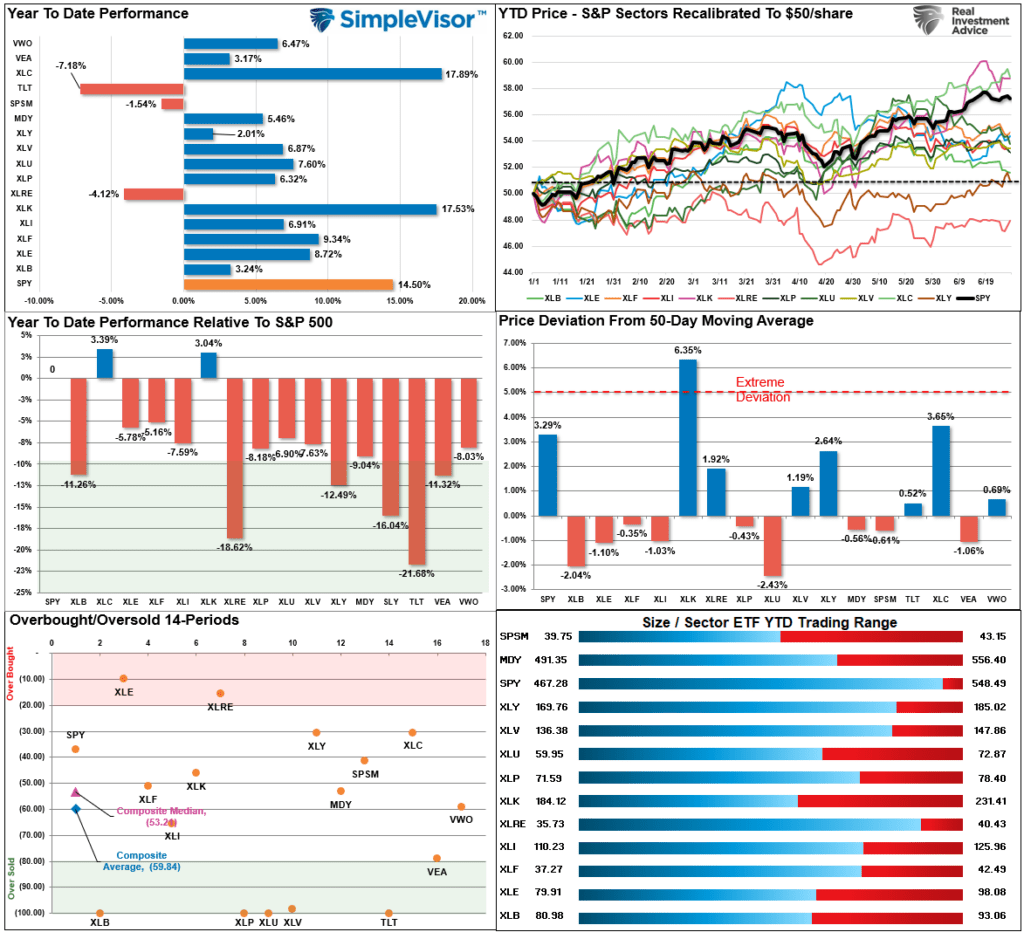
.Such was much the case this week, with the market making virtually no progress. Materials, staples, utilities, healthcare, and bonds are deeply oversold, with energy and real estate still being overbought. Given that this coming week is holiday-shortened, we could see an uptick in volatility, but I suspect we won’t see much change in the market overall
Technical Composite
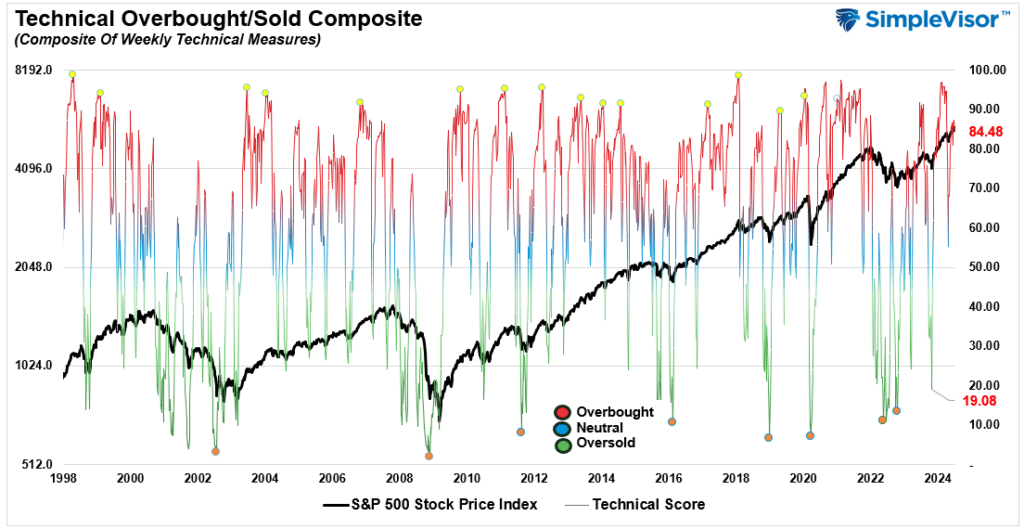
The technical overbought/sold gauge comprises several price indicators (R.S.I., Williams %R, etc.), measured using “weekly” closing price data. Readings above “80” are considered overbought, and below “20” are oversold. The market peaks when those readings are 80 or above, suggesting prudent profit-taking and risk management. The best buying opportunities exist when those readings are 20 or below.
The current reading is 84.48 out of a possible 100.
Portfolio Positioning “Fear / Greed” Gauge
The “Fear/Greed” gauge is how individual and professional investors are “positioning” themselves in the market based on their equity exposure. From a contrarian position, the higher the allocation to equities, the more likely the market is closer to a correction than not. The gauge uses weekly closing data.
NOTE: The Fear/Greed Index measures risk from 0 to 100. It is a rarity that it reaches levels above 90. The current reading is 80.36 out of a possible 100.

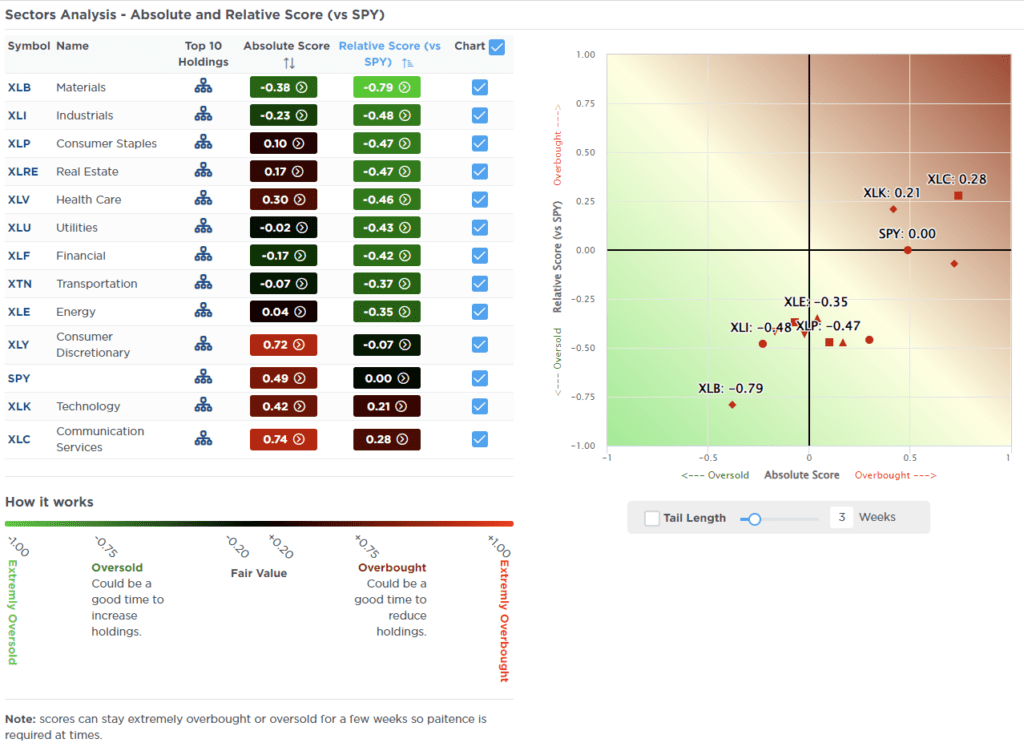
Relative Sector Analysis
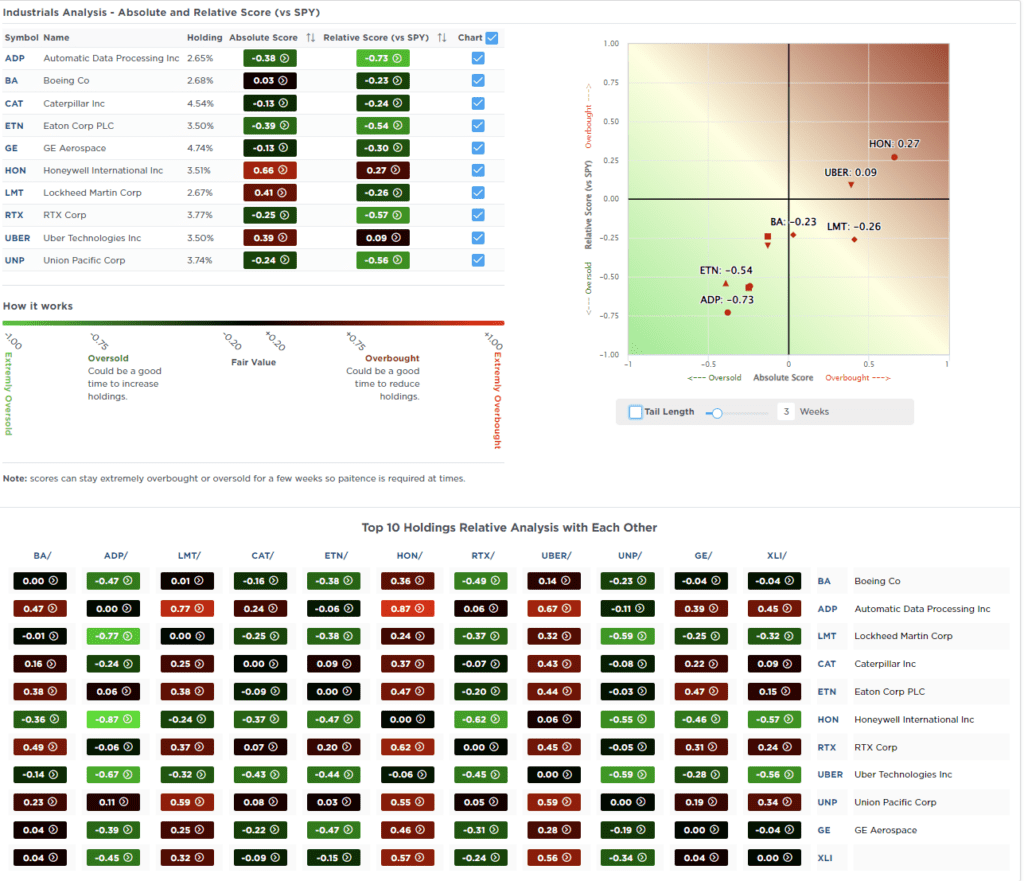
Most Oversold Sector Analysis
Sector Model Analysis & Risk Ranges
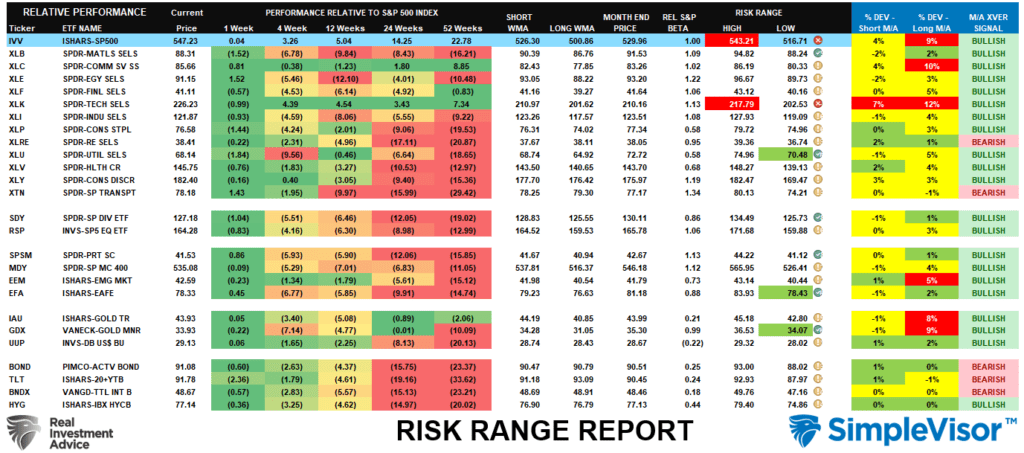
How To Read This Table
- The table compares the relative performance of each sector and market to the S&P 500 index.
- “MA XVER” (Moving Average Crossover) is determined by the short-term weekly moving average crossing positively or negatively with the long-term weekly moving average.
- The risk range is a function of the month-end closing price and the “beta” of the sector or market. (Ranges reset on the 1st of each month)
- The table shows the price deviation above and below the weekly moving averages.
The S&P 500 index trades above its historical risk range and 9% above its long-term average. Even with this past week’s “stall,” it remains outside of its regular risk ranges for the month. Technology also remains above normal risk ranges, suggesting we could see more corrective action. Healthcare and international are oversold. It is also worth noting that as of last week, real estate and transports flipped back onto bearish long-term moving average crossovers. This is the first deterioration we have seen in the broad market since last year.
Weekly SimpleVisor Stock Screens
We provide three stock screens each week from SimpleVisor.
This week, we are searching for the Top 20:
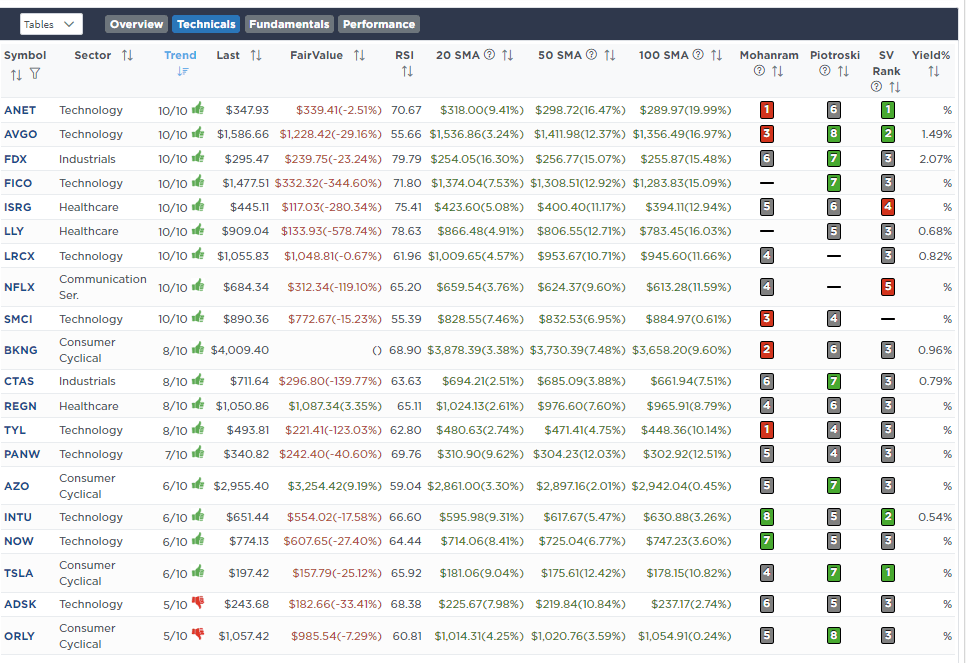
- Relative Strength Stocks
- Momentum Stocks
- Fundamental & Technical Strength W/ Dividends
(Click Images To Enlarge)
RSI Screen
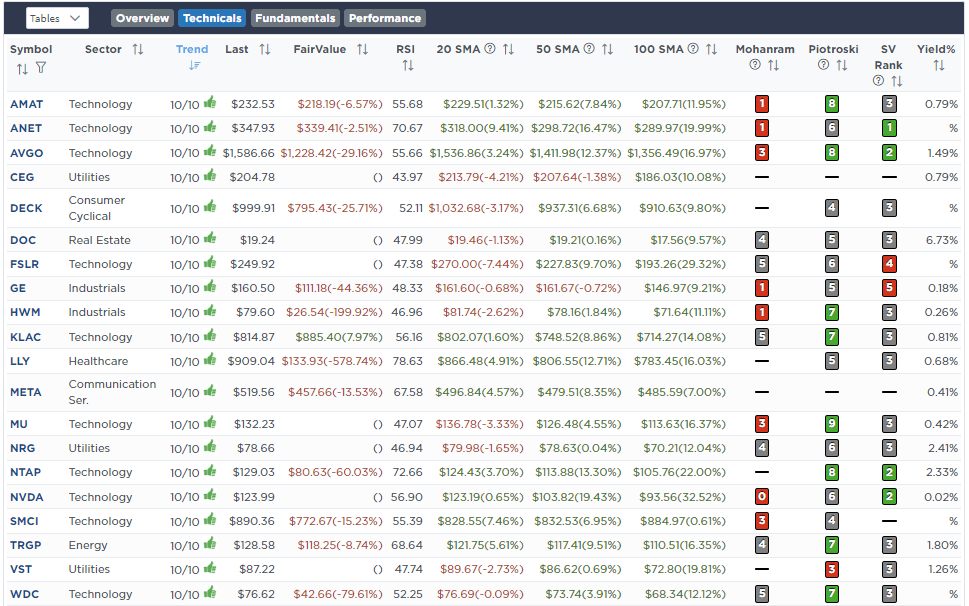
Momentum Screen
Fundamental & Technical Screen

SimpleVisor Portfolio Changes
We post all of our portfolio changes as they occur at SimpleVisor:
No Trades This Week

Lance Roberts, C.I.O.
Have a great week!


