Market Risks We Are Watching


Inside This Week’s Bull Bear Report
- Market Risks We Are Watching
- How We Are Trading It
- Research Report –Labor Market’s Impact On Earnings
- Youtube – Before The Bell
- Market Statistics
- Stock Screens
- Portfolio Trades This Week
Market Rallies After A Retest Of Support
As noted last week, the market broke the 50-DMA and closed the week at the 100-DMA. Things did not look good heading into this week. However, the market rallied off the 100-DMA and retraced to the 50-DMA. Then, on Wednesday morning, a hotter-than-expected CPI report led to a sharp 1.5% selloff that retested the 100-DMA a second time. Things looked a bit dire, but strong words from Nvidia’s (NVDA) CEO sent stocks surging higher to a 1% gain by the close. That reversal cleared resistance at the 50-DMA, confirming the retest of the previous support. That bullish action continued through Friday, clearing the 20-DMA as well.
The market will challenge the recent highs next week. The trend of higher lows and the triggering of the MACD “buy signal” all suggest the recent correction phase is over for now. While the backdrop to the market is bullish, there is still some risk over the next month as we head into the beginning of earnings season and the November election.

We continue to suggest remaining somewhat hedged against potential market volatility by taking profits, rebalancing risk, increasing cash levels, and raising stop loss levels. Outside of those “defensive” actions, the market remains bullishly biased, and there is little reason for more negative positioning at this time.
Does that mean there is “no” risk to the markets? Of course not. This week, we will discuss three market risks we are watching as we head into the end of summer.
Need Help With Your Investing Strategy?
Are you looking for complete financial, insurance, and estate planning? Need a risk-managed portfolio management strategy to grow and protect your savings? Whatever your needs are, we are here to help.

Market Risks We Are Watching
Recent economic data suggests several market risks remain as the correction continues. The latest inflation report, data from the National Federation of Independent Business, oil prices, and employment each impact the markets. We will discuss each, starting with the latest inflation report.
The latest Consumer Price Index (CPI) sent markets tumbling on Wednesday. A trend of falling inflation drastically reduced the odds of the Federal Reserve cutting interest rates by 50 basis points next week. Furthermore, if inflation remains sticky, this could keep the Federal Reserve more moderate in future rate cuts. The recent report shows homeowners’ equivalent rent (housing), transportation, recreation, and education costs rose. However, energy costs, food, and other goods and services declined.
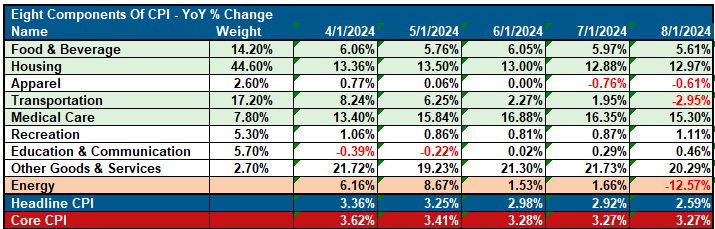
However, regarding market risks, the latest reading shows inflation trending lower but still above the Fed’s target. While such will keep the Fed on the path of cutting rates, the markets were hoping for a more aggressive cycle.
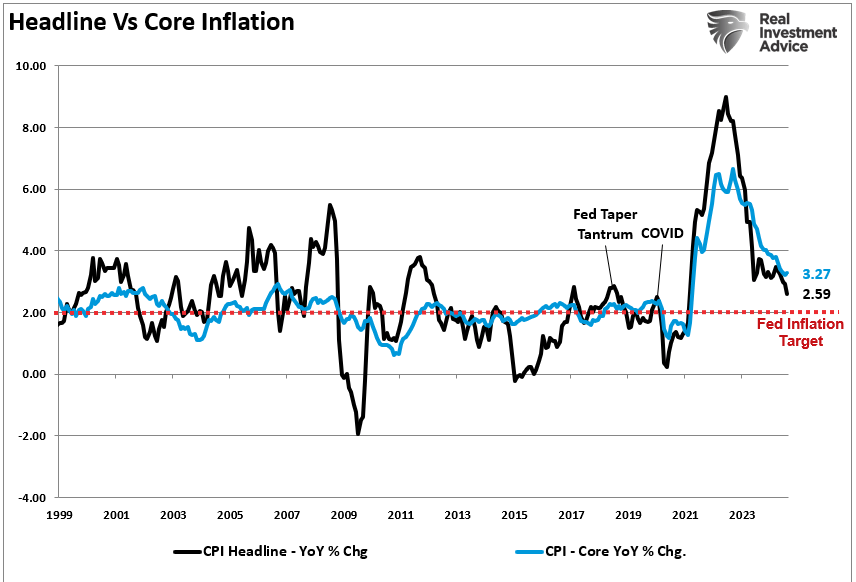
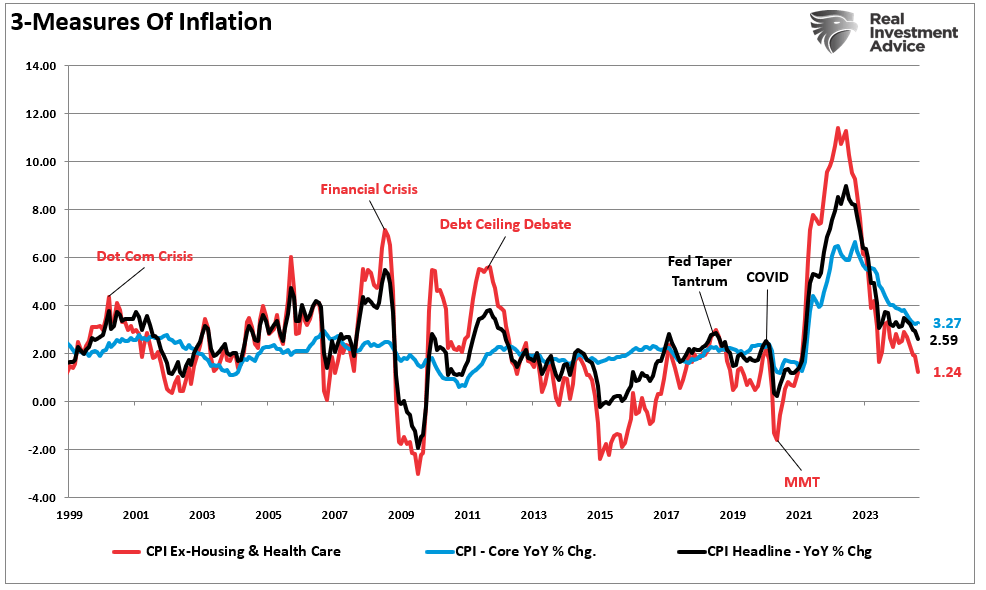
Falling inflation is negative for the economy as it results from slower demand. While headline inflation remains sticky, inflation less healthcare and housing is plummeting. The chart shows three measures of inflation. Given that most American’s rent or mortgage payments and healthcare costs are set for a specific term, a measure excluding those two variables gives us a better “day-to-day” measure of the cost of living. In recent months, that measure has collapsed to just 1.24% annualized. Such suggests that economic demand is likely much weaker than headlines suggest.
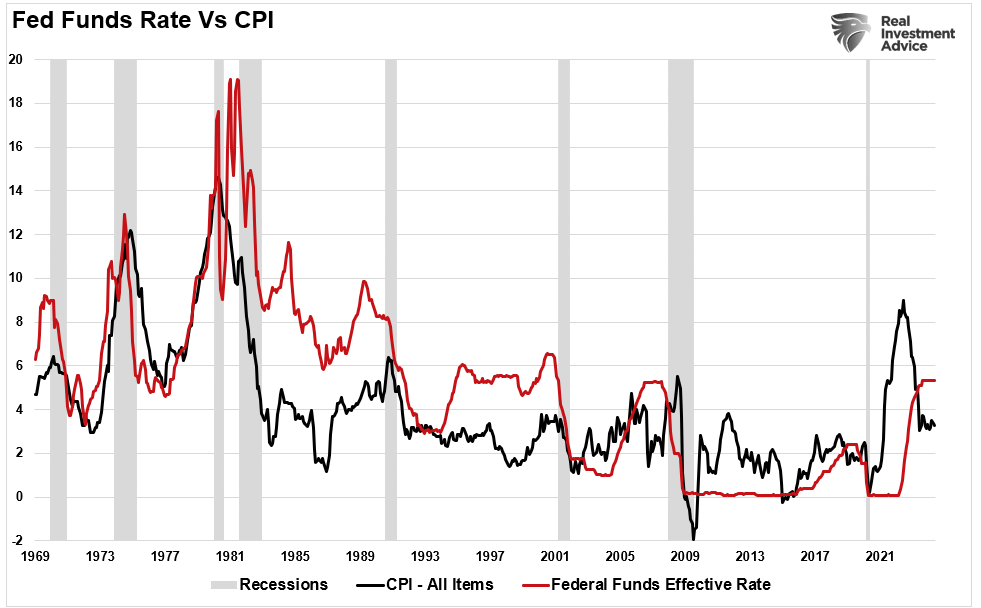
The Federal Reserve will cut rates by 25 basis points next week as inflation weakens. Historically, Fed funds have tracked inflation declines as the Fed works to limit economic weakness.
Speaking of weaker economic data, the oil market is beginning to ring an alarm.
Oil Prices
Oil prices are crucial to the overall economic equation, and there is a correlation between them, inflation, and interest rates.
The demand side of the equation is a tell-tale sign of economic strength or weakness, given that oil is consumed in virtually every aspect of our lives, from the food we eat to the products and services we buy. We can see this clearly in the chart below, which combines rates, inflation, and GDP into one composite indicator. One important note is that oil tends to trade along pretty defined trends (black trend lines) until it doesn’t. Importantly, since the oil industry is very manufacturing and production intensive, breaks of price trends tend to be liquidation events, which harms manufacturing and CapEx spending and feeds into the GDP calculation.

“It should not be surprising that sharp declines in oil prices have been coincident with downturns in economic activity, a drop in inflation, and a subsequent decline in interest rates.“
We can also view the impact of oil prices on inflation by looking at breakeven inflation rates.
The short version is that oil prices reflect supply and demand. Global demand has already been falling for the last several months, and oil prices are sending warnings that “market hopes” for a “global reflation” are likely not a reality. More importantly, falling oil prices will put the Fed in a tough position as deflationary pressures rise in the next few months. The chart below shows breakeven 5-year and 10-year inflation rates versus oil prices.
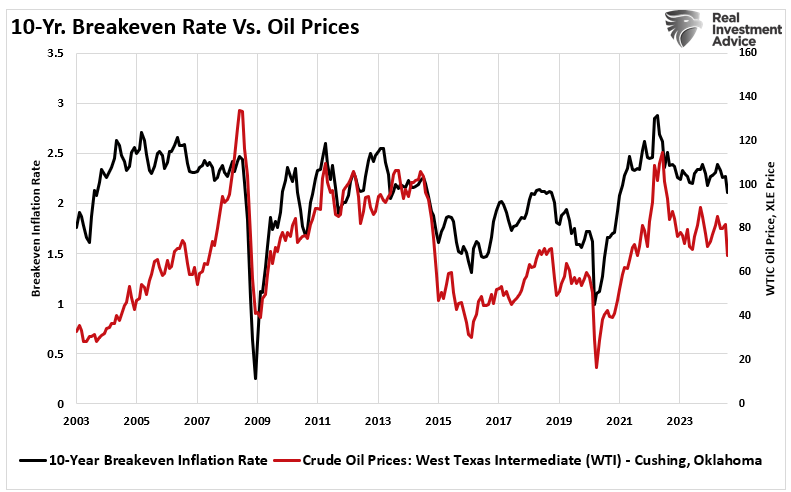
As with inflation, the decline in oil prices reflects a build in supply and a decline in demand. As consumers become increasingly financially distressed, they contract spending (demand), putting companies on the defensive (supply). The problem is that this virtual spiral continues until exhaustion. As with the latest inflation print, the recent decline in oil prices suggests the economy is weakening, increasing market risk.
Such was also seen in the latest report from the National Federation of Independent Business (NFIB).
NFIB Sends A Warning
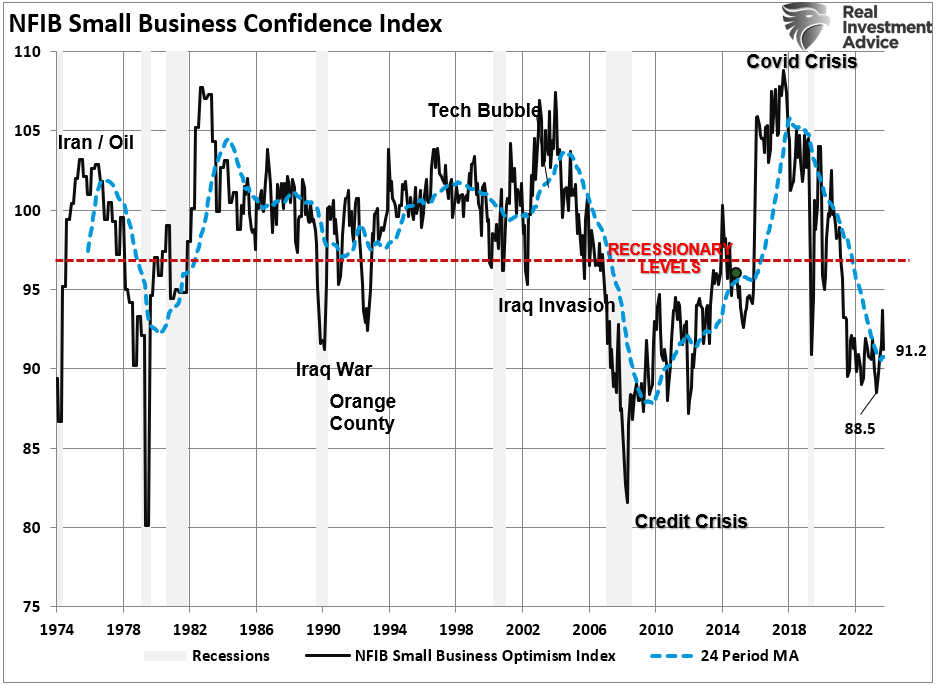
“It is crucial to understand that small and mid-sized businesses comprise a substantial percentage of the U.S. economy. Roughly 60% of all companies in the U.S. have less than ten employees. Small businesses drive the economy, employment, and wages. Therefore, the NFIB’s statements are highly relevant to the economy’s current state compared to the headline economic data from Government sources.” – RIA
While recent government data on economic growth and employment do not currently suggest a recession is approaching, the NFIB survey declined in its latest reading. After a brief summer bump, that entire gain was reversed in the August repair and remained only marginally above its lowest level in 11 years. However, as far as an economic warning goes, it remained at levels historically associated with a recessionary economy.
Examining sales and employment figures can help us understand why business owners remain pessimistic about the overall economy. The chart below shows the NFIB members’ sales expectations over the next quarter compared to the previous quarter. The black line is the average of both with a long-term median.
Unsurprisingly, business owners are always optimistic that sales will improve in the next quarter. However, actual sales tend to fall short of those expectations. The two have a very high correlation, so the average of both provides valuable information. Sales expectations and actual sales are well below levels typically witnessed during recessions. With sales (demand) weak, there is little need to increase production (supply) substantially.

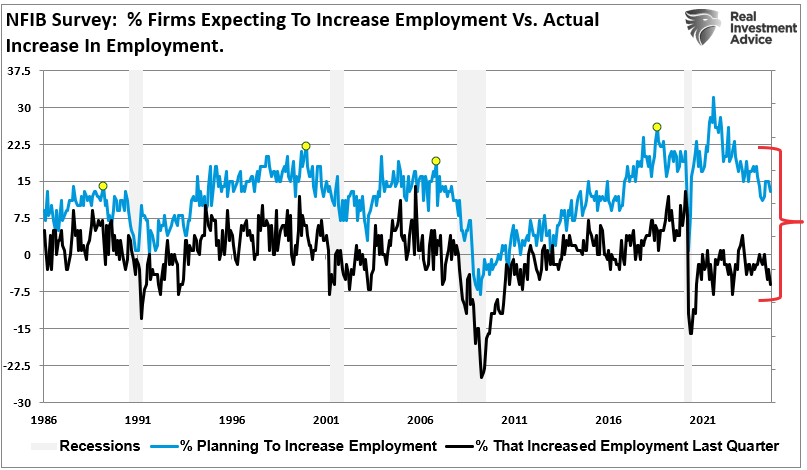
The demand side of the economic equation is crucially important. If the demand for a business owner’s products or services declines, there is little need to increase employment. Therefore, if economic growth was as robust as headlines suggest, why are small businesses’ plans to increase employment declining sharply?
Furthermore, when demand falls, business owners look to cut operating costs to protect profitability. While cutting future employment is part of that equation, so are plans to raise worker compensation.
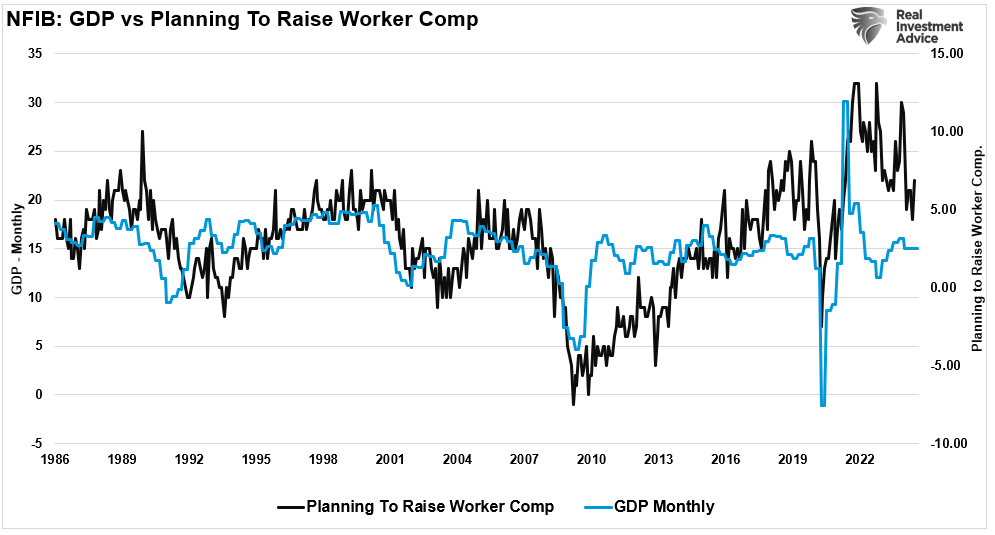
The last chart is crucial. As discussed yesterday, the U.S. is a consumption-based economy. However, consumers can not consume without producing something first. Production must come first to generate the income needed for that consumption.
As employees receive fewer compensation increases (raises, bonuses, etc.) amid rising living costs, they cut consumption, which translates into slower economic growth rates. In turn, business owners cut employment and compensation further. It is a virtual spiral that historically ends in recession.
A Common Ingredient
The analysis above shares a common ingredient as it relates to market risk. While it may or may not suggest an impending recession, it clearly outlines a trend of weakening economic activity. As noted in yesterday’s analysis, earnings are critical to the primary driver of the markets over time.
“When companies are uncertain about future demand, they stop hiring and look to cut costs. These cost-cutting measures appear in numerous ways, such as layoffs, automation, outsourcing, or increasing temporary hires. Such measures can buy companies some time but don’t solve declining revenues. When fewer people have jobs or wage growth stalls, consumer spending slows down, and that hits the top line for many companies, particularly in consumer-driven sectors. Unsurprisingly, there is a relatively high correlation between the annual change in GDP and corporate earnings.”
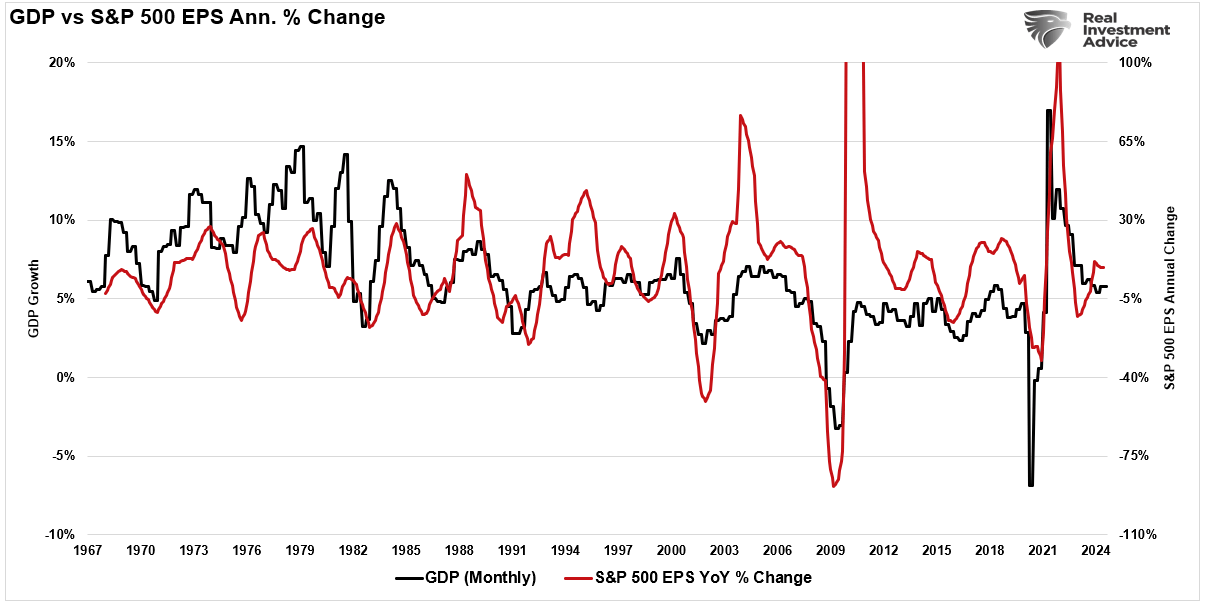
As such, given that market participants bid up stock prices in anticipation of higher earnings and vice versa, the correlation between the annual change in earnings and market prices is also high.
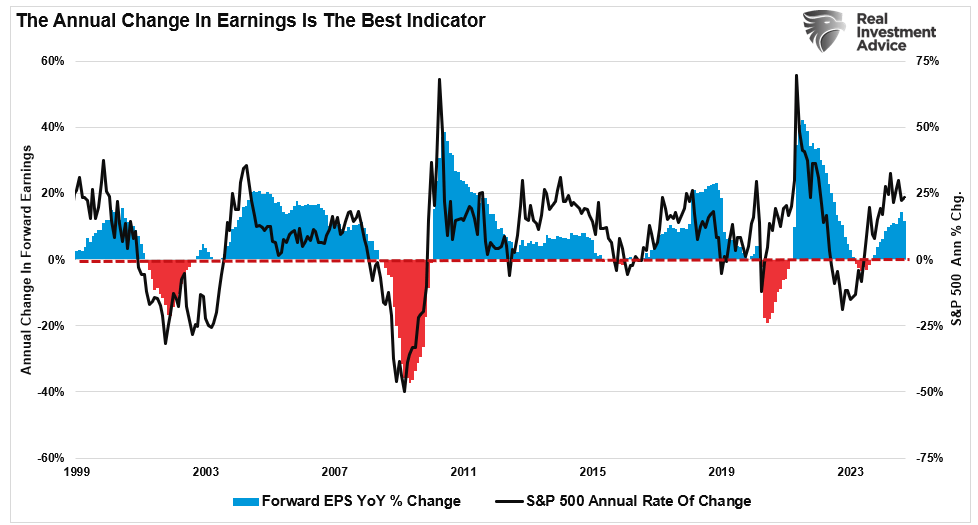
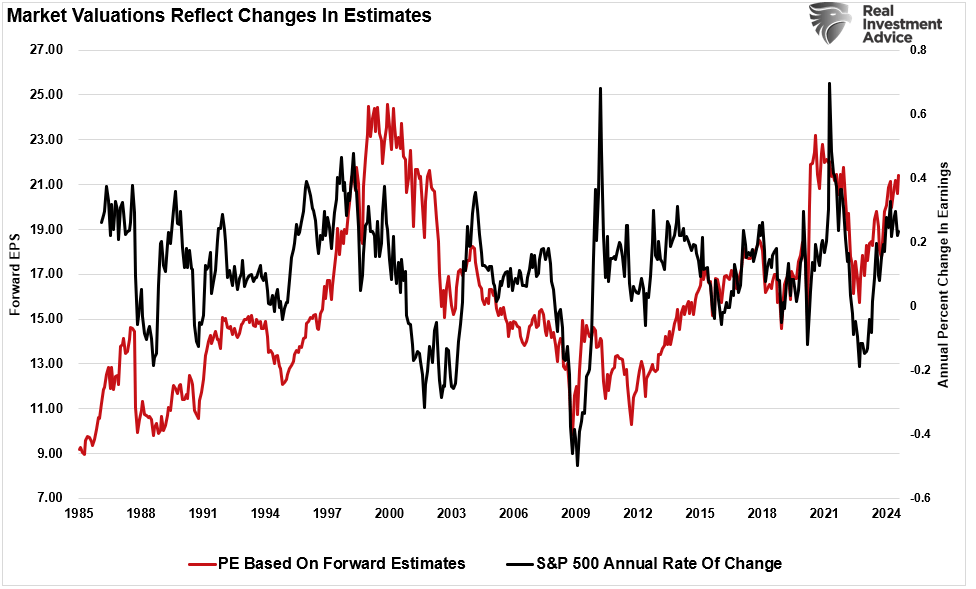
We’ve seen how quickly earnings can disappoint in past economic cycles as economic data weakens. Analysts remain overly optimistic about earnings growth, but the reality of slower consumer demand will force them to adjust their projections. As earnings expectations come down, investors will need to rethink current valuations. This is a straightforward equation about market risk: lower earnings lead to lower stock prices as markets reprice current valuations.
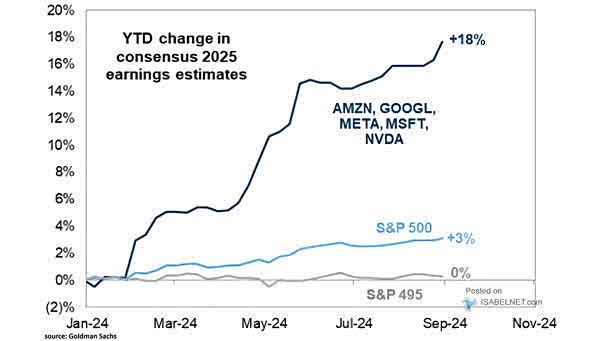
The market is a forward-looking mechanism, and it’s already starting to price in the effects of weaker economic growth. One of the most significant market risks is declining earnings growth in Technology companies. Those companies have been the primary driver of earnings growth for the entire index. These companies rely on high growth expectations to justify their lofty valuations. If the economy weakens, consumer demand for tech products and services will also.
Economic data continues to suggest more weakness ahead. While the economy could avoid a recession, such would likely not resolve the market risk of disappointing earnings growth heading into 2025.
How We Are Trading It
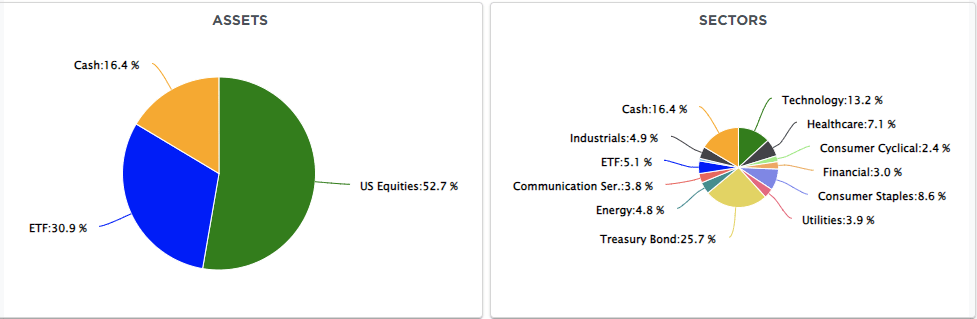
The broader financial markets are potentially at risk of a “bumpier ride” as the effects of the weakening economic growth ripple through the economy. As we’ve seen in previous cycles, investors have already started moving away from riskier assets like stocks and into safer investments such as Treasury bonds. Such a shift could exacerbate market volatility if earnings get revised lower to reflect slower economic activity.
As noted, with markets still near all-time highs, it is an excellent time to reassess portfolio risk exposures. Rebalancing positions in overvalued growth stocks and shifting toward more defensive assets could be prudent. As we have often said, capital preservation should be the priority in times of uncertainty. The labor market indicates that uncertain times are ahead, and investors should prepare accordingly.
We remain allocated to equities, although we are slightly underweighting our targets and reduced our exposure to technology back in July. Furthermore, we are also underweight longer-duration bonds in favor of short-term bills. With bonds currently overbought, we await a short-term rise in yields to provide a better entry point to lengthen our overall bond duration.
While the long-term risks are undoubtedly obvious, as noted, such can take much longer to appear than logic would predict. Therefore, we continue to manage short-term risk as needed to control returns and volatility.
Have a great week.
Research Report

Subscribe To “Before The Bell” For Daily Trading Updates
We have set up a separate channel JUST for our short daily market updates. Please subscribe to THIS CHANNEL to receive daily notifications before the market opens.
Click Here And Then Click The SUBSCRIBE Button
Subscribe To Our YouTube Channel To Get Notified Of All Our Videos
Bull Bear Report Market Statistics & Screens

SimpleVisor Top & Bottom Performers By Sector

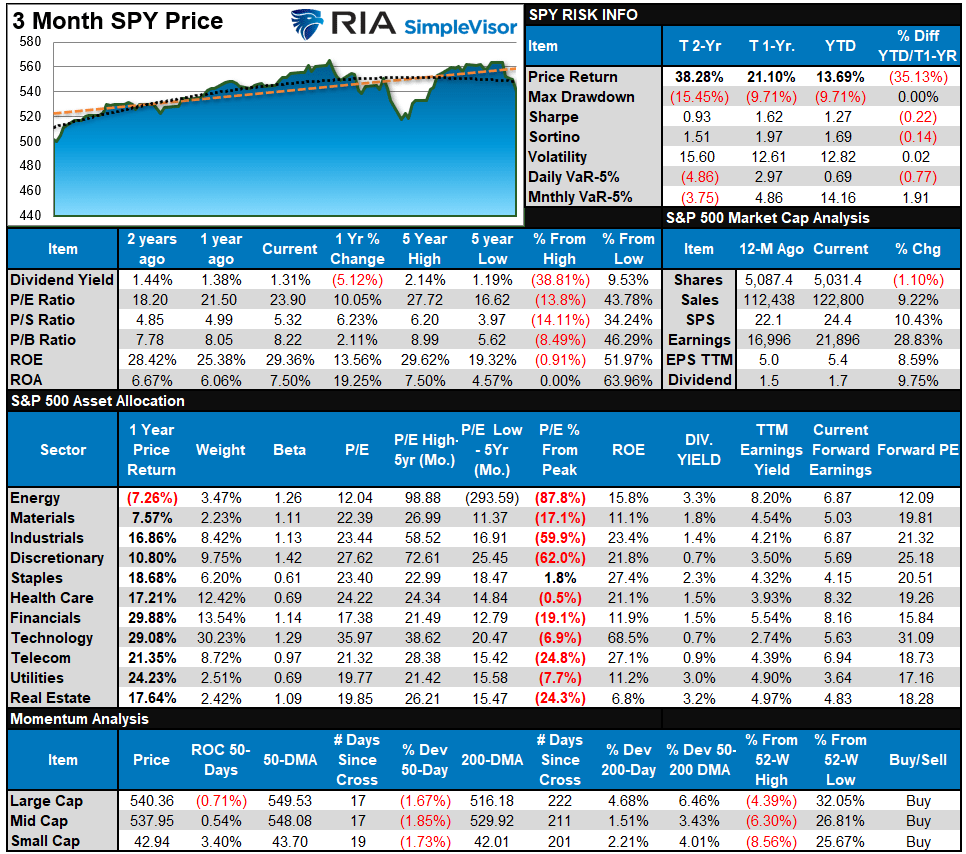
S&P 500 Weekly Tear Sheet
Relative Performance Analysis
We noted last week:
“Unsurprisingly, most sectors and markets are now back to oversold, setting the market up for a reflexive bounce this coming week.”
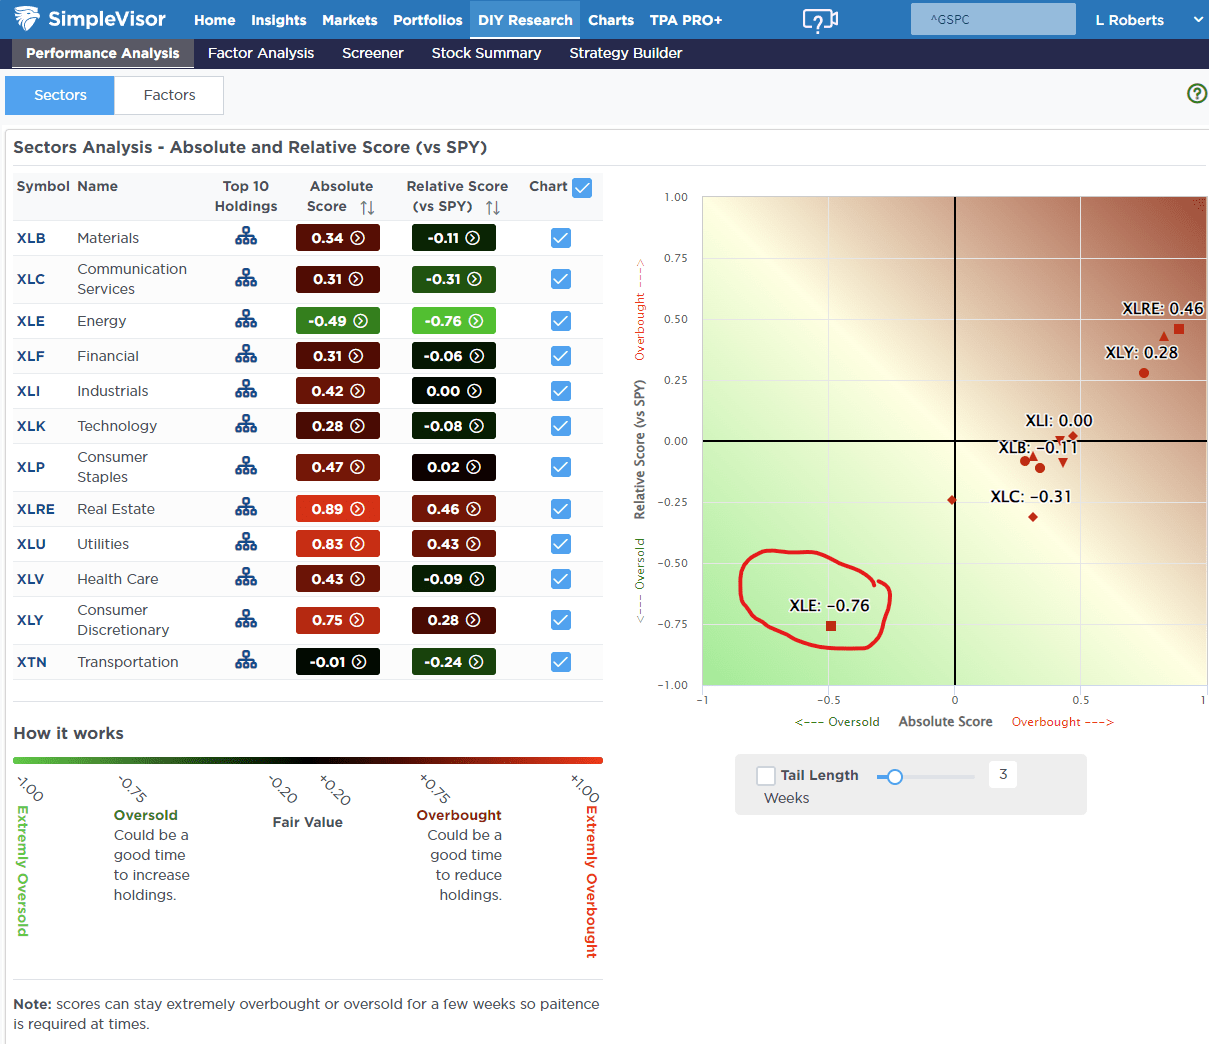
That reflexive rally was extremely strong, with most sectors reversing their previous oversold conditions. The defensive sectors are extremely overbought, while Financials and Energy are oversold. The rally could continue this week, with the broad market challenging previous highs. However, with many sectors and markets returning to overbought conditions, the upside likely remains somewhat limited in the near term.

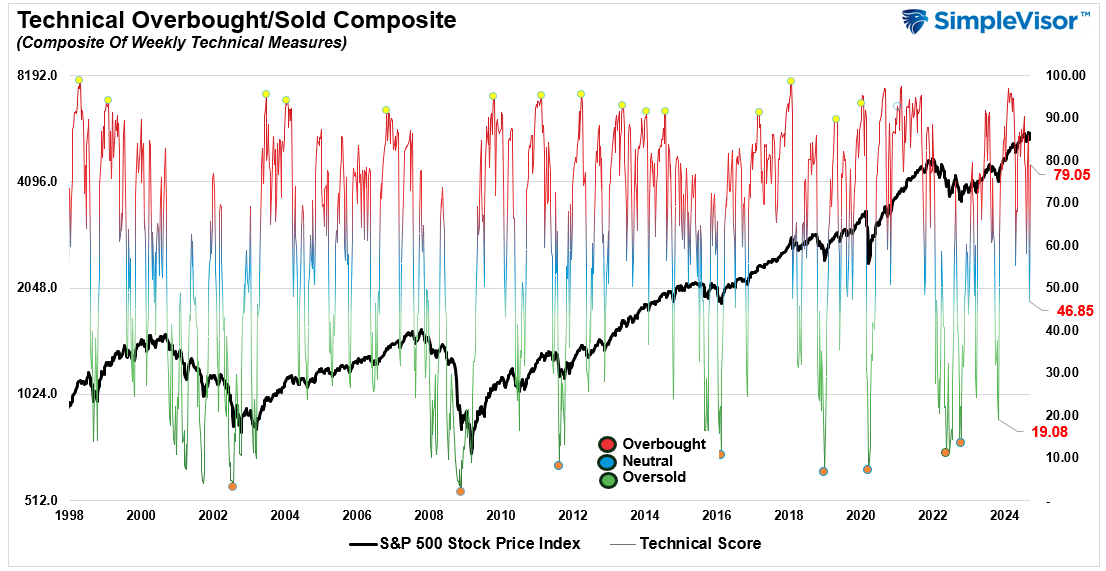
Technical Composite
The technical overbought/sold gauge comprises several price indicators (R.S.I., Williams %R, etc.), measured using “weekly” closing price data. Readings above “80” are considered overbought, and below “20” are oversold. The market peaks when those readings are 80 or above, suggesting prudent profit-taking and risk management. The best buying opportunities exist when those readings are 20 or below.
The current reading is 79.05 out of a possible 100.
Portfolio Positioning “Fear / Greed” Gauge
The “Fear/Greed” gauge is how individual and professional investors are “positioning” themselves in the market based on their equity exposure. From a contrarian position, the higher the allocation to equities, the more likely the market is closer to a correction than not. The gauge uses weekly closing data.
NOTE: The Fear/Greed Index measures risk from 0 to 100. It is a rarity that it reaches levels above 90. The current reading is 70.76 out of a possible 100.

Relative Sector Analysis
Most Oversold Sector Analysis

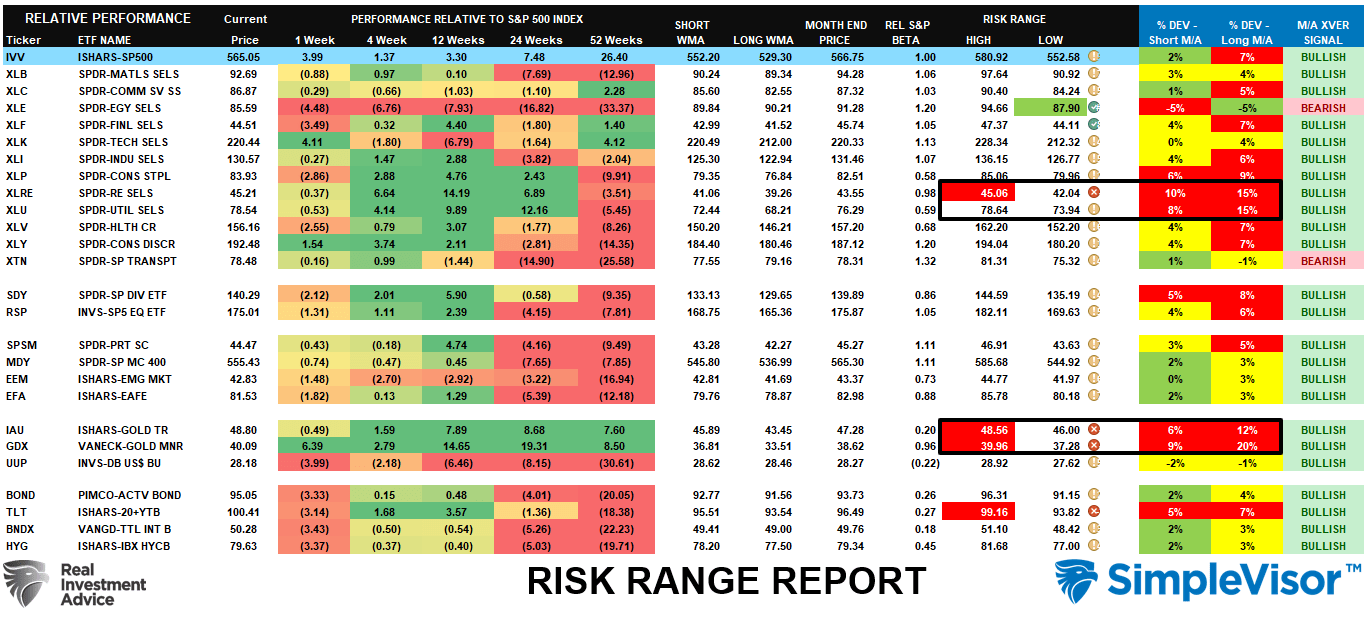
Sector Model Analysis & Risk Ranges
How To Read This Table
- The table compares the relative performance of each sector and market to the S&P 500 index.
- “MA XVER” (Moving Average Crossover) is determined by the short-term weekly moving average crossing positively or negatively with the long-term weekly moving average.
- The risk range is a function of the month-end closing price and the “beta” of the sector or market. (Ranges reset on the 1st of each month)
- The table shows the price deviation above and below the weekly moving averages.
The rally this past week was very strong as investors piled back into familiar trades that have worked well this year. Technology, Utilities, Real Estate, Gold, and Gold Miners are overbought, pushing double-digit deviations. Take profits in these sectors and rebalance accordingly, as they will pull back. On the other hand, energy is extremely oversold, and we are likely near a tradeable opportunity in that space. With almost all sectors on bullish crossovers, the bias is to the upside, so maintain equity exposure relative to your risk tolerance.
Weekly SimpleVisor Stock Screens
We provide three stock screens each week from SimpleVisor.
This week, we are searching for the Top 20:
- Relative Strength Stocks
- Momentum Stocks
- Fundamental & Technical Strength W/ Dividends
(Click Images To Enlarge)
RSI Screen

Momentum Screen

Fundamental & Technical Screen

SimpleVisor Portfolio Changes
We post all of our portfolio changes as they occur at SimpleVisor:
No Trades This Week
Lance Roberts, C.I.O.
Have a great week!


