Democrats Should Start Worrying About The Deficit.
Democrats should start worrying about the level of debt and the increasing deficit. I previously discussed this issue when President Obama held the White House, when Marshall Auerback, via the Nation, wrote:
“Delivering on big progressive ideas like Medicare for All and the Green New Deal will never happen until Democrats get over their fear of red ink.”
While that article was a long and winding mess of convoluted ideas, the following excerpt was vital.
“In an environment increasingly characterized by slowing global economic growth, businesses are understandably hesitant to invest in a way that creates high-quality, high-paying jobs for the bulk of the domestic workforce. The much-vaunted Trump corporate ‘tax reform’ may have been sold to the American public on that basis, but corporations have largely used their tax cut bonanza to engage in share buybacks, which fatten executive compensation but have done nothing for the rest of us. At the same time, private households still face constraints on their consumption because of stagnant wages, rising health care costs, declining job security, poorer employment benefits, and rising debt levels.
Instead of solving these problems, the reliance on extraordinary monetary policy from the Federal Reserve via programs such as quantitative easing has exacerbated them. In contrast to properly targeted fiscal spending, the Federal Reserve’s misguided monetary policies have fueled additional financial speculation and asset inflation in stock markets and real estate, which has made housing even less affordable for the average American.”
While there is truth in that statement, and it is the same issue I have railed against previously in this blog, Mr. Auerback’s solution was seemingly simple.
“Democrats should embrace the ‘extremist’ spirit of Goldwater and eschew fiscal timidity (which, in any case, is based on faulty economics). After all, Republicans do it when it suits their legislative agenda. Likewise, Democrats should go big with deficits—as long as they are used for the transformative programs that progressives have long talked about and now have the chance to deliver.”
As I noted then, such a solution was essentially the adoption of Modern Monetary Theory (MMT), which, as discussed previously, is the assumption debt and deficits “don’t matter” as long as there is no inflation.
“Modern Monetary Theory is a macroeconomic theory that contends that a country that operates with a sovereign currency has a degree of freedom in their fiscal and monetary policy, which means government spending is never revenue constrained, but rather only limited by inflation.” – Kevin Muir
However, fast forward to the present, we tried MMT; the Democrats went big with debts and deficits and funded social programs, and the result was a massive spike in inflation and no actual increase in broad economic prosperity.
So, what went wrong?
The Non-Solution
The problem with most Democratic spending ideas on social programs and welfare, like free healthcare or college, is the lack of a crucial ingredient. That ingredient is a “return on investment.” Dr. Woody Brock previously addressed this point in his book “American Gridlock;”
“Country A spends $4 Trillion with receipts of $3 Trillion. This leaves Country A with a $1 Trillion deficit. In order to make up the difference between the spending and the income, the Treasury must issue $1 Trillion in new debt. That new debt is used to cover the excess expenditures but generates no income leaving a future hole that must be filled.
Country B spends $4 Trillion and receives $3 Trillion income. However, the $1 Trillion of excess, which was financed by debt, was invested into projects, infrastructure, that produced a positive rate of return. There is no deficit as the rate of return on the investment funds the “deficit” over time.“
Let me be clear. There is no disagreement about the need for government spending. The debate is about the abuse and waste of it.
John Maynard Keynes’ was correct in his theory that for government “deficit” spending to be effective, the “payback” from investments made through debt must yield a higher rate of return than the debt used to fund it.
Currently, the U.S. is “Country A.”
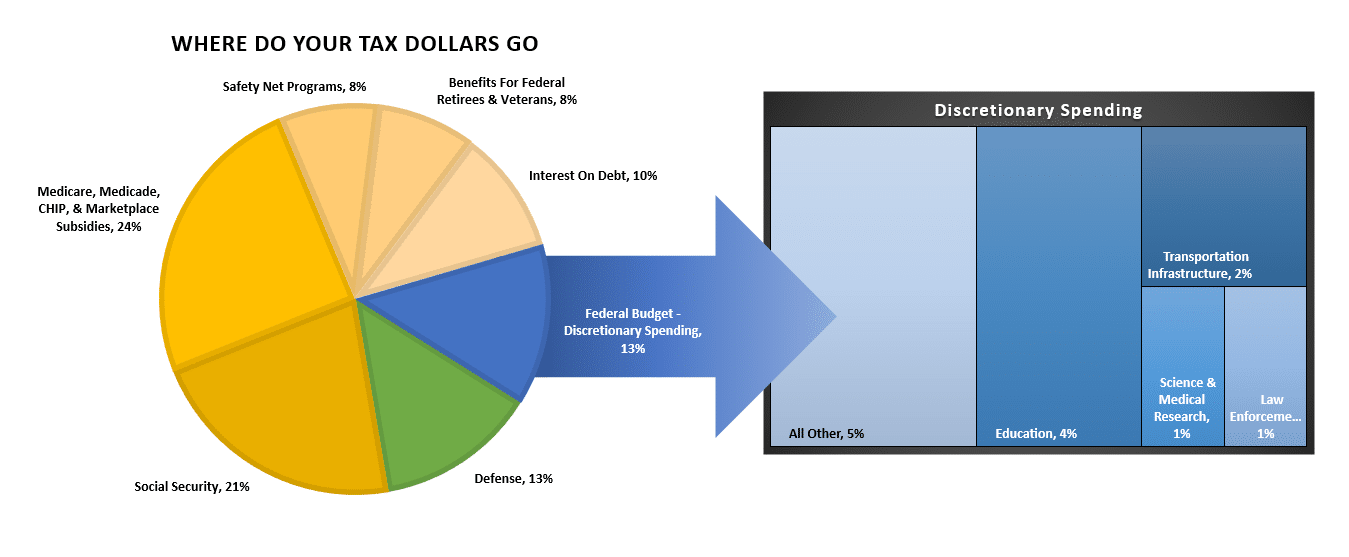
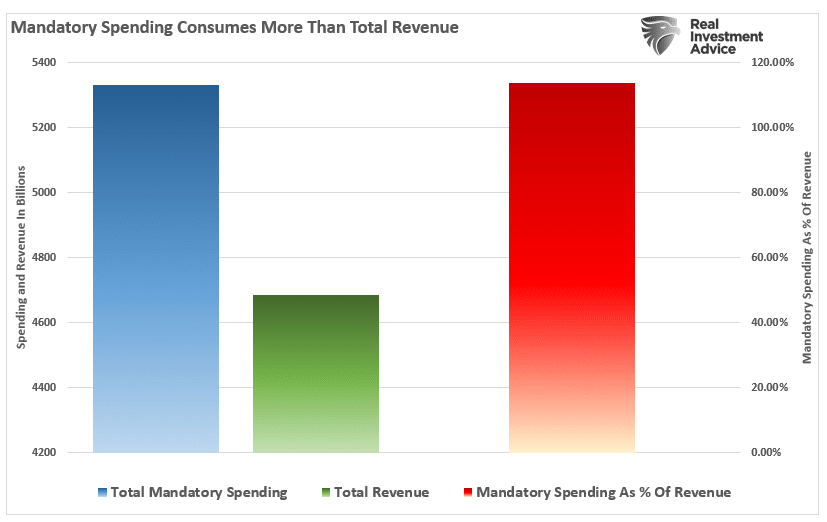
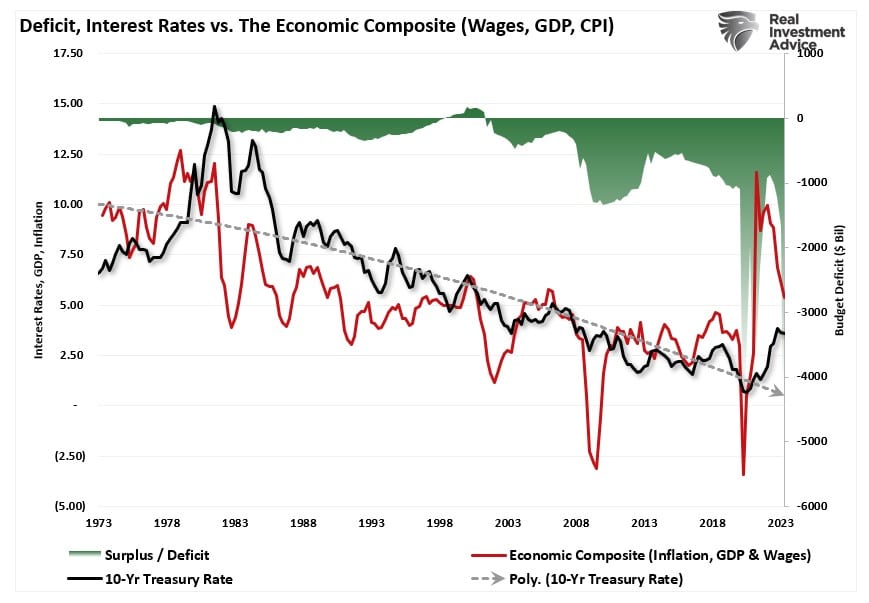
The problem with the more socialistic programs that Democrats continue to pursue with deficit spending is that it exacerbates the problem. The Center On Budget & Policy Priorities data can help visualize the issue.
As of the latest annual data, through the end of Q2-2023, the Government spent $6.3 Trillion, of which $5.3 Trillion went to mandatory expenses. In other words, it currently requires 113% of every $1 of revenue to pay for social welfare and interest on the debt. Everything else must come from debt issuance.
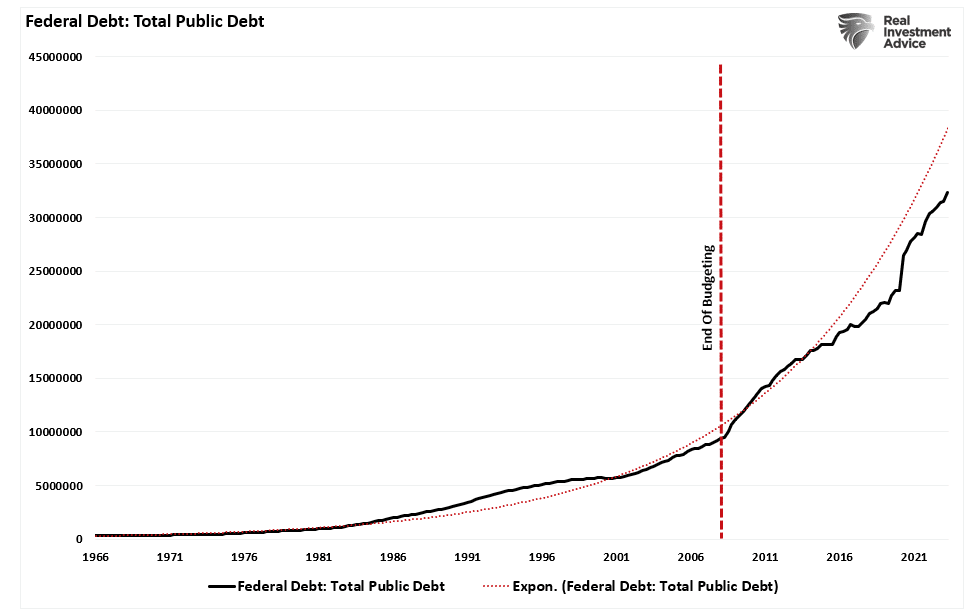
This is why debt issuance has surged since 2008 when Congress quit using the budgeting process to allow for rampant spending.
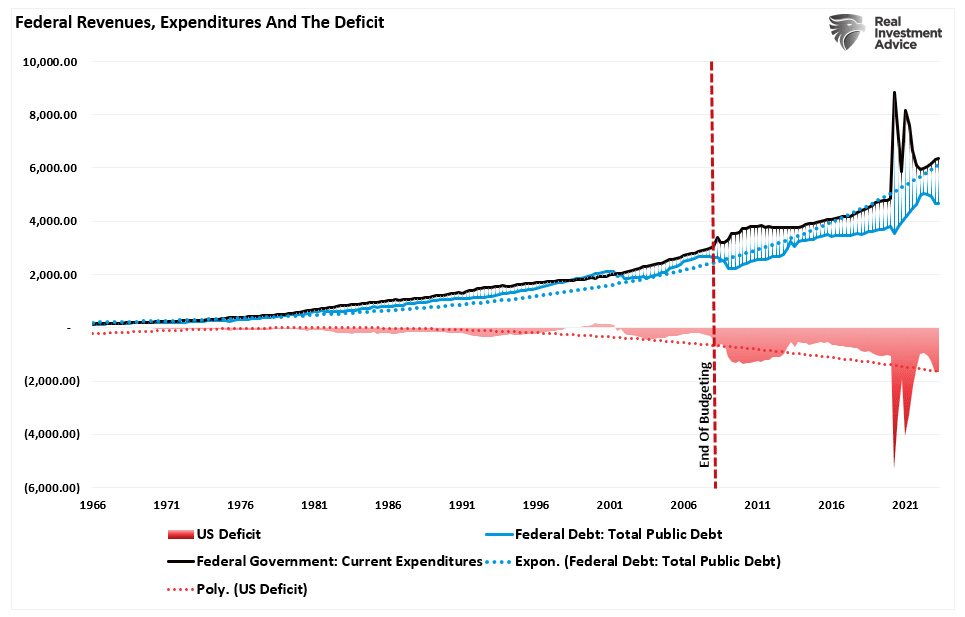
Of course, given the massive surge in spending, revenues cannot keep up the pace, leading to a rapid increase in debt issuance and a trending deficit.
However, while Democrats keep pushing for more socialistic programs, which garners votes in election cycles, they are now faced with a problem that may be their undoing.
Debt Diverts Productive Capital
Ben Ritz for the WSJ recently penned:
“Deficits are undermining the Biden economy. In the past year, the real federal budget deficit more than doubled, from $933 billion to $2 trillion. Democrats rightly argued that spending borrowed money was a critical economic support during the Covid pandemic. But the unemployment rate the over past year has been consistently lower than any point since the 1950s.
Economists, even those on the far left who subscribe to ‘modern monetary theory,’ agree that increasing deficits in a tight labor market fuels inflation. Voters’ frustrations with inflation and the interest-rate hikes implemented to bring it under control exceed their appreciation for low unemployment, fueling disapproval of President Biden’s economic record. Deficit reduction is more important than it has been at any other time in the 21st century.”
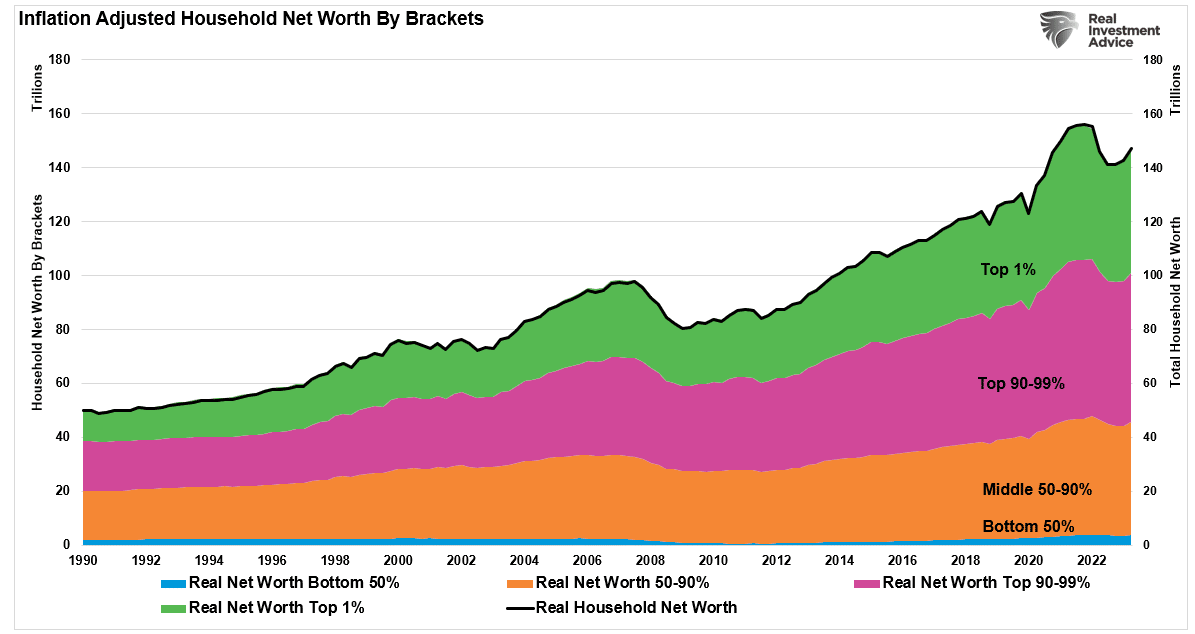
The problem with the analysis is that while the “unemployment rate” may be low, economic disparity is high. While the massive surge in pandemic-era spending boosted economic inflation, it also created an enormous rise in inflation, unsurprisingly. That inflation surge spurred the Fed to aggressively hike rates on the short end of the yield curve, while inflation and economic growth pushed long-term rates higher.
Subsequently, higher inflation and higher borrowing costs priced out wage increases with substantially higher living costs. Unsurprisingly, the net worth of the bottom 90% of Americans has failed to improve.
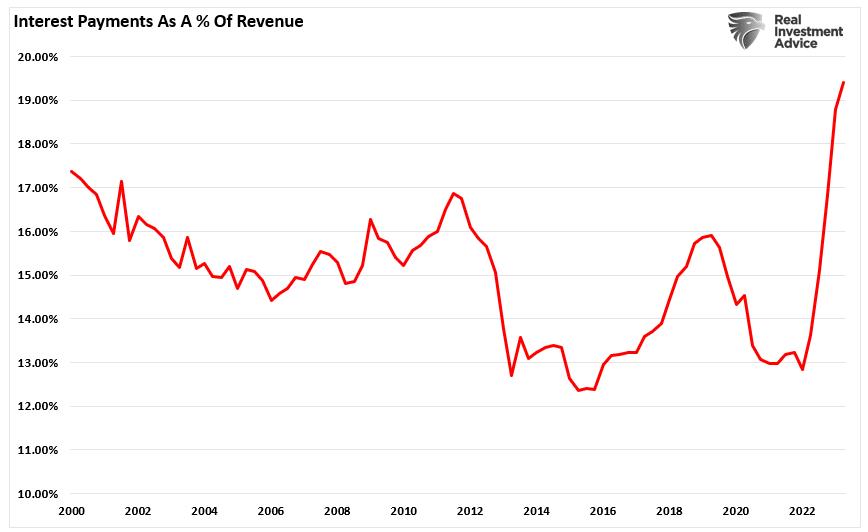
The problem for the Democrats is that continuing to push socialistic programs only makes the situation worse. Yes, more “free money” to individuals sounds excellent in theory, but prices ultimately increase more. The problem is exacerbated as non-productive debt erodes economic growth, and more debt diverts productive capital into interest payments.
“Annual interest payments are already at their highest level as a percentage of gross domestic product since the 1990s. By 2028 the government is projected to spend more than $1 trillion on interest payments each year—more than it spends on Medicaid or national defense. Worse, the U.S. may be entering a vicious circle whereby higher deficits increase debt and fuel inflation, which the Federal Reserve must combat by raising interest rates, causing debt-service costs to balloon further.” – Ben Ritz
While the Democrats continue to push for more social spending programs, we have potentially reached the point where that may be no longer feasible. I agree with Ben’s view that it may be time for both Democrats and Republicans to start taking steps to restore fiscal responsibility in Washington.
The average American family is no longer supportive of new progressive policies when they believe we can’t even pay for the promises already made.
Of course, if the economy slips into a recession before the 2024 election, we could see a political rout in Washington, D.C.
CFNAI: The Most Important & Overlooked Economic Number
The Chicago Fed National Activity Index (CFNAI) is arguably one of the most important and overlooked economic indicators. Each month, economists, the media, and investors pour over various mainstream economic indicators, from GDP to employment and inflation, to determine what markets will likely do next.
While economic numbers like GDP or the monthly non-farm payroll report typically garner the headlines, the most crucial statistic, in my opinion, is the CFNAI. Investors and the press mostly ignore it, but the CFNAI is a composite index of 85 sub-components, giving a broad overview of overall economic activity in the U.S.
Since the beginning of this year, the markets ran up sharply over into July as the Federal Reserve again intervened in the markets to bail out regional banks. Then, even as the market pulled back this summer, economic growth accelerated in the 3rd quarter, according to the headlines, which should translate into a resurgence of corporate earnings. However, if recent CFNAI readings are any indication, investors may want to alter their growth assumptions heading into next year.
While most economic data points are backward-looking statistics, like GDP, the CFNAI is a forward-looking metric that indicates how the economy will likely look in the coming months.
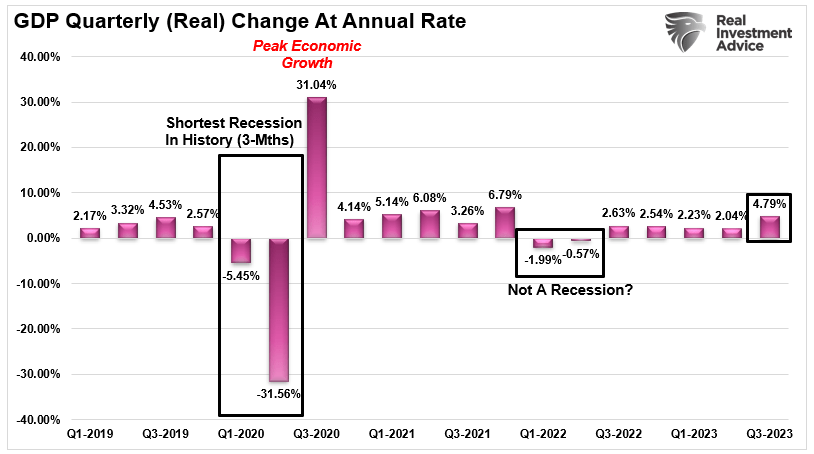
Notably, that data does not support the recent economic report from the Bureau Of Economic Analysis (BEA), which showed the economy expanded by 4.9% in Q3.
So, what is the CFNAI telling us that is different than the BEA economic report?
Breaking Down The “Most Important Number”
Understanding the message the index is designed to deliver is critical. From the Chicago Fed website:
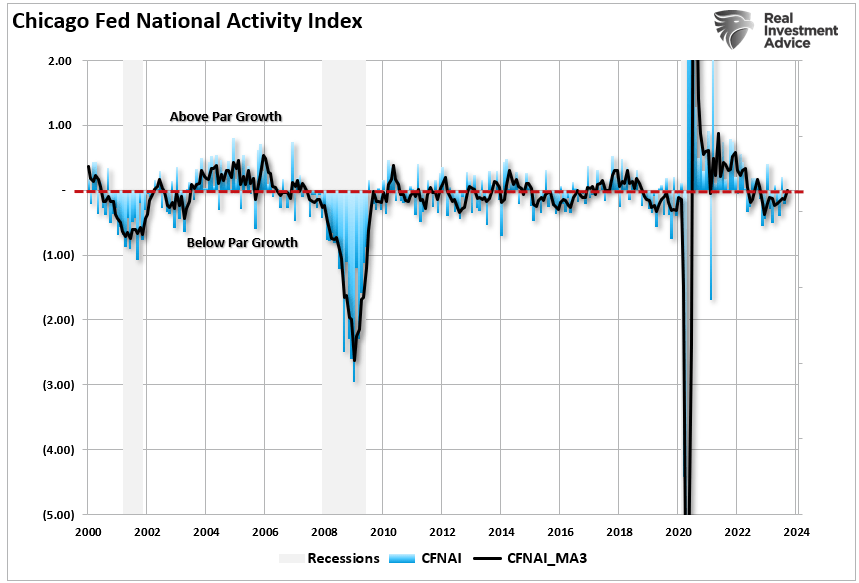
“The Chicago Fed National Activity Index (CFNAI) is a monthly index designed to gauge overall economic activity and related inflationary pressure. A zero value for the index indicates that the national economy is expanding at its historical trend rate of growth; negative values indicate below-average growth; and positive values indicate above-average growth.“
The overall index is broken down into four major sub-categories, which cover:
Production & Income
Employment, Unemployment & Hours
Personal Consumption & Housing
Sales, Orders & Inventories
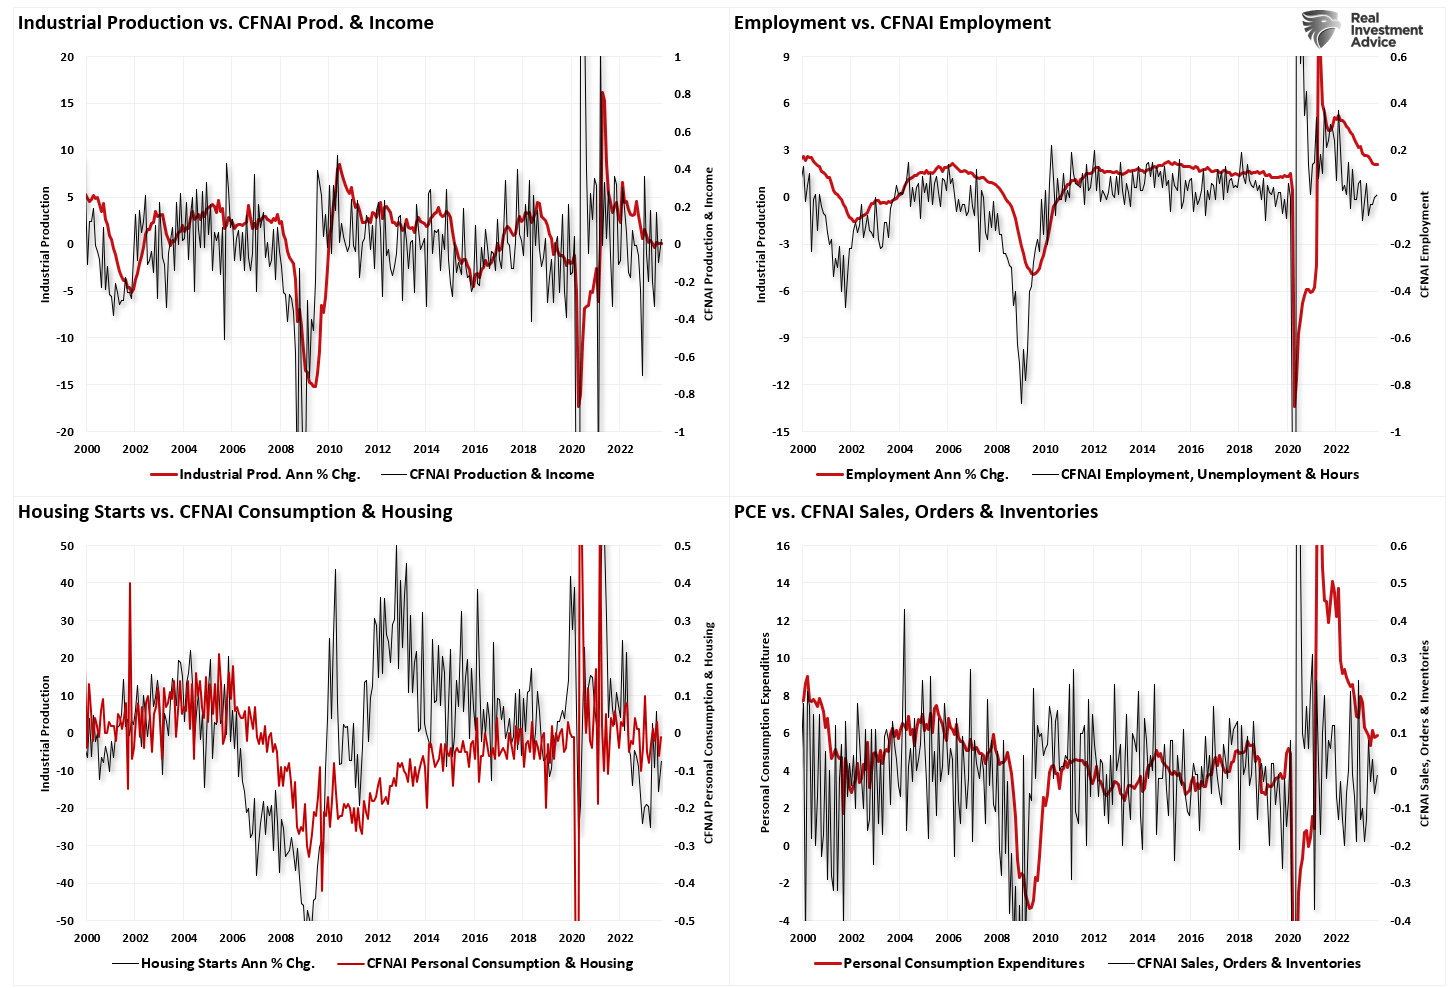
To better grasp these four critical sub-components and their predictive capability, I have constructed a 4-panel chart. I have compared the CFNAI sub-components to the four most common economic reports of Industrial Production, Employment, Housing Starts, and Personal Consumption Expenditures. To provide a more comparative base to the construction of the CFNAI, I used an annual percentage change for these four components.
The correlation between the CFNAI sub-components and the underlying major economic reports is high. This is why, even though this indicator gets very little attention, it represents the broader economy. The CFNAI is not confirming the mainstream view of an “economic resurgence” that will drive earnings growth into next year.
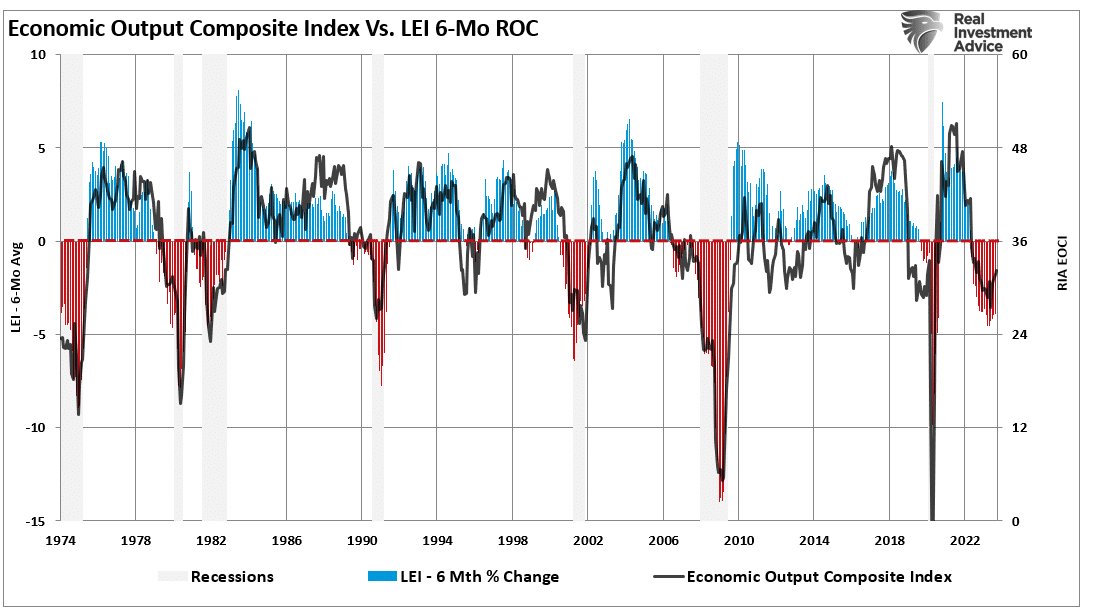
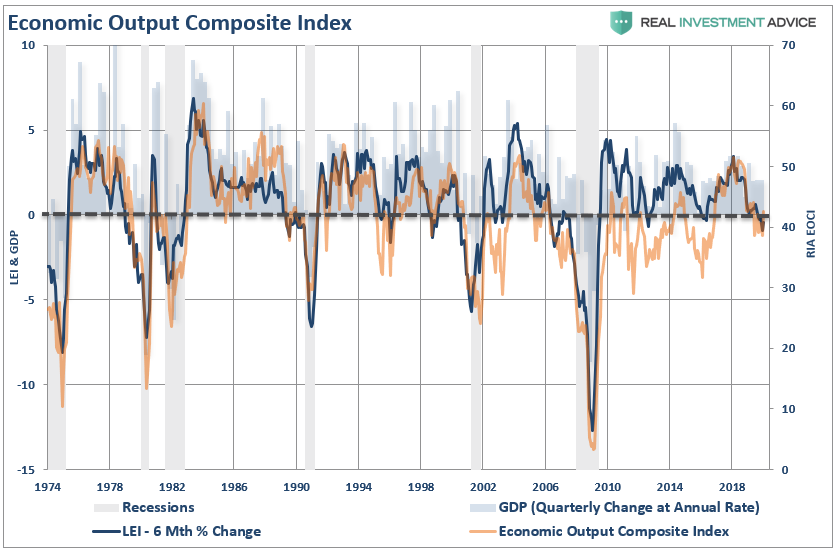
The CFNAI is also essential to our RIA Economic Output Composite Index (EOCI). The EOCI is an even broader composition of data points, including Federal Reserve regional activity indices, the Chicago PMI, ISM, the National Federation of Independent Business Surveys, and the Leading Economic Index. The EOCI further confirms that “hopes” of an immediate rebound in economic activity are unlikely. To wit:
“As discussed in“Signs, Signs, Everywhere Signs,” numerous measures suggest a recession is forthcoming. However, that recession has yet to reveal itself. Such has led to a fierce debate between the bulls and the bears. The bears contend that a recession is still coming, while the bulls are betting more heavily on a “no landing” scenario or, instead, avoiding a recession. Even the Federal Reserve is no longer expecting a recession.
But how is a “no recession” outcome possible amid the most aggressive rate hiking campaign in history, deeply inverted yield curves, and other measures warning of its inevitability?“
There are a couple of essential points to note in this very long-term chart.
Economic contractions tend to reverse fairly frequently from high peaks, and those contractions tend to revert towards the 30-reading on the chart. Recessions are always present with sustained readings below the 30 level.
The financial market is generally correct in price as weaker economic data weighs on market outlooks.
Currently, the EOCI index suggests more contraction will come in the coming months, which will likely weigh on asset prices as earnings estimates and outlooks are ratcheted down heading into 2024.
It’s In The Diffusion
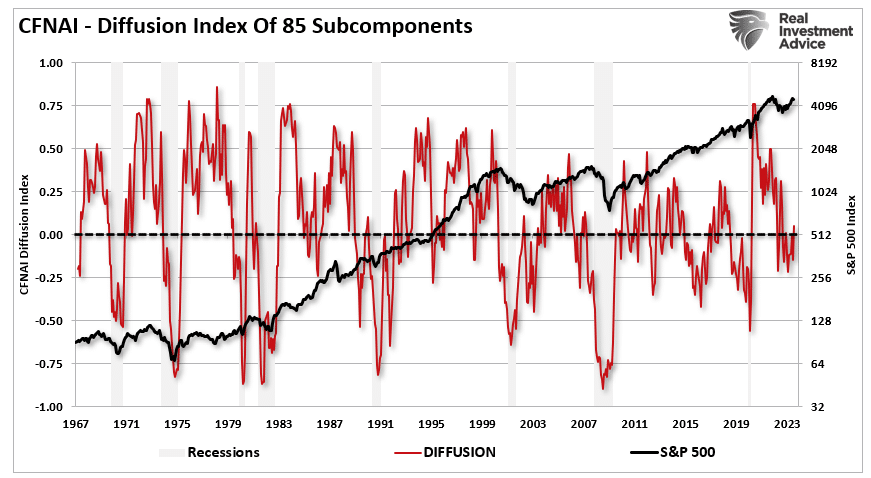
The Chicago Fed also provides a breakdown of the change in the underlying 85 components in a “diffusion” index. As opposed to just the index itself, the “diffusion” of the components gives us a better understanding of the broader changes inside the index itself.
There are two points of consideration:
When the diffusion index dips below zero,it coincides with weak economic growth and outright recessions.
The S&P 500 has a history of corrections and outright bear markets, corresponding with negative readings in the diffusion index.
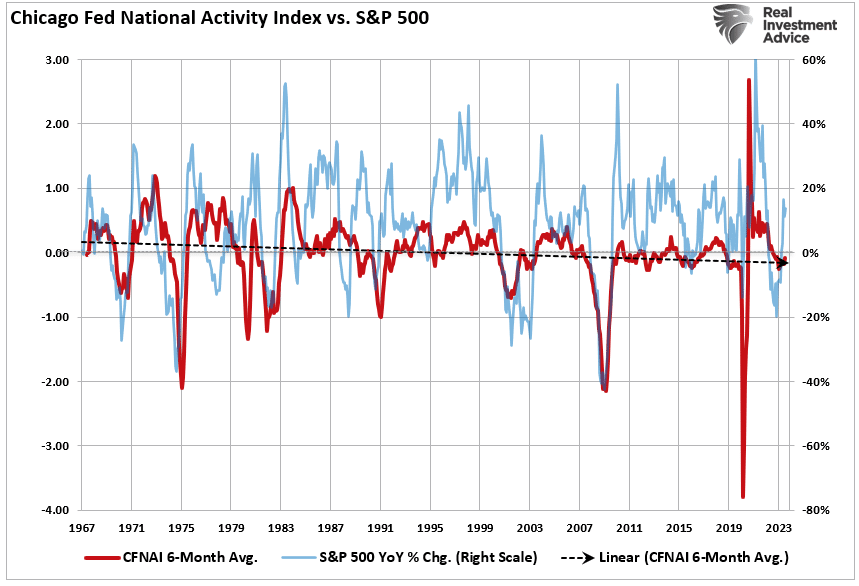
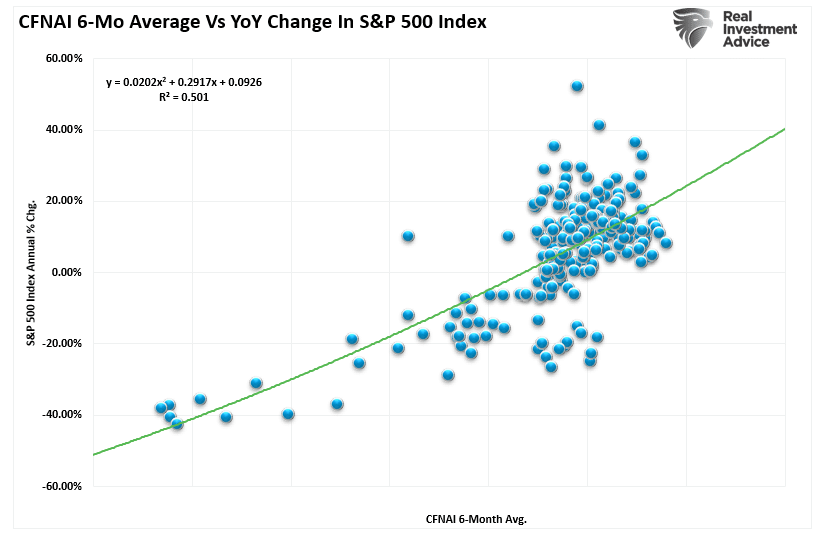
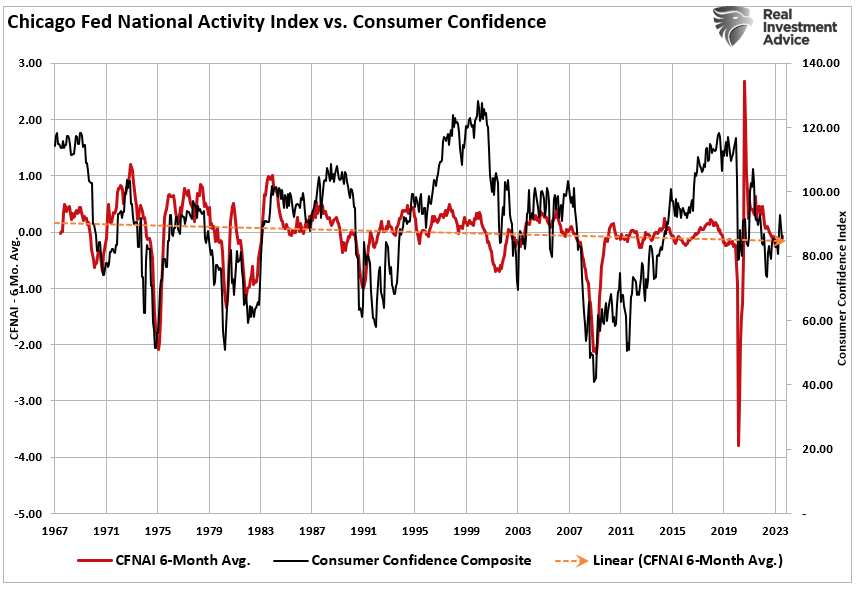
The second point should not be surprising, as the stock market reflects economic growth. Both the EOCI index above and the CFNAI below correlate to the annual rate of change in the S&P 500. Again, the correlation should not be surprising. (The monthly CFNAI data is very volatile, so we use a 6-month average to smooth the data.)
How good of a correlation is it? The r-squared is 50% between the annual rate of change for the S&P 500 and the 6-month average of the CFNAI index. More importantly, the CFNAI suggests the S&P 500 should be trading lower to correspond with the economic data. Throughout its history, the CFNAI tends to be right more often than market players.
Investors should also be concerned about the current level of consumer confidence readings.
Not So Confident
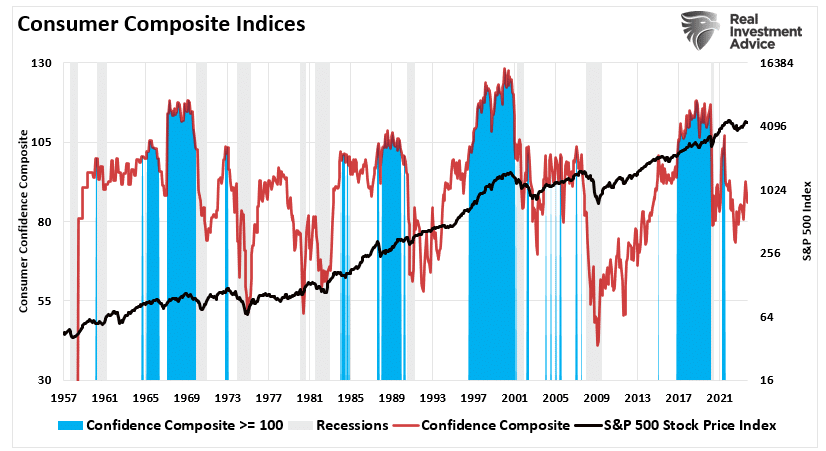
The chart below is our consumer confidence composite index. It combines the University of Michigan and the Conference Board’s sentiment readings into one index. The shaded areas are when the composite index exceeds 100, corresponding with rising asset markets.
While that index has declined over the last 18 months, it remains elevated above previous recessionary levels, suggesting the economy continues to muddle along. The issue is the divergence between “consumer” confidence and “CEO’s.” The question is, who should we pay attention to?
“Is it the consumer cranking out work hours, raising a family, and trying to make ends meet? Or the CEO of a company that has the best view of the economic landscape. Sales, prices, managing inventory, dealing with collections, paying bills, tells them what they need to know about the actual economy?”
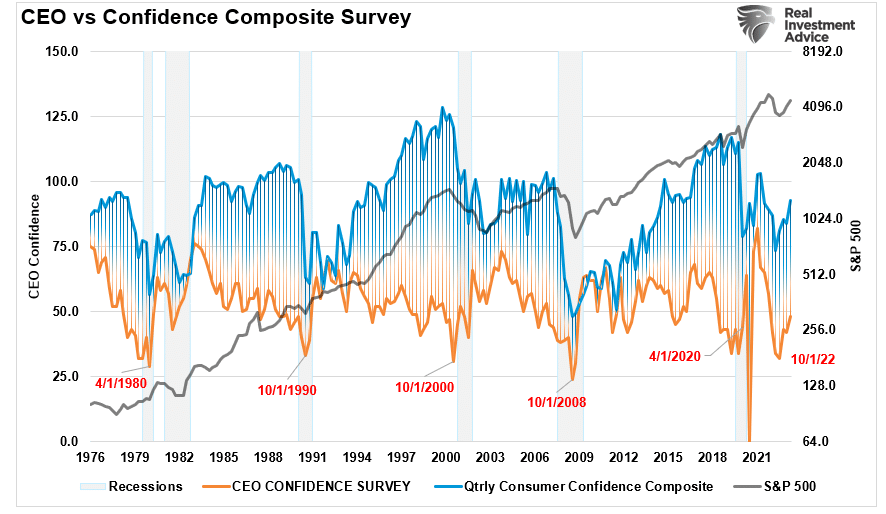
CEO confidence leads consumer confidence by a wide margin. Such lures bullish investors, and the media, into believing that CEO’s don’t know what they are doing. Unfortunately, consumer confidence tends to crash as it catches up with what CEO’s were already telling them.
What were CEO’s telling consumers that crushed their confidence?
“I’m sorry, we think you are great, but I have to let you go.”
Despite the recent uptick in CEO confidence since October, which corresponded with strong equity market performance, confidence is hovering around pre-recessionary levels. Notably, CEO confidence is not uncommon to tick higher just before the recession is announced.
The CFNAI also tells the same story: significant consumer confidence divergences eventually “catch down” to the underlying index.
This chart suggests that we will begin seeing weaker employment numbers and rising layoffs in the months ahead if history guides the future.
Conclusion
While the media hopes for a “no recession” scenario, the data tells us an important story.
Notably, the historical data of the CFNAI and its relationship to the stock market have included all Federal Reserve activity.
The CFNAI and EOCI incorporate the impact of monetary policy on the economy in both past and leading indicators. Such is why investors should hedge risk to some degree in portfolios, as the data still suggests weaker than anticipated economic growth. The current trend of the various economic data points on a broad scale is not showing indications of recovery but of a longer-than-expected recession and recovery.
Economically speaking, such weak levels of economic growth do not support more robust employment or higher wages. Instead, we should expect that 2024 could be a year where corporate earnings and profits disappoint investors as economic weakness continues.
Technically Speaking: The 4-Phases Of A Full-Market Cycle
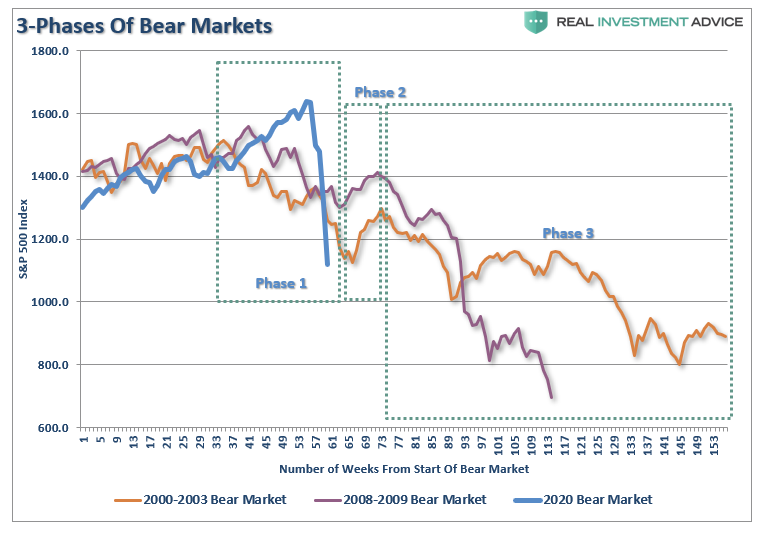
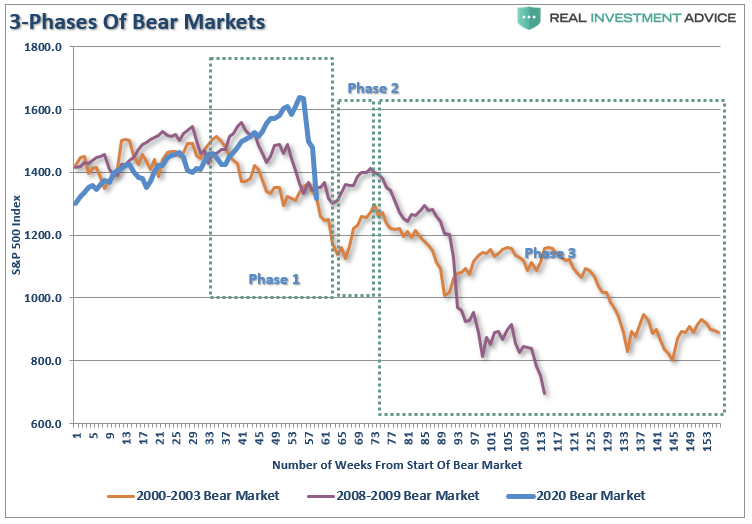
In a recent post, I discussed the “3-stages of a bear market.” To wit:
Bear markets have three stages – sharp down, reflexive rebound and a drawn-out fundamental downtrend
Bear markets often START with a sharp and swift decline.
After this decline, there is an oversold bounce that retraces a portion of that decline.
The longer-term decline then continues, at a slower and more grinding pace, as the fundamentals deteriorate.
Dow Theory also suggests that bear markets consist of three down legs with reflexive rebounds in between.
However, the “bear market” is only one-half of a vastly more important concept – the “Full Market Cycle.”
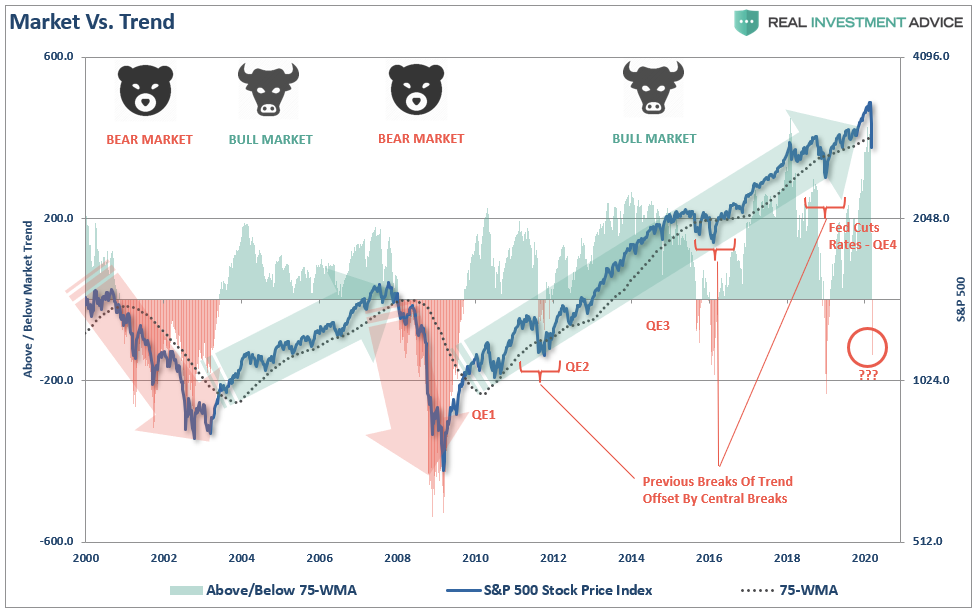
The Full Market Cycle
Over the last decade, the media has focused on the bull market, making an assumption that the current trend would last indefinitely. However, throughout history, bull market cycles make up on one-half of the “full market” cycle. During every “bull market” cycle, the market and economy build up excesses, which must ultimately be reversed through a market reversion and economic recession. In the other words, as Sir Issac Newton discovered:
“What goes up, must come down.”
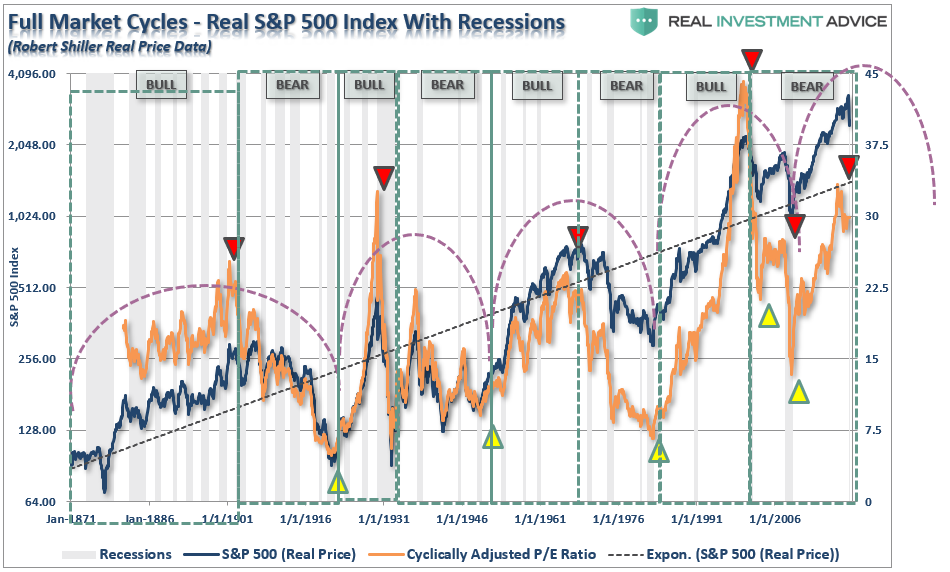
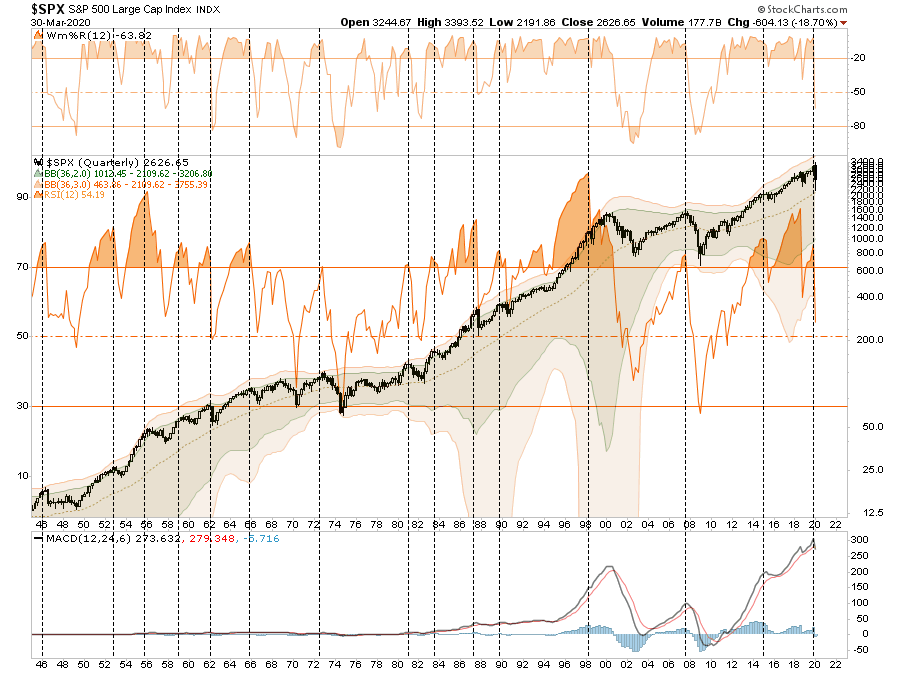
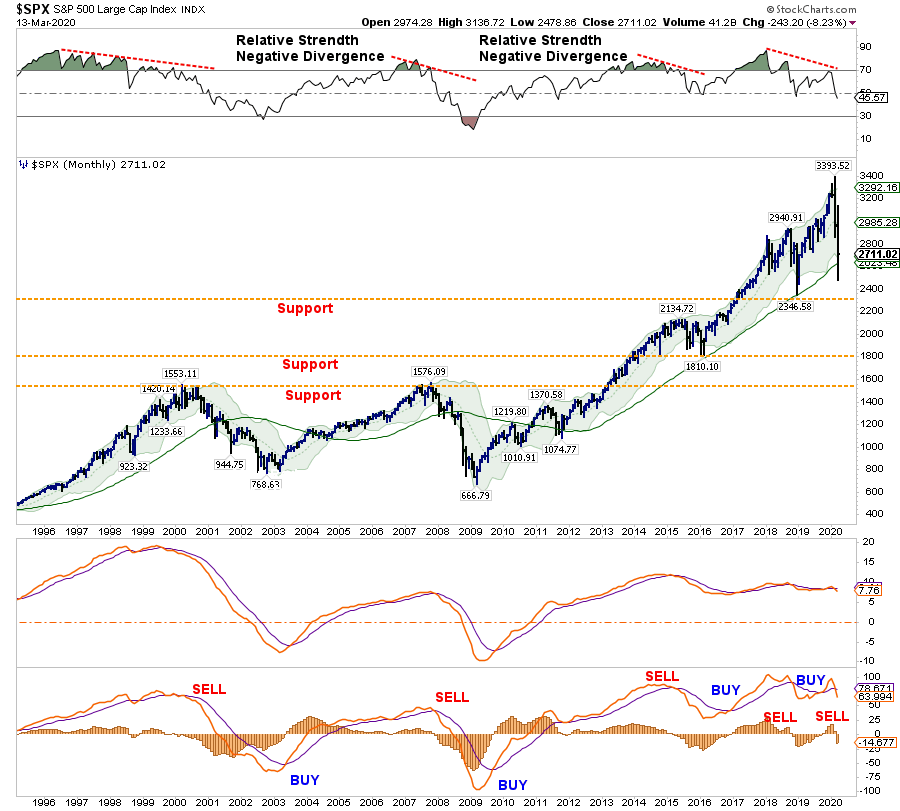
The chart below shows the full market cycles over time. Since the current “full market” cycle is yet to be completed, I have drawn a long-term trend line with the most logical completion point of the current cycle.
[Note:I am not stating the markets are about to crash to the 1600 level on the S&P 500. I am simply showing where the current uptrend line intersects with the price. The longer that it takes for the markets to mean revert, the higher the intersection point will be. Furthermore, the 1600 level is not out of the question either. Famed investor Jack Bogle stated that over the next decade we are likely to see two more 50% declines. A 50% decline from the all-time highs would put the market at 1600.]
As I have often stated, I am not bullish or bearish. My job as a portfolio manager is simple; invest money in a manner that creates returns on a short-term basis, but reduces the possibility of catastrophic losses, which wipe out years of growth.
Nobody tends to believe that philosophy until the markets wipe about 30% of portfolio values in a month.
The 4-Phases
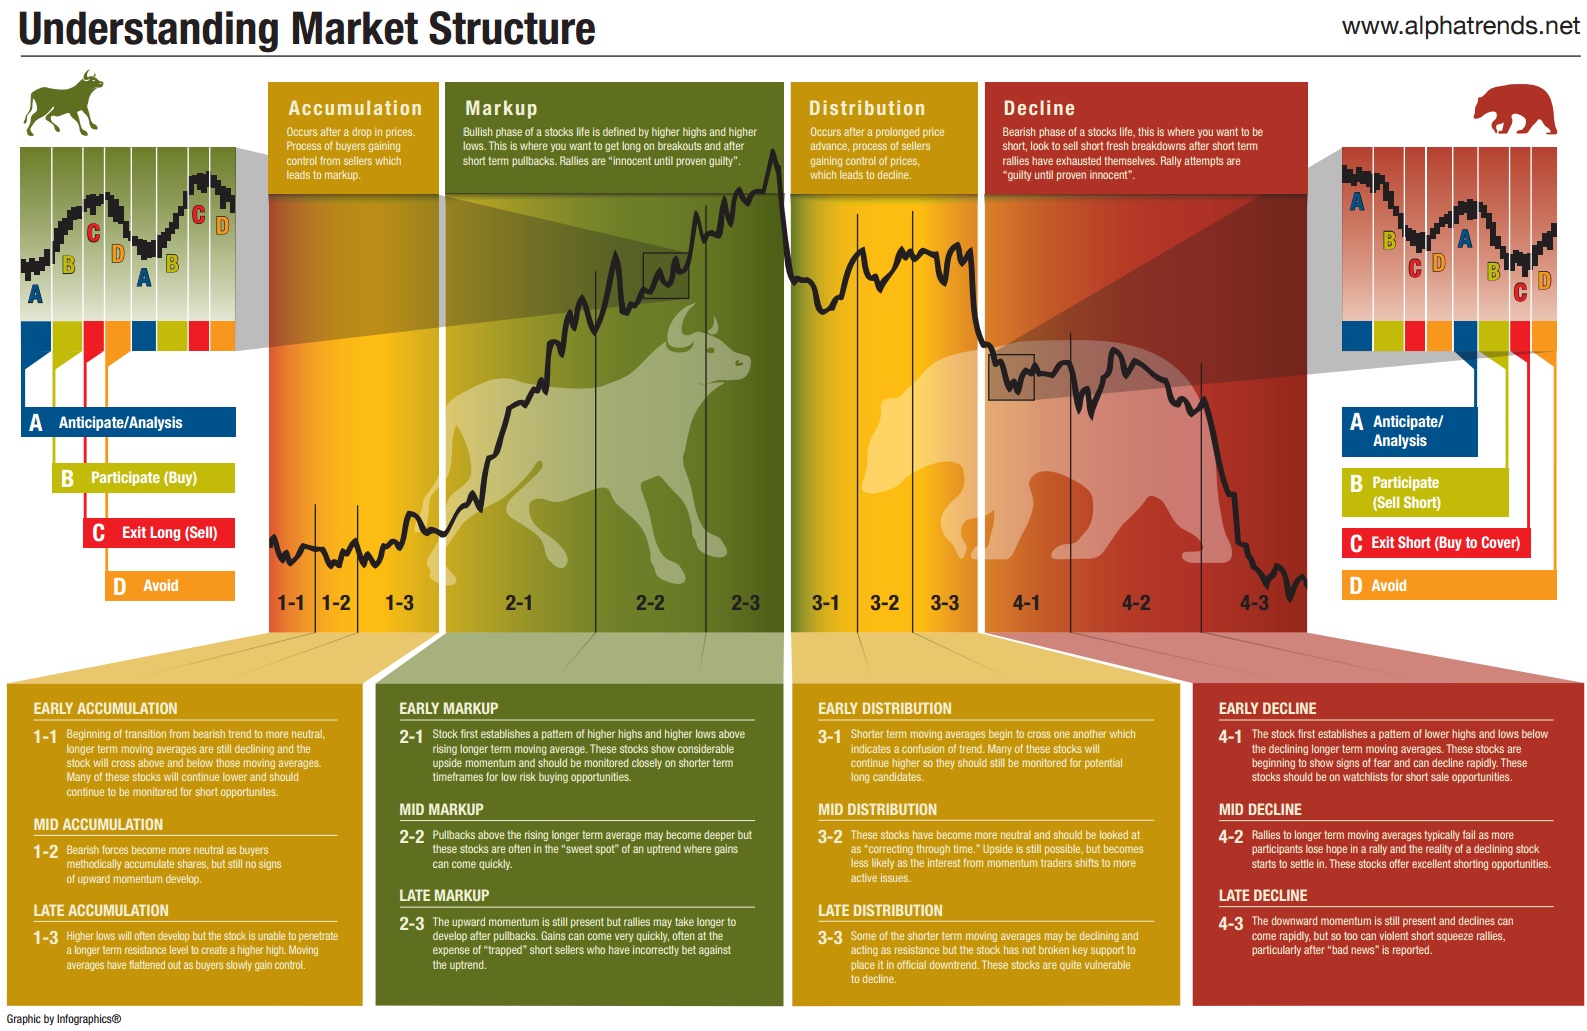
AlphaTrends previously put together an excellent diagram laying out the 4-phases of the full-market cycle. To wit:
“Is it possible to time the market cycle to capture big gains? Like many controversial topics in investing, there is no real professional consensus on market timing. Academics claim that it’s not possible, while traders and chartists swear by the idea.
The following infographic explains the four important phases of market trends, based on the methodology of the famous stock market authority Richard Wyckoff. The theory is that the better an investor can identify these phases of the market cycle, the more profits can be made on the ride upwards of a buying opportunity.”
So, the question to answer, obviously, is:
“Where are we now?”
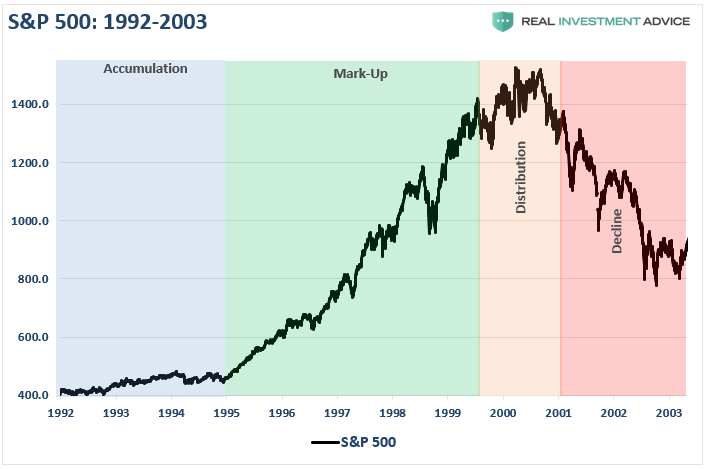
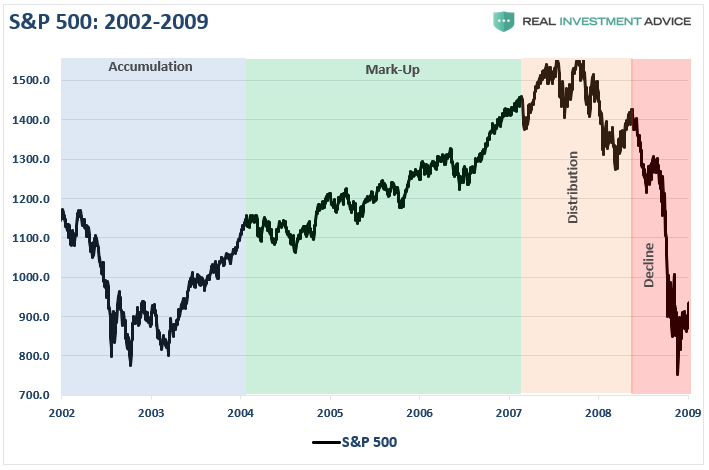
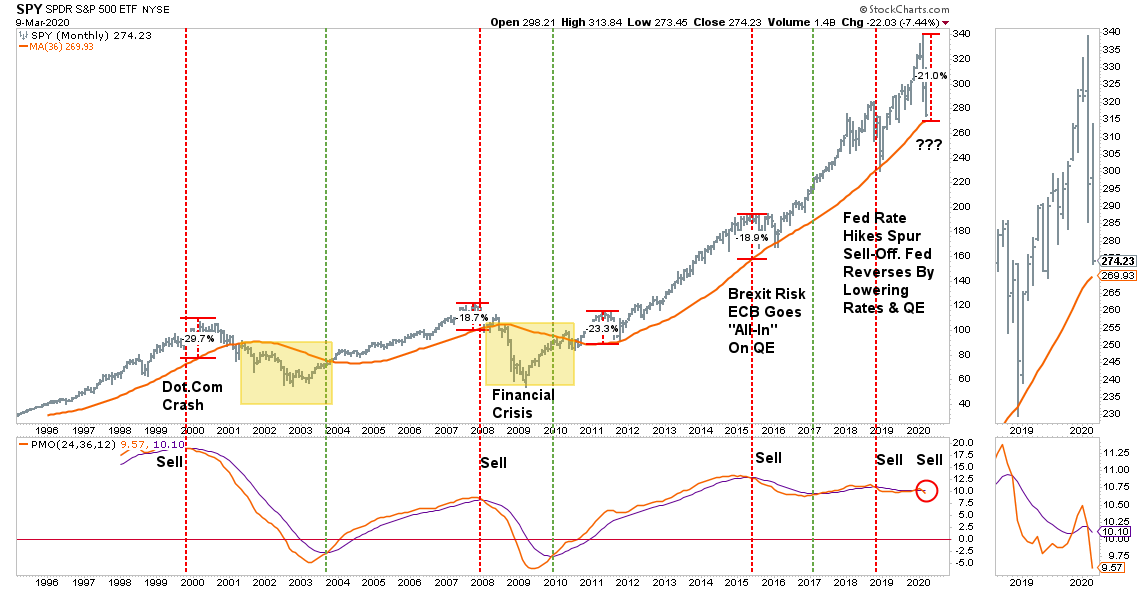
Let’s take a look at the past two full-market cycles, using Wyckoff’s methodology, as compared to the current post-financial-crisis half-cycle. While actual market cycles will not exactly replicate the chart above, you can clearly see Wyckoff’s theory in action.
1992-2003
The accumulation phase, following the 1991 recessionary environment, was evident as it preceded the “internet trading boom” and the rise of the “dot.com” bubble from 1995-1999. As I noted previously:
“Following the recession of 1991, the Federal Reserve drastically lowered interest rates to spur economic growth. However, the two events which laid the foundation for the ‘dot.com’ crisis was the rule-change which allowed the nation’s pension funds to own equities and the repeal of Glass-Steagall, which unleashed Wall Street upon a nation of unsuspecting investors.
The major banks could now use their massive balance sheet to engage in investment-banking, market-making, and proprietary trading. The markets exploded as money flooded the financial markets. Of course, since there were not enough ‘legitimate’ deals to fill demand and Wall Street bankers are paid to produce deals, Wall Street floated any offering it could despite the risk to investors.”
The distribution phase became evident in early-2000 as stocks began to struggle.
Names like Enron, WorldCom, Global Crossing, Lucent Technologies, Nortel, Sun Micro, and a host of others, are “ghosts of the past.” Importantly, they are the relics of an era the majority of investors in the market today are unaware of, but were the poster children for the “greed and excess” of the preceding bull market frenzy.
As the distribution phase gained traction, it is worth remembering the media and Wall Street were touting the continuation of the bull market indefinitely into the future.
Then, came the decline.
2003-2009
Following the “dot.com” crash, investors had all learned their lessons about the value of managing risk in portfolios, not chasing returns, and focusing on capital preservation as the core for long-term investing.
Okay. Not really.
It took about 27-minutes for investors to completely forget about the previous pain of the bear market and jump headlong back into the creation of the next bubble leading to the “financial crisis.”
During the mark-up phase, investors once again piled into leverage. This time not just into stocks, but real estate, as well as Wall Street, found a new way to extract capital from Main Street through the creation of exotic loan structures. Of course, everything was fine as long as interest rates remained low, but as with all things, the “party eventually ends.”
Once again, during the distribution phase of the market, the analysts, media, Wall Street, and rise of bloggers, all touted “this time was different.” There were “green shoots,” it was a “Goldilocks economy,” and there was “no recession in sight.”
They were disastrously wrong.
Sound familiar?
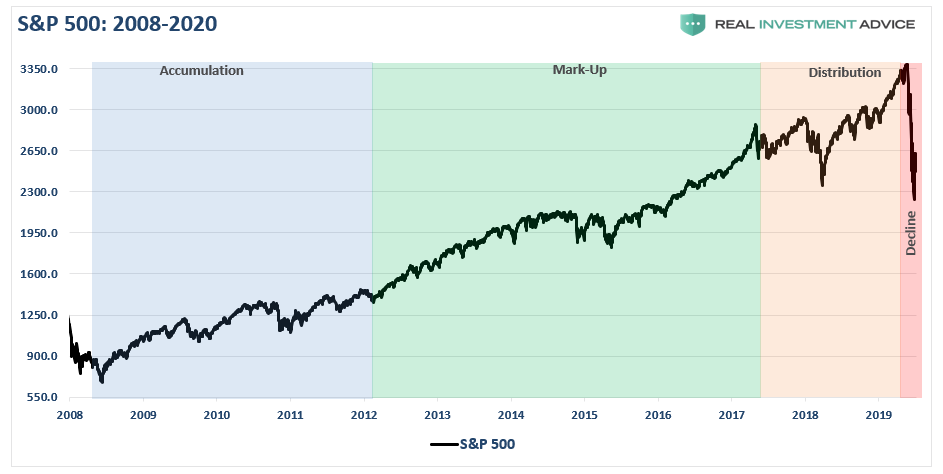
2009-Present
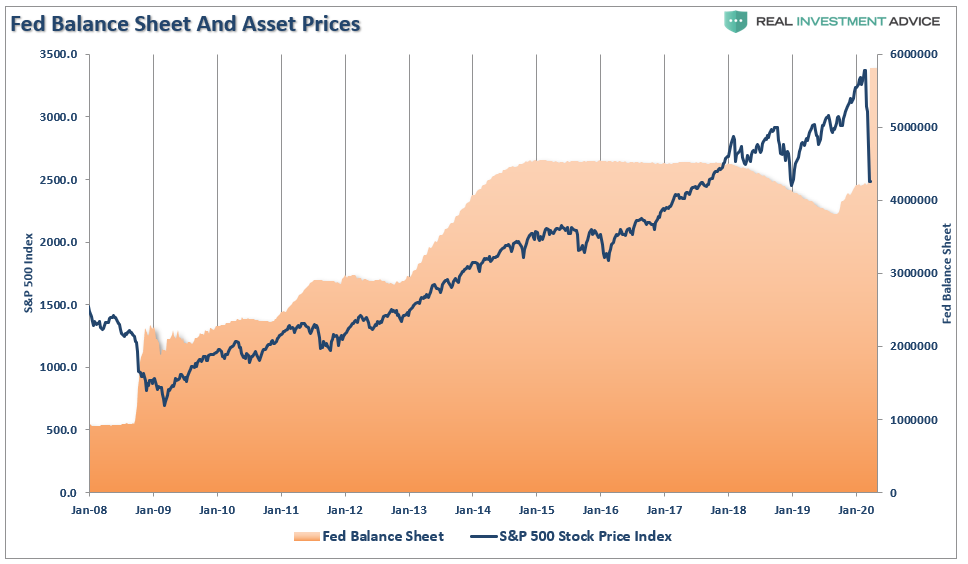
So, here we are, a decade into the current economic recovery and a market that has risen steadily on the back of excessively accommodative monetary policy and massive liquidity injections by Central Banks globally.
Once again, due to the length of the “mark up” phase, most investors today have once again forgotten the “ghosts of bear markets past.”
Despite a year-long distribution in the market, the same messages seen at previous market peaks were steadily hitting the headlines: “there is no recession in sight,” “the bull market is cheap” and “this time is different because of Central Banking.”
Well, as we warned more than once, all that was required was an “exogenous” event, which would spark a credit-event in an overly leveraged, overly extended, and overly bullish market. The “virus” was that exogenous event.
Lost And Found
There is a sizable contingent of investors, and advisors, today who have never been through a real bear market. After a decade long bull-market cycle, fueled by Central Bank liquidity, it is understandable why mainstream analysis believed the markets could only go higher. What was always a concern to us was the rather cavalier attitude they took about the risk.
“Sure, a correction will eventually come, but that is just part of the deal.”
As we repeatedly warned, what gets lost during bull cycles, and is always found in the most brutal of fashions, is the devastation caused to financial wealth during the inevitable decline. It isn’t just the loss of financial wealth, but also the loss of employment, defaults, and bankruptcies caused by the coincident recession.
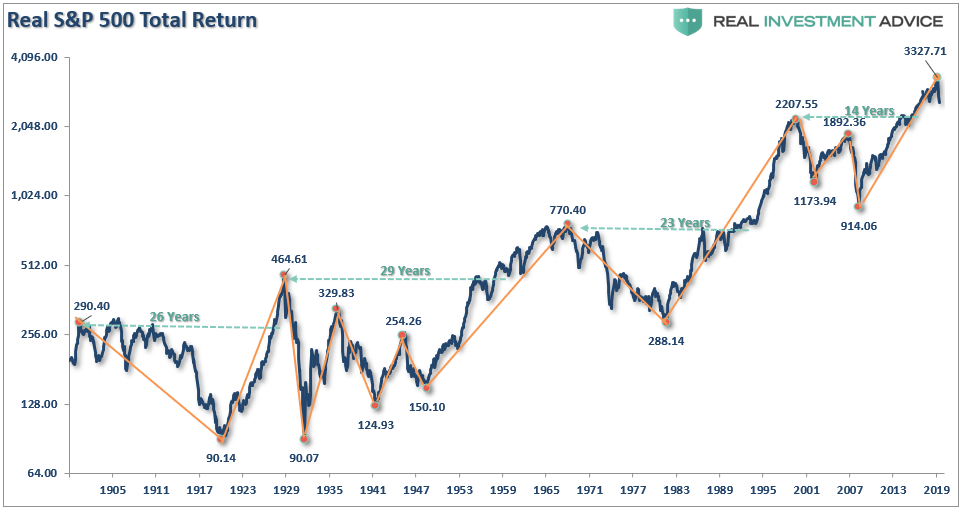
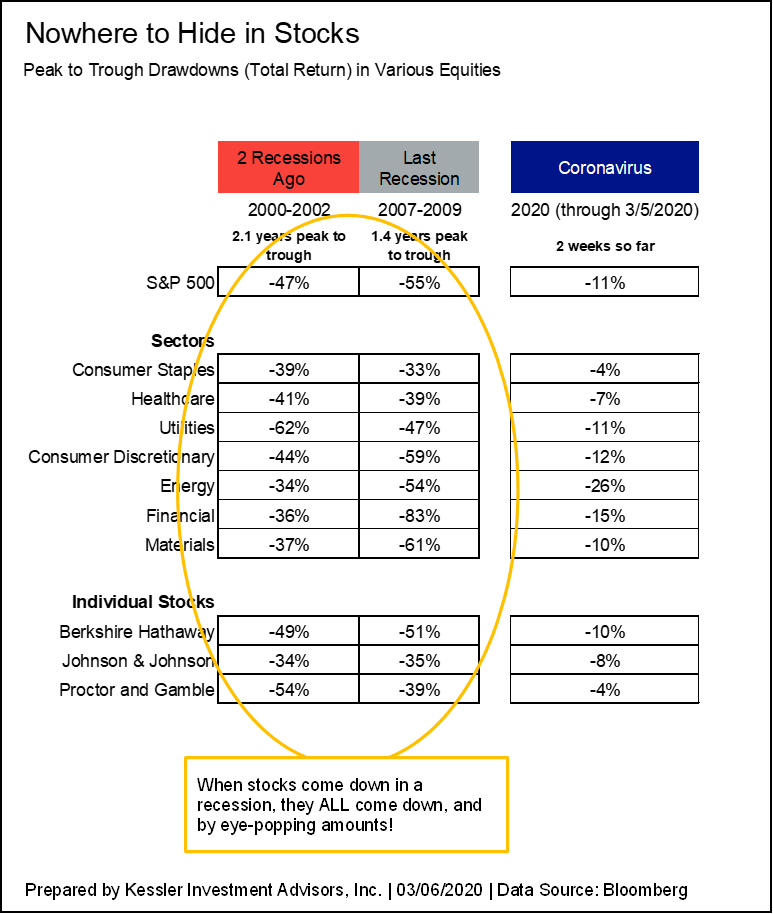
This is the story told by the S&P 500 inflation-adjusted total return index. The chart shows all of the measurement lines for all the previous bull and bear markets, along with the number of years required to get back to even.
What you should notice is that in many cases bear markets wiped out essentially all or a very substantial portion of the previous bull market advance.
There are many signs suggesting the current Wyckoff cycle has entered into its fourth, and final stage. Whether, or not, the current decline phase is complete, is the question we are all working on answering now.
Bear market cycles are rarely ended in a month. While there is a lot of “hope” the Fed’s flood of liquidity can arrest the market decline, there is still a tremendous amount of economic damage to contend with over the months to come.
In the end, it does not matter IF you are “bullish” or “bearish.”What matters, in terms of achieving long-term investment success, is not necessarily being “right” during the first half of the cycle, but by not being “wrong” during the second half.
Previous Employment Concerns Becoming An Ugly Reality
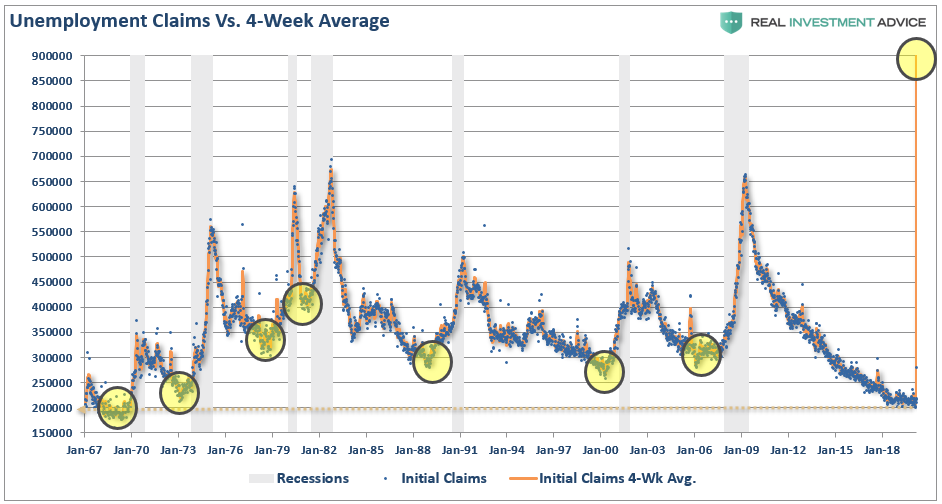
Last week, we saw the first glimpse of the employment fallout caused by the shutdown of the economy due to the virus. To wit:
“On Thursday, initial jobless claims jumped by 3.3 million. This was the single largest jump in claims ever on record. The chart below shows the 4-week average to give a better scale.”
This number will be MUCH worse when claims are reported later this morning, as many individuals were slow to file claims, didn’t know how, and states were slow to report them.
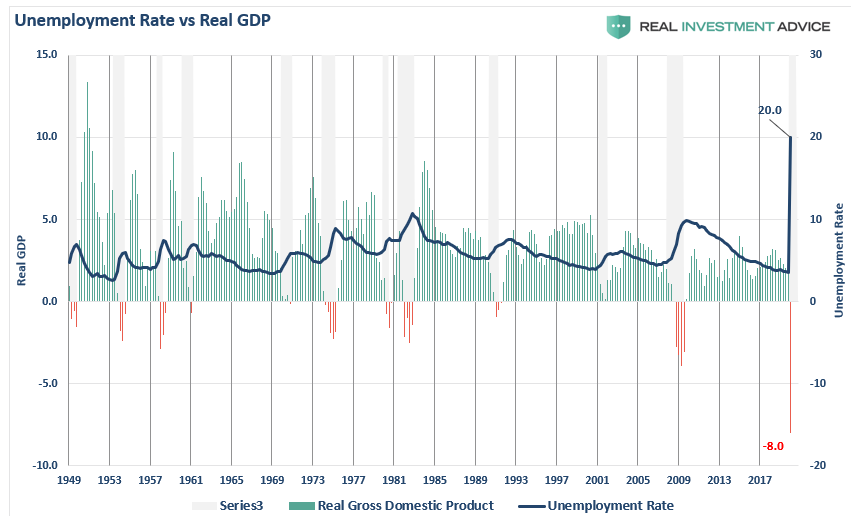
The importance is that unemployment rates in the U.S. are about to spike to levels not seen since the “Great Depression.” Based on the number of claims being filed, we can estimate that unemployment will jump to 15-20% over the next quarter as economic growth slides 8%, or more. (I am probably overly optimistic.)
The erosion in employment will lead to a sharp deceleration in economic and consumer confidence, as was seen Tuesday in the release of the Conference Board’s consumer confidence index, which plunged from 132.6 to 120 in March.
This is a critical point. Consumer confidence is the primary factor of consumptive behaviors, which is why the Federal Reserve acted so quickly to inject liquidity into the financial markets. While the Fed’s actions may prop up financial markets in the short-term, it does little to affect the most significant factor weighing on consumers – their jobs.
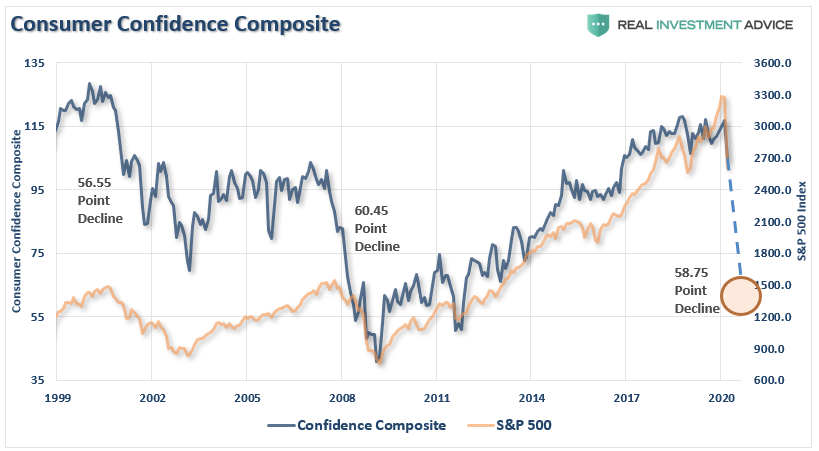
The chart below is our “composite” confidence index, which combines several confidence surveys into one measure. Notice that during each of the previous two bear market cycles, confidence dropped by an average of 58 points.
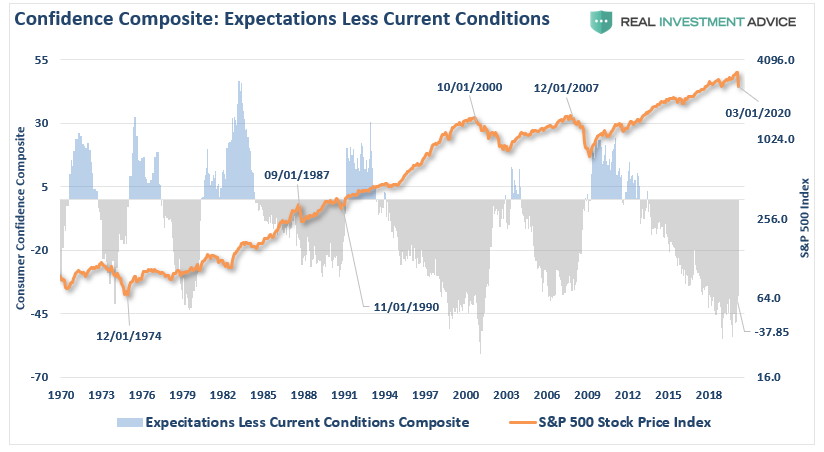
With consumer confidence just starting its reversion from high levels, it suggests that as job losses rise, confidence will slide further, putting further pressure on asset prices. Another way to analyze confidence data is to look at the composite consumer expectations index minus the current situation index in the reports.
Similarly, given we have only started the reversion process, bear markets end when deviations reverse. The differential between expectations and the current situation, as you can see below, is worse than the last cycle, and only slightly higher than before the “dot.com” crash.
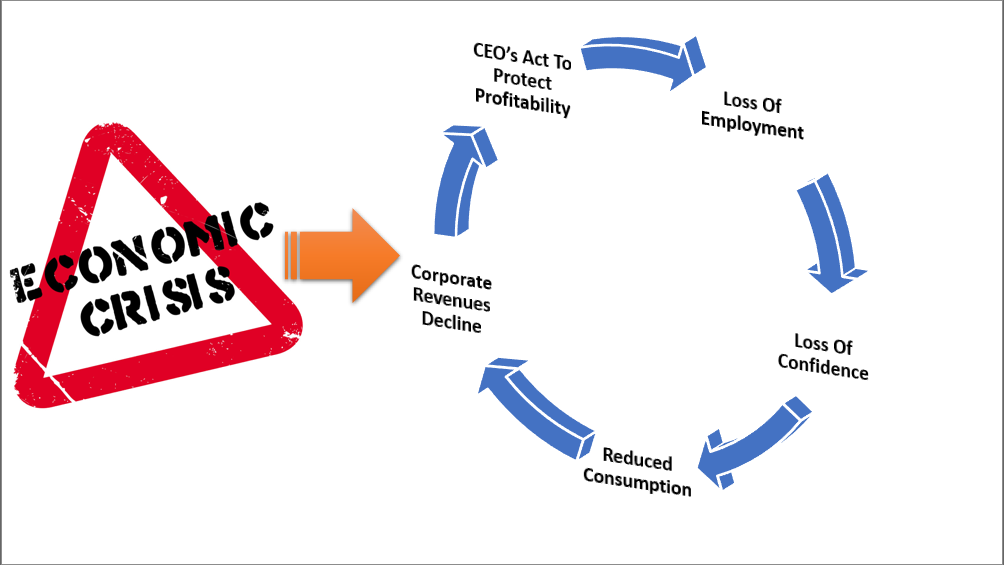
If you are betting on a fast economic recovery, I wouldn’t.
There is a fairly predictable cycle, starting with CEO’s moving to protect profitability, which gets worked through until exhaustion is reached.
As unemployment rises, we are going to begin to see the faults in the previous employment numbers that I have repeatedly warned about over the last 18-months. To wit:
“There is little argument the streak of employment growth is quite phenomenal and comes amid hopes the economy is beginning to shift into high gear. But while most economists focus at employment data from one month to the next for clues as to the strength of the economy, it is the ‘trend’ of the data, which is far more important to understand.”
That “trend” of employment data has been turning negative since President Trump was elected, which warned the economy was actually substantially weaker than headlines suggested. More than once, we warned that an “unexpected exogenous event” would exposure the soft-underbelly of the economy.
The virus was just such an event.
While many economists and media personalities are expecting a “V”-shaped recovery as soon as the virus passes, the employment data suggests an entirely different outcome.
The chart below shows the peak annual rate of change for employment prior to the onset of a recession. The current cycle peaked at 2.2% in 2015, and has been on a steady decline ever since. At 1.3%, which predated the virus, it was the lowest level ever preceding a recessionary event. All that was needed was an “event” to start the dominoes falling. When we see the first round of unemployment data, we are likely to test the lows seen during the financial crisis confirming a recession has started.
No Recession In 2020?
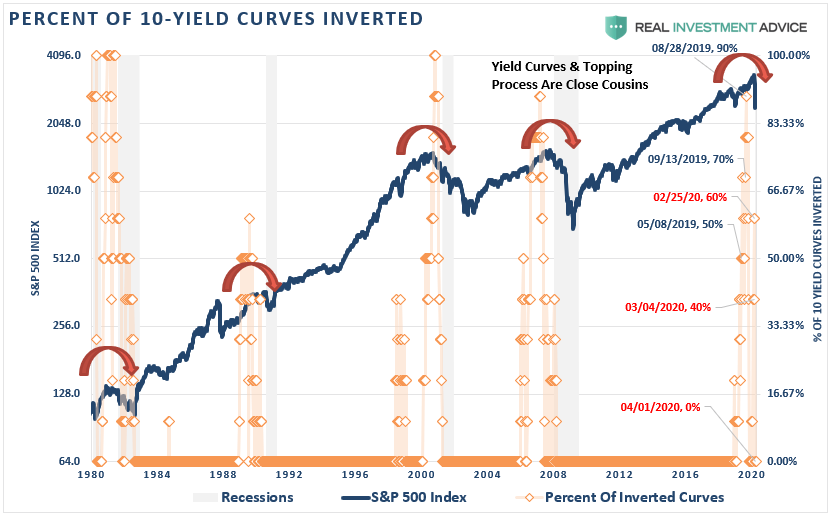
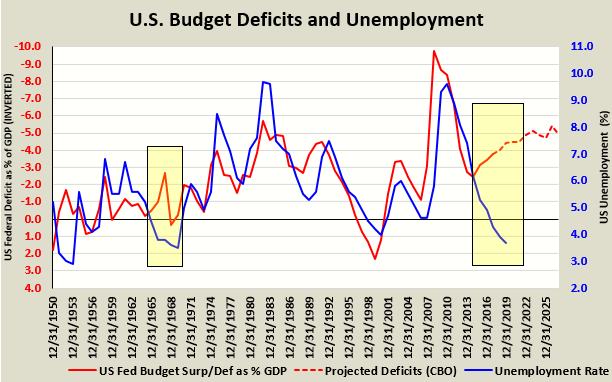
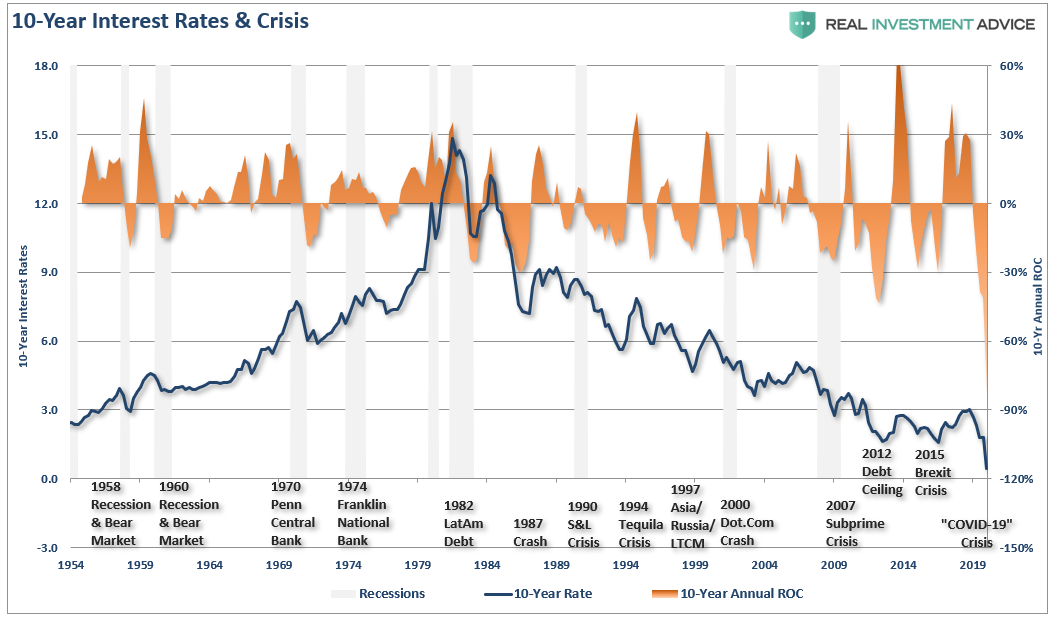
It is worth noting that NO mainstream economists, or mainstream media, were predicting a recession in 2020. However, as we noted in 2019, the inversion of the “yield curve,” predicted exactly that outcome.
“To CNBC’s point, based on this lagging, and currently unrevised, economic data, there is ‘NO recession in sight,’ so you should be long equities, right?
Which indicator should you follow? The yield curve is an easy answer.
While everybody is ‘freaking out’ over the ‘inversion,’it is when the yield-curve ‘un-inverts’ that is the most important.
The chart below shows that when the Fed is aggressively cutting rates, the yield curve un-inverts as the short-end of the curve falls faster than the long-end. (This is because money is leaving ‘risk’ to seek the absolute ‘safety’ of money markets, i.e. ‘market crash.’)”
I have dated a few of the key points of the “inversion of the curve.” As of today, the yield-curve is now fully un-inverted, denoting a recession has started.
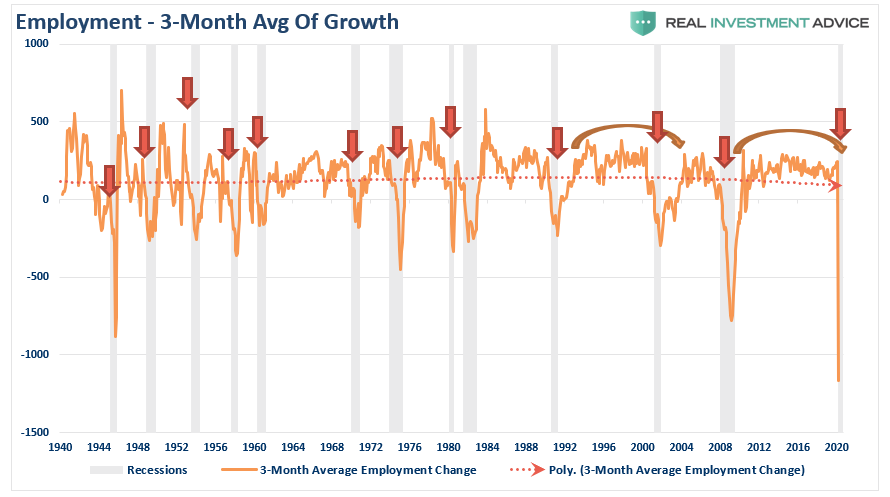
While recent employment reports were slightly above expectations, the annual rate of growth has been slowing. The 3-month average of the seasonally-adjusted employment report, also confirms that employment was already in a precarious position and too weak to absorb a significant shock. (The 3-month average smooths out some of the volatility.)
What we will see in the next several employment reports are vastly negative numbers as the economy unwinds.
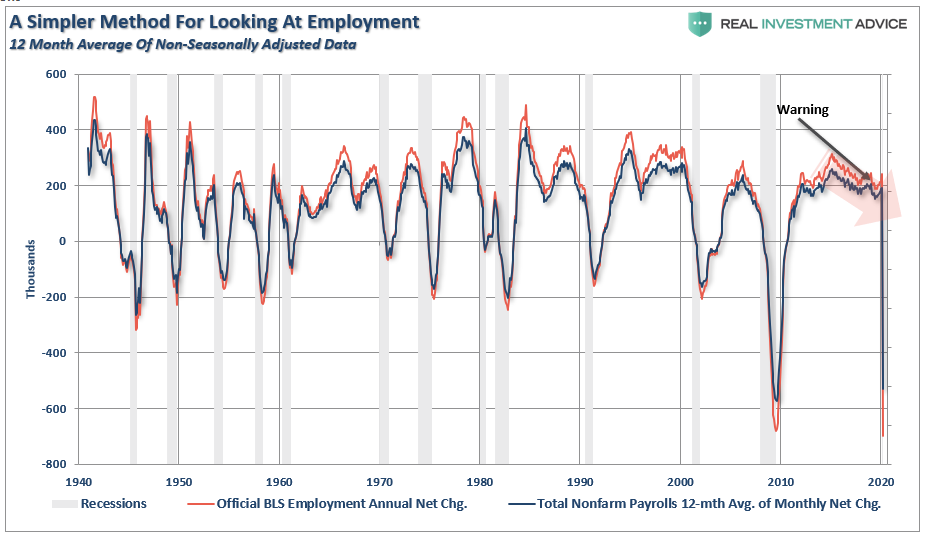
Lastly, while the BLS continually adjusts and fiddles with the data to mathematically adjust for seasonal variations,the purpose of the entire process is to smooth volatile monthly data into a more normalized trend. The problem, of course, with manipulating data through mathematical adjustments, revisions, and tweaks, is the risk of contamination of bias.
We previously proposed a much simpler method to use for smoothing volatile monthly data using a 12-month moving average of the raw data as shown below.
Notice that near peaks of employment cycles the BLS employment data deviates from the 12-month average, or rather “overstates” the reality. However, as we will now see to be the case, the BLS data will rapidly reconnect with 12-month average as reality emerges.
Sometimes, “simpler” gives us a better understanding of the data.
Importantly, there is one aspect to all the charts above which remains constant. No matter how you choose to look at the data, peaks in employment growth occur prior to economic contractions, rather than an acceleration of growth.
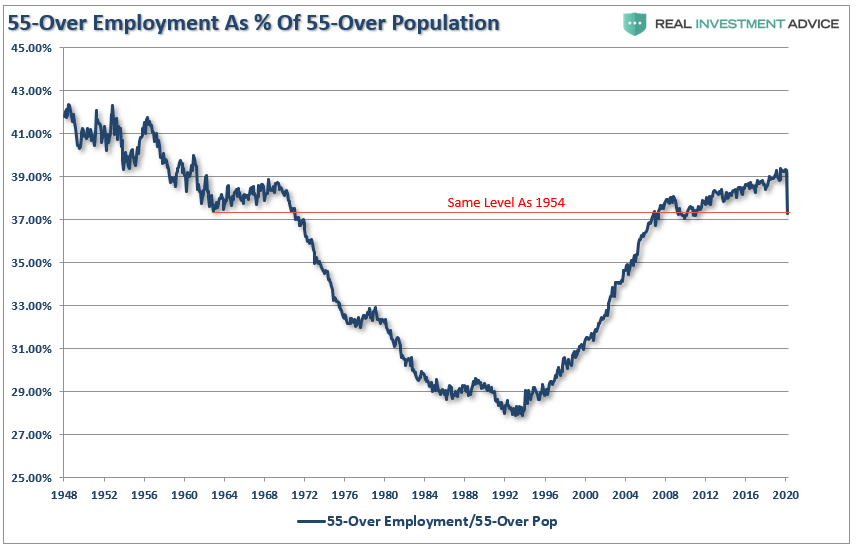
“Okay Boomer”
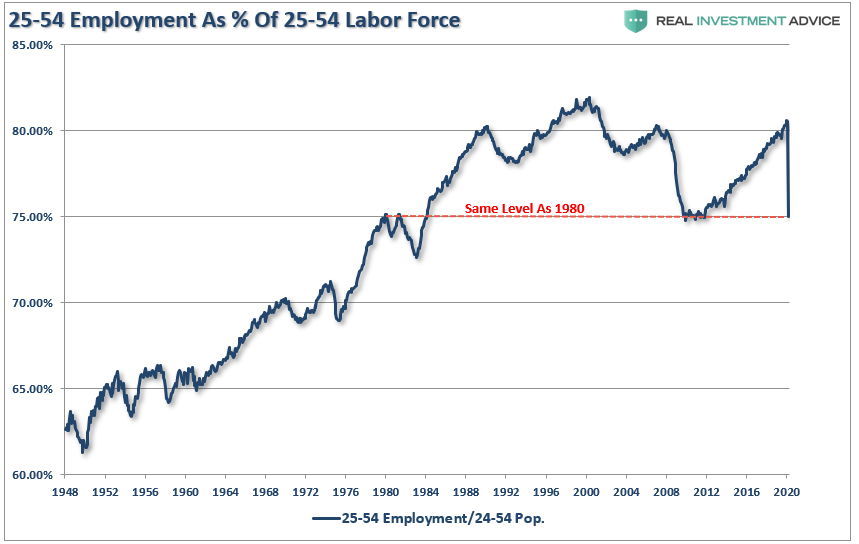
Just as “baby boomers” were finally getting back to the position of being able to retire following the 2008 crash, the “bear market” has once again put those dreams on hold. Of course, there were already more individuals over the age of 55, as a percentage of that age group, in the workforce than at anytime in the last 50-years. However, we are likely going to see a very sharp drop in those numbers as “forced retirement” will surge.
The group that will to be hit the hardest are those between 25-54 years of age. With more than 15-million restaurant workers being terminated, along with retail, clerical, leisure, and hospitality workers, the damage to this demographic will be the heaviest.
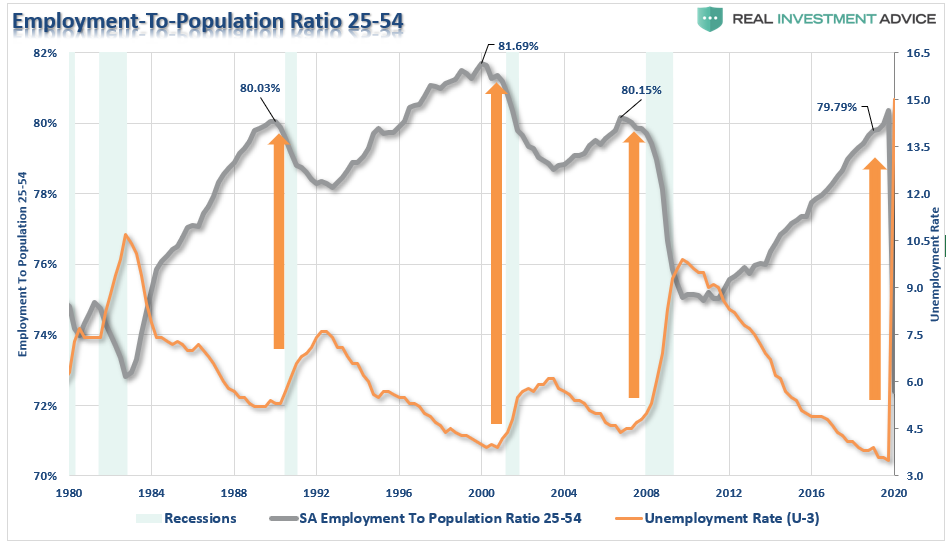
There is a decent correlation between surges in the unemployment rate and the decline in the labor-force participation rate of the 25-54 age group. Given the expectation of a 15%, or greater, unemployment rate, the damage to this particular age group is going to be significant.
Unfortunately, the prime working-age group of labor force participants had only just returned to pre-2008 levels, and the same levels seen previously in 1988. Unfortunately, it may be another decade before we see those employment levels again.
Why This Matters
The employment impact is going to felt for far longer, and will be far deeper, than the majority of the mainstream media and economists expect. This is because they are still viewing this as a “singular” problem of a transitory virus.
It isn’t.
The virus was simply the catalyst which started the unwind of a decade-long period of debt accumulation and speculative excesses. Businesses, both small and large, will now go through a period of “culling the herd,” to lower operating costs and maintain profitability.
There are many businesses that will close, and never reopen. Most others will cut employment down to the bone and will be very slow to rehire as the economy begins to recover. Most importantly, wage growth was already on the decline, and will be cut deeply in the months to come.
Lower wage growth, unemployment, and a collapse in consumer confidence is going to increase the depth and duration of the recession over the months to come. The contraction in consumption will further reduce revenues and earnings for businesses which will require a deeper revaluation of asset prices.
“Every financial crisis, market upheaval, major correction, recession, etc. all came from one thing – an exogenous event that was not forecast or expected.
This is why bear markets are always vicious, brutal, devastating, and fast. It is the exogenous event, usually credit-related, which sucks the liquidity out of the market, causing prices to plunge. As prices fall, investors begin to panic-sell driving prices lower which forces more selling in the market until, ultimately, sellers are exhausted.
It is the same every time.”
Over the last several years, investors have insisted the markets were NOT in a bubble. We reminded them that everyone thought the same in 1999 and 2007.
Throughout history, financial bubbles have only been recognized in hindsight when their existence becomes “apparently obvious” to everyone. Of course, by that point is was far too late to be of any use to investors and the subsequent destruction of invested capital.
It turned out, “this time indeed was not different.” Only the catalyst, magnitude, and duration was.
Pay attention to employment and wages. The data suggests the current “bear market” cycle has only just begun.
Shedlock: Recession Will Be Deeper Than The Great Financial Crisis
Economists at IHS Markit downgraded their economic forecast to a deep recession.
Our interim global forecast is the second prepared in March and is much more pessimistic than our 17 March regularly scheduled outlook. It is based on major downgrades to forecasts of the US economy and oil prices. The risks remain overwhelmingly on the downside and further downgrades are almost assured.
IHS Markit now believes the COVID-19 recession will be deeper than the one following the global financial crisis in 2008-09. Real world GDP should plunge 2.8% in 2020 compared with a drop of 1.7% in 2009. Many key economies will see double-digit declines (at annualized rates) in the second quarter, with the contraction continuing into the third quarter.
It will likely take two to three years for most economies to return to their pre-pandemic levels of output. More troubling is the likelihood that, because of the negative effects of the uncertainty associated with the virus on capital spending, the path of potential GDP will be lower than before. This happened in the wake of the global financial crisis.
Six Key Points
Based on recent data and developments, IHS Markit has slashed the US 2020 forecast to a contraction of 5.4%.
Because of the deep US recession and collapsing oil prices, IHS Markit expects Canada’s economy to contract 3.3% this year, before seeing a modest recovery in 2021.
Europe, where the number of cases continues to grow rapidly and lockdowns are pervasive, will see some of the worst recessions in the developed world, with 2020 real GDP drops of approximately 4.5% in the eurozone and UK economies. Italy faces a decline of 6% or more. The peak GDP contractions expected in the second quarter of 2020 will far exceed those at the height of the global financial crisis.
Japan was already in recession, before the pandemic. The postponement of the summer Tokyo Olympics will make the downturn even deeper. IHS Markit expects a real GDP contraction of 2.5% this year and a very weak recovery next year.
China’s economic activity is expected to have plummeted at a near-double-digit rate in the first quarter. It will then recover sooner than other countries, where the spread of the virus has occurred later. IHS Markit predicts growth of just 2.0% in 2020, followed by a stronger-than-average rebound in 2021, because of its earlier recovery from the pandemic.
Emerging markets growth will also be hammered. Not only are infection rates rising rapidly in key economies, such as India, but the combination of the deepest global recession since the 1930s, plunging commodity prices, and depreciating currencies (compounding already dangerous debt burdens) will push many of these economies to the breaking point.
No V-Shaped Recovery
With that, Markit came around to my point of view all along. Those expecting a V-shaped recovery are sadly mistaken.
I have been amused by Goldman Sachs and Morgan Stanley predictions of a strong rebound in the third quarter.
It’s a list of projections from an excellent must see video presentation by Jim Bianco. I added my own thoughts on the key points.
The bottom line is don’t expect a v-shaped recovery. We will not return to the old way of doing business.
Globalization is not over, but the rush to globalize everything is. This will impact earnings for years to come.
Finally, stimulus checks are on the way, but there will be no quick return to buying cars, eating out, or traveling as much.
Boomers who felt they finally had enough retirement money just had a quarter of it or more wiped out.
It will take a long time, if ever, for the same sentiment to return. Spending will not recover. Boomers will die first, and they are the ones with the most money.
Michael Markowski: Embrace The Bear – Next Leg Down Is Coming
Michael Markowski has been involved in the Capital Markets since 1977. He spent the first 15 years of his career in the Financial Services Industry as a Stockbroker, Portfolio Manager, Venture Capitalist, Investment Banker and Analyst. Since 1996 Markowski has been involved in the Financial Information Industry and has produced research, information and products that have been used by investors to increase their performance and reduce their risk. Read more at BullsNBears.com
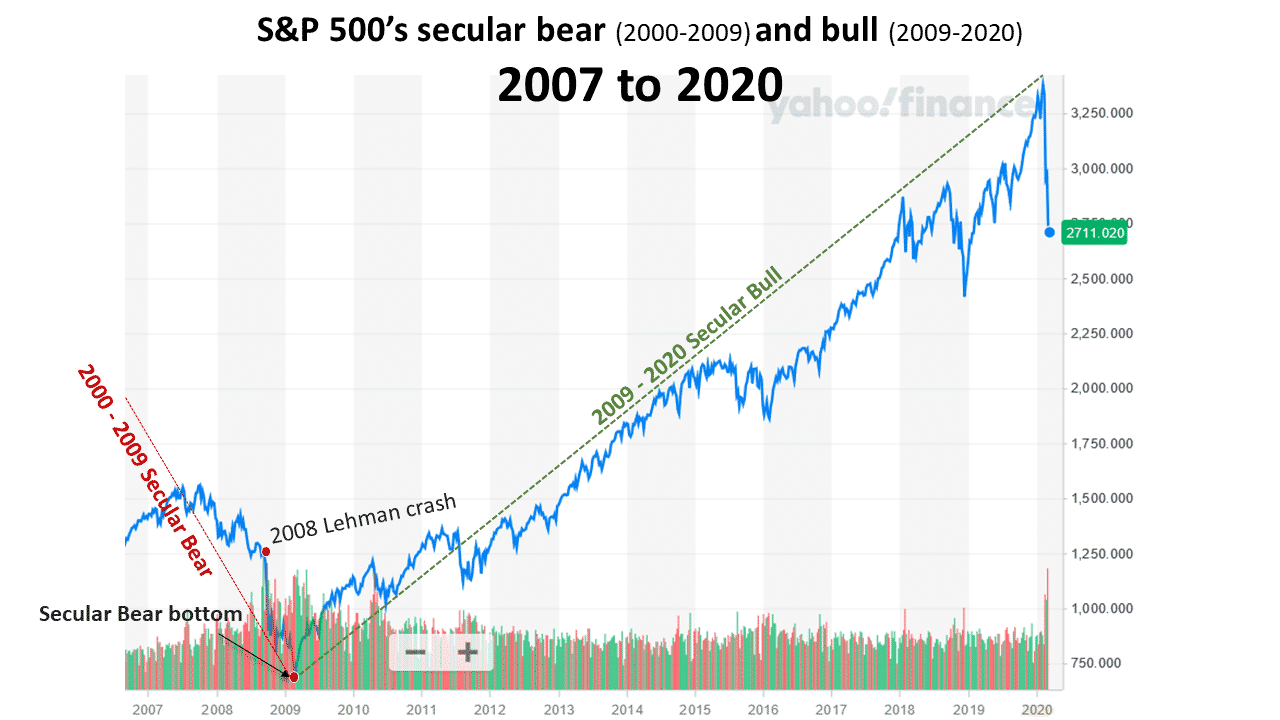
Investors must embrace the bear. A savvy investor or advisor can generate significantly more profits from a secular bear, than a secular bull. It’s also much easier to predict the behavior of a wild and vicious bear than a domesticated bull.
The new 2020 secular bear is the first for which an investor can utilize an inverse ETF (Exchange Traded Fund) to invest in a bear market from start to finish. The share price of an inverse ETF increases when a market goes down. The first inverse ETFs were invented in 2007. The new ETFs enabled investors to make significant profits at the end of the 2000 to 2009 secular bear market. The chart below depicts the gains for the Dow’s inverse ETF before and after Lehman went bankrupt in 2008.
The increased volatility caused by the secular bear can be leveraged by algorithms which had not been utilized in prior bear markets. Two of my algorithms have the potential to produce substantial gains:
Bull & Bear Tracker (BBT)
From April 9, 2018, and through February 29, 2020, the Bull & Bear Tracker (BBT) trend trading algorithm which trades both long and inverse ETFs produced a gain of 77.3% vs. the S&P 500’s 14.9%. March of 2020 will be the BBT’s 9th consecutive profitable month.
The Bull & Bear Tracker thrives on market volatility. The algorithm’s best performance days since the inception of the signals have been when the markets are most volatile.
SCPA (Statistical Crash Probability Analysis)
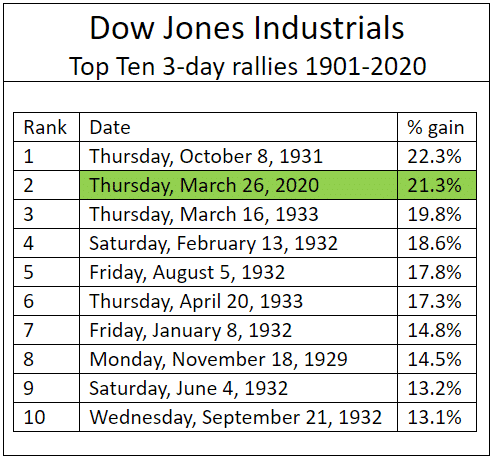
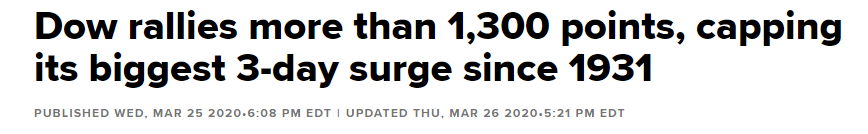
The SCPA is a crash event forecasting algorithm. The algorithm has been very accurate at forecasting the crash of 2020’s events. The SCPA’s forecast that the market had reached a bottom on March 23rd was precisely accurate. From 03/23/20 to 0/3/26/20, the Dow had its biggest one-day gain (11.4%) and three-day percentage gain (21.3%) since 1929 and 1931, respectively. Those investors who purchased the Dow’s long ETF (symbol: DIA) by close of the market on March 23, 2020, after reading “Probability is 87% that market is at interim bottom” which was published during market hours, had a one day gain of 11% at the close of the market on March 24, 2020.
The SCPA’s future event forecasts throughout the life of the crash of 2020 are being utilized to trade long and inverse ETFs until the US markets reach their final bottoms in the fourth quarter of 2022. Had the SCPA and inverse ETFs been available to trade the SCPA’s forecasts in 1929, savvy investors would have made more than 572% from December of 1929 through July of 1932. There were 14 Bear market rallies with average gains of 17%. The rallies were followed by 14 declines which averaged 23%. could have produced average gains of 23% for inverse ETF investors.
Both the Bull & Bear Tracker (BBT) and SCPA complement each other. The BBT predicts market volatility before it increases. The SCPA forecasts the percentage increases for the bear market rallies and the percentage declines from the bear rally highs. My prediction is that the utilization of both of the algorithms will reduce the failed signals ratio for the Bull & Bear Tracker.
Based on the findings from my recently completed empirical research of the Dow’s best rallies from 1901 to 2020, the markets will remain extremely volatile for the foreseeable future.
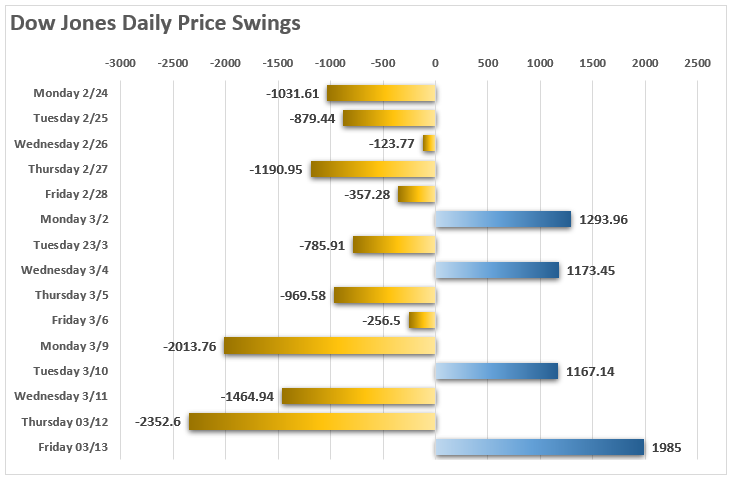
The Truth About The Biggest One Day Jump Since 1933
The Wall Street Journal’s “Dow Soars More Than 11% in Biggest One-Day Jump Since 1933” was inaccurate. It should have read since “1929”. The article should have been about the Dow Jones industrials composite index having its best one day and three-day percentage gains since 1929 and 1931 respectively.
The gain of 21.3% for the Dow’s three-day rally that ended on March 26th was the index’s second best since 1901. The one-day gain of 11.4% on March 24th ranks as the Dow’s fourth best day since 1901. To understand the significance of the error read on.
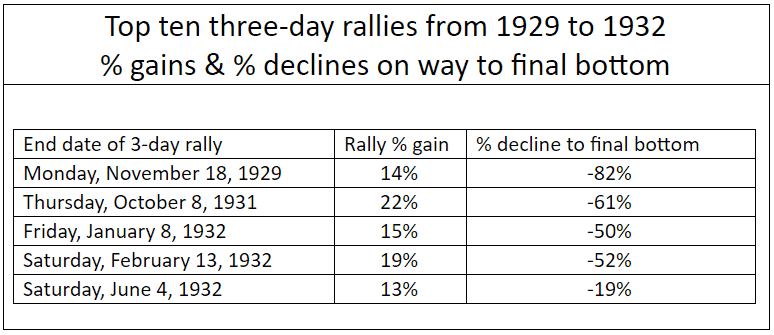
Nine of the top ten three-day percentage gainers occurred during the first four years of the 1929 to 1949 secular bear market. The Five rallies which occurred before the 1929 crash reached its final bottom on July 8, 1932 all failed. Their post rally declines ranged from 19% to 82%.
Six of the 10 biggest daily percentage increases in the table below for the Dow over the last 120 years occurred from 1929 to 1933. There were two 2008 secular bear market rallies, October 13 and 28, 2008 among the top ten one day wonders. The losses for both of the one-day 2008 rallies at the March 2009 were 31.1% and 28.7% respectively.
Of the 100 best percentage gain days for the Dow since 1901, 29 of them occurred between the post 1929 crash and the final July 1932 bottom. From the 1932 bottom to the end of 1933 accounted for an additional 23 of the 100 best days. All of those rallies were profitable. From the low to the end of 1933, the Dow increased by more than 100%. The only other period or year which had concentrated representation in the top 100 was 2008 which had seven.
The Wall Street Journal’s error is significant since 100% of the top 100 best one day rallies from:
October 1929 to July 1932 resulted in significant losses
July 1932 bottom to end of 1933 resulted in significant gains
The error has created a false sense of security for investors and especially for investment professionals, who are aware that after the 1929 crash, the Dow bottomed in 1932. Had the performance for the Dow’s performance cited in the headline been compared to 1929, the context of the article would have been very bearish instead of somewhat bullish.
From my preliminary empirical research findings there were only seven bull market rallies within the top 100 one day percentage gainers. Three of seven in the table below were represented by 1987 and two by 2009.
The three post 1987 “Black Monday’ crash rallies enabled the secular bull which began in 2002 to resume. To understand why it’s not possible for the secular bull which began in 2009 to resume read my two March 2020 articles below. The 1987 crash does not share the genealogy of the Dow 1929, NASDAQ 2000 and the 2020 crashes for the markets of the US, Japan, Germany, Canada, France and South Korea which are now underway.
Based on the findings from my empirical research the probability is 94.4% (17/18) that the Dow 2020’s one day and three-day top ten percentage gainers last week were bear market rallies.
Many are hopeful that the crash which has been underway since February 20, 2020, is just a correction for the continuation of the secular bull market which began in 2009. Based on my just concluded empirical research of the Dow’s best daily and three-day gains and my previous findings from my prior statistical crash probability analysis, the rationale is in place for the markets to continue to crash. My deep fear is that the world is on the verge of a 1930’s style economic depression.
Everyone should take advantage of the Bear market rally that is currently underway to exit the market as soon as possible.
According to the Statistical Crash Probability Analysis (SCPA) forecast the probability is 100% that the relief rally high has either already occurred or will occur by April 8, 2020.
The probability is the same for the markets of the six countries to make new lows by April 30, 2020.
For more about the SCPA click here for access to all of my 2020 crash related articles. To view the SCPA’s very accurate track record for March 2020 click here.
All mutual funds and stocks over $5.00 per share should be liquidated by April 8th. My suggestion is to utilize a methodical approach by liquidating 20% of all holdings per day from April 1st to April 8th.
The SCPA is also forecasting the probability is 100% for the coming attractions from the crash of 2020:
Interim bottom by or before May 4, 2020
At interim bottom market will be 41% to 44% below 2020 highs
Post-crash high before the journey begins to final Q 4 2022 bottom will occur from June 24, 2020 to September 18, 2020.
Post-crash highs to get market to within 17% of 2020 highs.
My only argument against the SCPA’s statistical probability analyses is can the markets get back to above, or even to their March/April 2020 post-crash relief rally highs? The simultaneous crashes in multiple markets for more than one country, let alone six countries, is historically unprecedented.
My hunch is that the damage to the markets and economies of the world’s leading developed countries will be much more severe than the damage caused by the 1929 crash. The relief rally highs could prove to be the post-crash highs.
If that proves to be the case, according to the SCPA the probability is 100% that it will take the markets a minimum of 15 years to get back above the highs already made by the relief rally and longer to get back to their post-crash highs. Additionally, the findings from my extensive research on all of the secular bear markets since 1929 further support the SCPA’s forecast.
There are only three reasons why anyone who is reading my articles would not to sell:
Waiting to get back to break even. It’s against human nature to take losses.
Not wanting to pay capital gains. Securities with gains can be “sold short against the box” to delay a taxable capital gain,
Financial advisor advising otherwise. Beware of the following:
a) An advisor’s largest percentage fee that can be charged is for the amount that an investor has in stocks. If the investor is in cash the advisor can-not charge the fee.
b) The majority of financial advisors are affiliated with big brand name firms including Merrill Lynch, Morgan Stanley, Goldman Sachs and UBS, etc. These advisors have to follow the party line. They do not have the independence to get their clients out of the market even if they wanted to.
c) The financial advisor industry utilizes propaganda to get clients to remain invested during volatile periods. Read “No One Saw It Coming’ – Should You Worry About The 10-Best Days” by Lance Roberts. He is among a few of the independent advisors who I know which had his clients’ 90% out of the market.
Technically Speaking: 5-Questions Bulls Need To Answer Now.
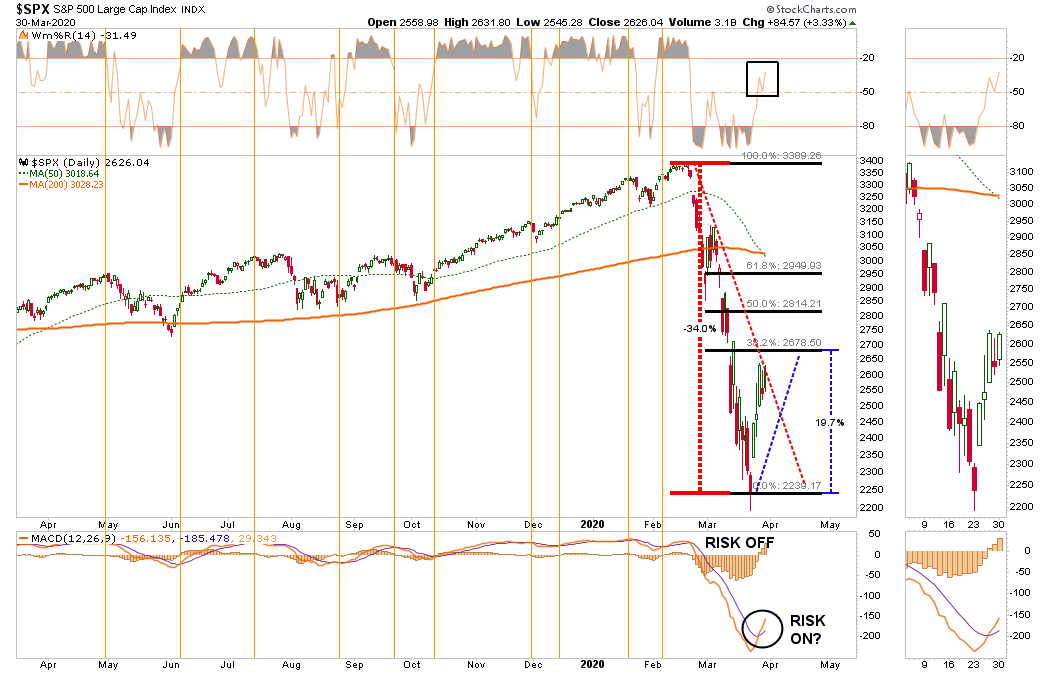
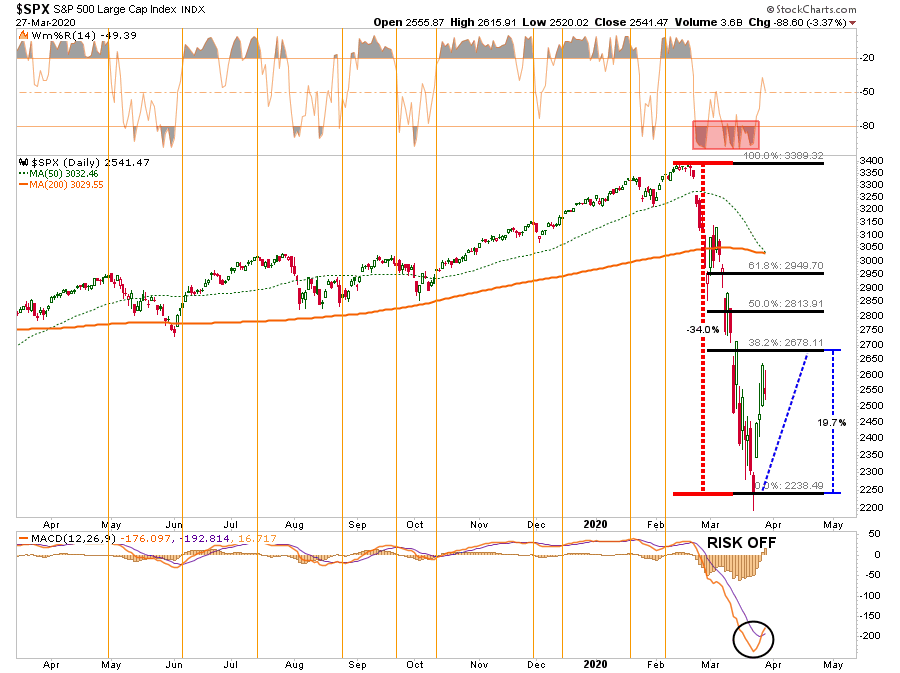
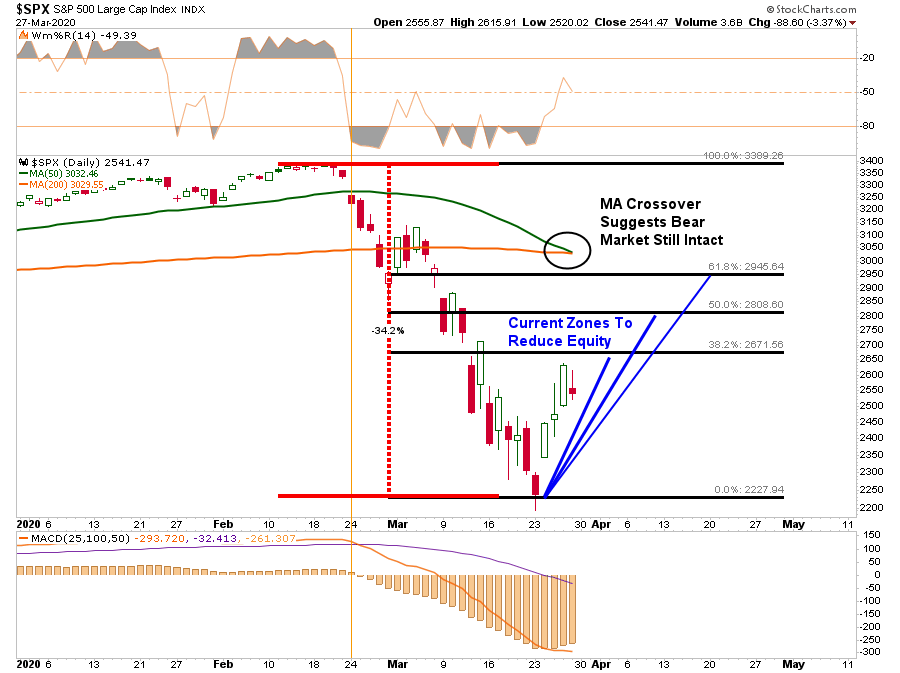
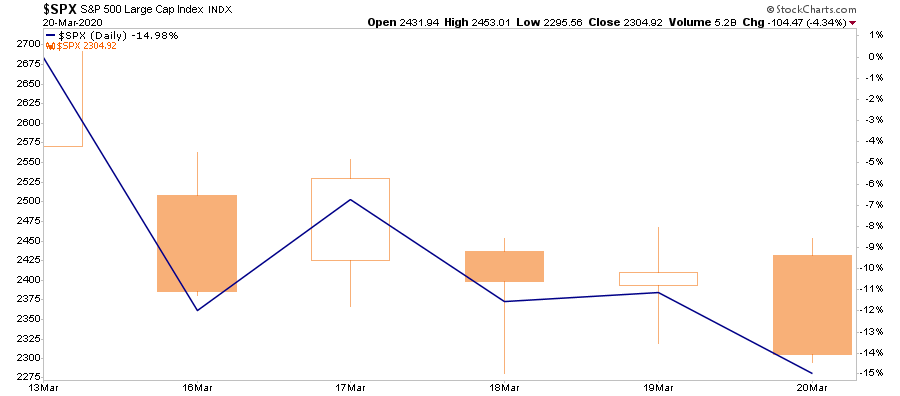
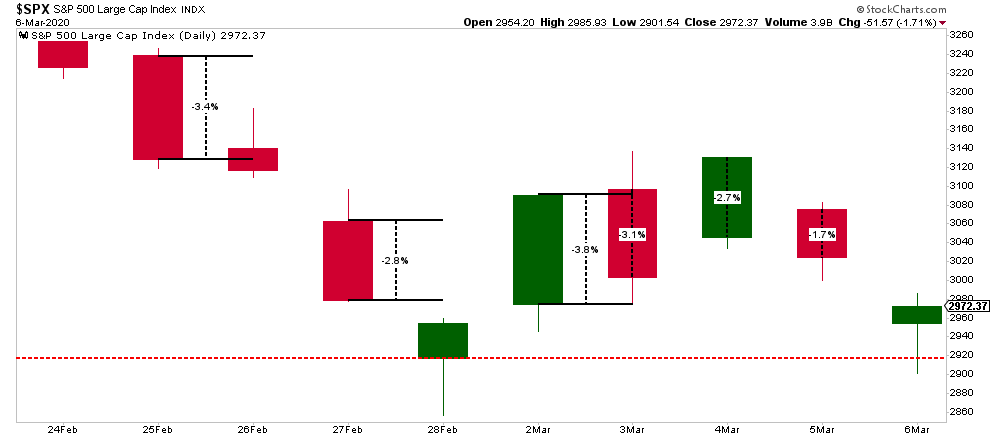
“From a purely technical basis, the extreme downside extension, and potential selling exhaustion, has set the markets up for a fairly strong reflexive bounce. This is where fun with math comes in.
As shown in the chart below, after a 35% decline in the markets from the previous highs, a rally to the 38.2% Fibonacci retracement would encompass a 20% advance.
Such an advance will ‘lure’ investors back into the market, thinking the ‘bear market’ is over.”
Honestly, no one knows for certain. However, there are 5-questions that “Market Bulls” need to answer if the current rally is to be sustained.
These questions are not entirely technical, but since “technical analysis” is simply the visualization of market psychology, how you answer the questions will ultimately be reflected by the price dynamics of the market.
Let’s get to work.
Employment
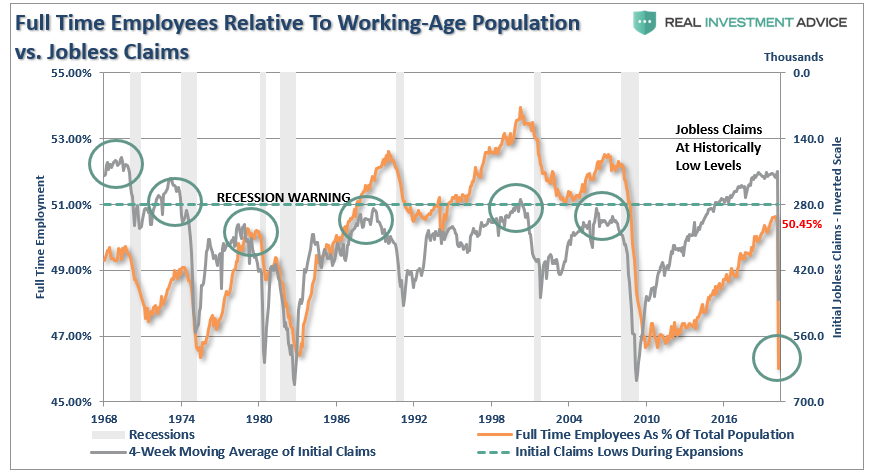
Employment is the lifeblood of the economy. Individuals cannot consume goods and services if they do not have a job from which they can derive income. From that consumption comes corporate profits and earnings.
Therefore, for individuals to consume at a rate to provide for sustainable, organic (non-Fed supported), economic growth they must work at a level that provides a sustainable living wage above the poverty level. This means full-time employment that provides benefits, and a livable wage. The chart below shows the number of full-time employees relative to the population. I have also overlaid jobless claims (inverted scale), which shows that when claims fall to current levels, it has generally marked the end of the employment cycle and preceded the onset of a recession.
This erosion in jobless claims has only just begun. As jobless claims and continuing claims rise, it will lead to a sharp deceleration in economic confidence. Confidence is the primary factor of consumptive behaviors, which is why the Federal Reserve acted so quickly to inject liquidity into the financial markets. While the Fed’s actions may prop up financial markets in the short-term, it does little to affect the most significant factor weighing on consumers – their job.
Question: Given that employment is just starting to decline, does such support the assumption of a continued bull market?
Personal Consumption Expenditures (PCE)
Following through from employment, once individuals receive their paycheck, they then consume goods and services in order to live.
This is a crucial economic concept to understand, which is the order in which the economy functions. Consumers must “produce” first, so they receive a paycheck, before they can “consume.” This is also the primary problem of Stephanie Kelton’s “Modern Monetary Theory,” which disincentivizes the productive capacity of the population.
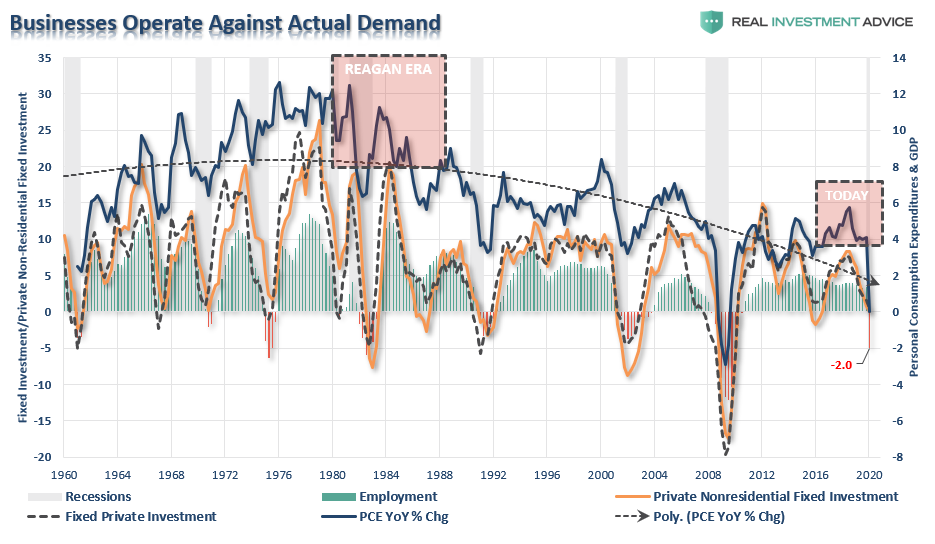
Given that Personal Consumption Expenditures (PCE) is a measure of that consumption, and comprises roughly 70% of the GDP calculation, its relative strength has great bearing on the outcome of economic growth.
More importantly, PCE is the direct contributor to the sales of corporations, which generates their gross revenue. So goes personal consumption – so goes revenue. The lower the revenue that flows into company coffers, the more inclined businesses are to cut costs, including employment and stock buybacks, to maintain profit margins.
The chart below is a comparison of the annualized change in PCE to corporate fixed investment and employment. I have made some estimates for the first quarter based on recent data points.
Question:Does the current weakness in PCE and Fixed Investment support the expectations for a continued bull market from current price levels?
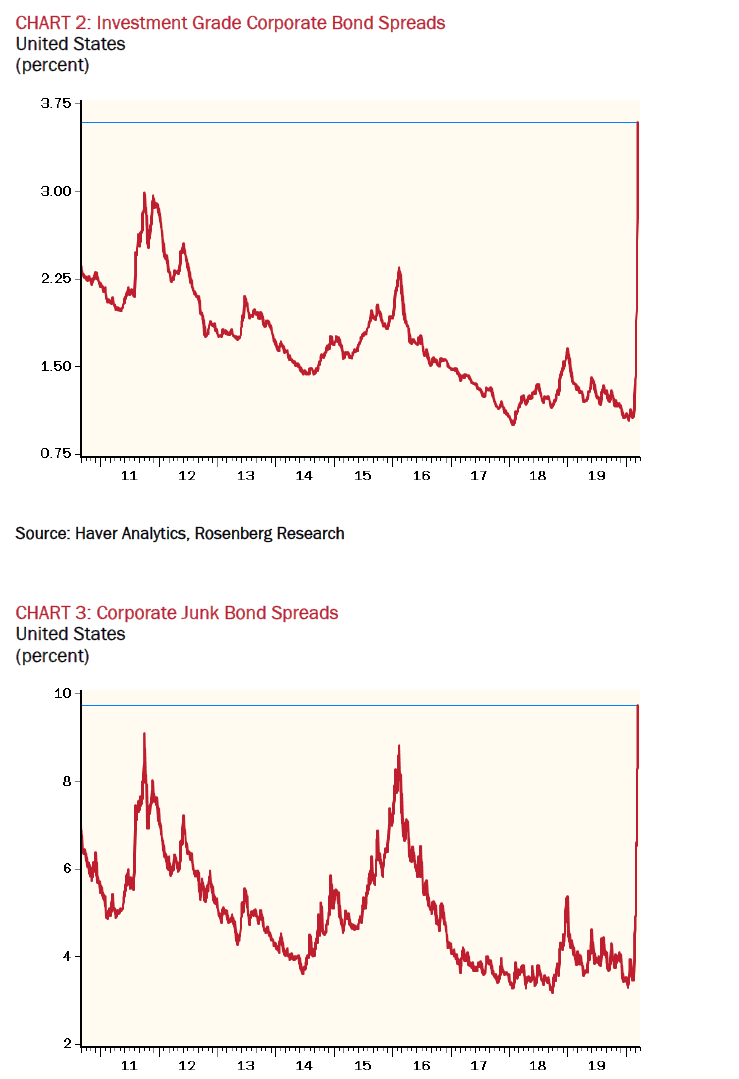
Junk Bonds & Margin Debt
While global Central Banks have lulled investors into an expanded sense of complacency through years of monetary support, it has led to willful blindness of underlying risk. As we discussed in “Investor’s Dilemma:”
“Classical conditioning (also known as Pavlovian or respondent conditioning) refers to a learning procedure in which a potent stimulus (e.g. food) is paired with a previously neutral stimulus (e.g. a bell). What Pavlov discovered is that when the neutral stimulus was introduced, the dogs would begin to salivate in anticipation of the potent stimulus, even though it was not currently present. This learning process results from the psychological “pairing” of the stimuli.”
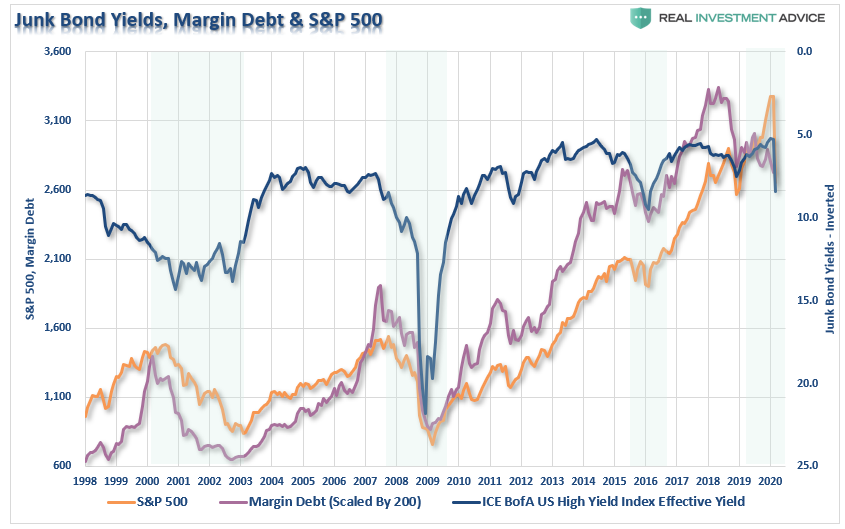
That “stimuli” over the last decade has been Central Bank interventions. During that period, the complete lack of “fear” in markets, combined with a “chase for yield,” drove “risk” assets to record levels along with leverage. The chart below shows the relationship between margin debt (leverage), stocks, and junk bond yields (which have been inverted for better relevance.)
While asset prices declined sharply in March, it has done little to significantly revert either junk bond yields or margin debt to levels normally consistent with the beginning of a new “bull market.”
With oil prices falling below $20/bbl, a tremendous amount of debt tied to the energy space, and the impact the energy sector has on the broader economy, it is likely too soon to suggest the markets have fully “priced in” the damage being done.
Question:What happens to asset prices if more bankruptcies and forced deleveraging occurs?
Corporate Profits/Earnings
As noted above, if the “bull market” is back, then stocks should be pricing in stronger earnings going forward. However, given the potential shakeout in employment, which will lower consumption, stronger earnings, and corporate profits, are not likely in the near term.
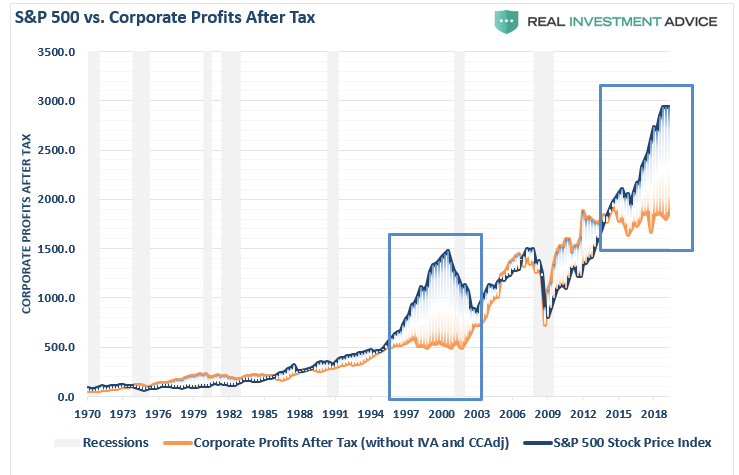
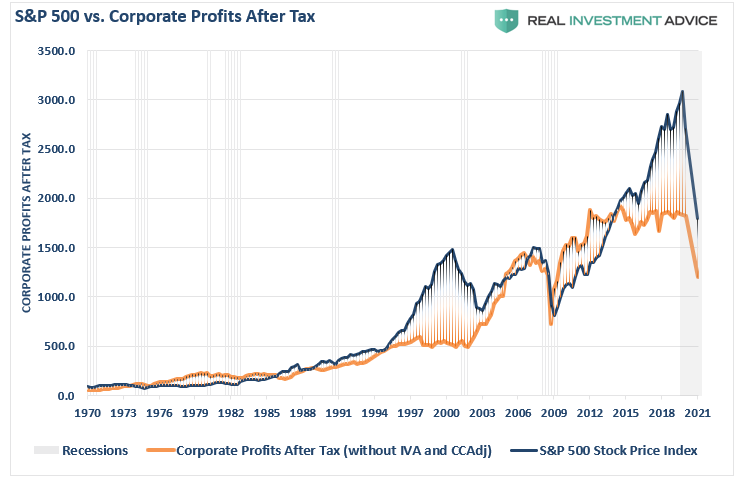
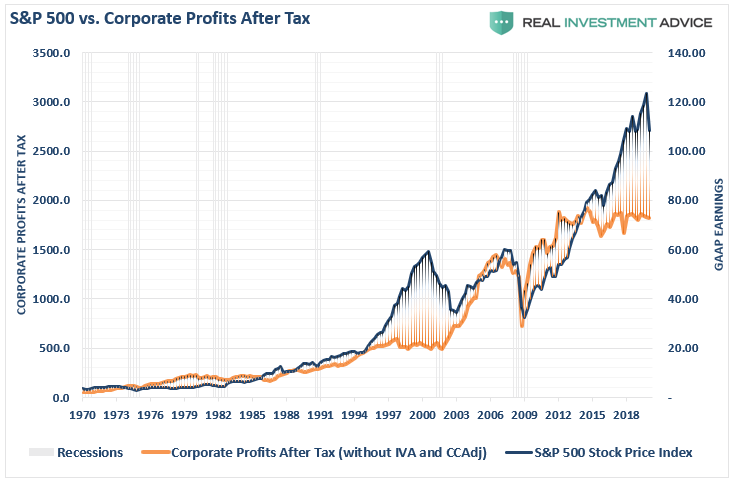
The risk to earnings is even higher than many suspect, given that over the last several years, companies have manufactured profitability through a variety of accounting gimmicks, but primarily through share buybacks from increased leverage. That cycle has now come to an end, but before it did it created a massive deviation of the stock market from corporate profitability.
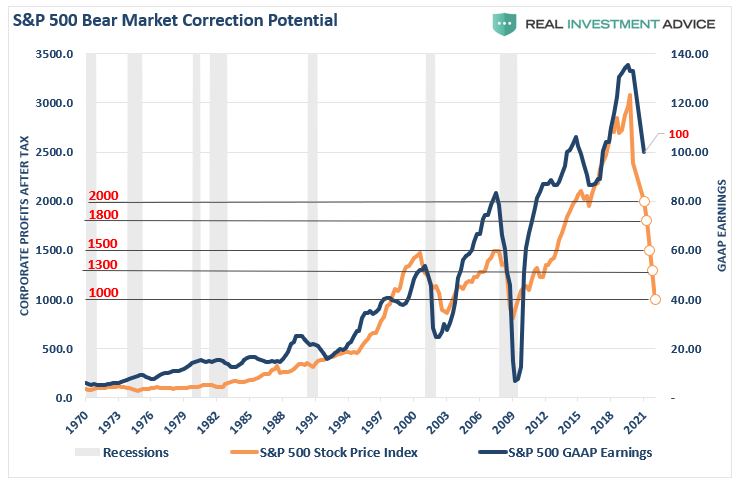
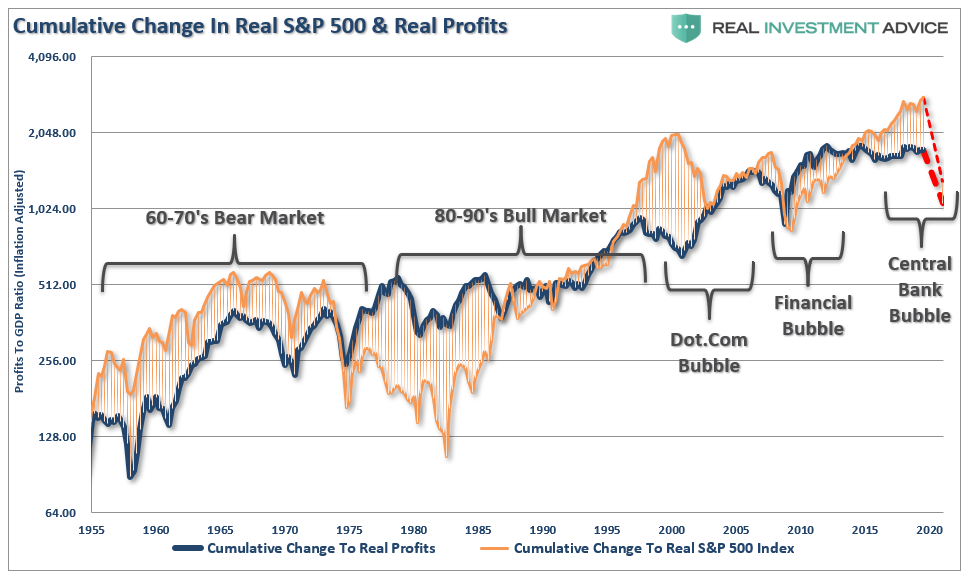
“If the economy is slowing down, revenue and corporate profit growth will decline also. However, it is this point which the ‘bulls’ should be paying attention to. Many are dismissing currently high valuations under the guise of ‘low interest rates,’ however, the one thing you should not dismiss, and cannot make an excuse for, is the massive deviation between the market and corporate profits after tax. The only other time in history the difference was this great was in 1999.”
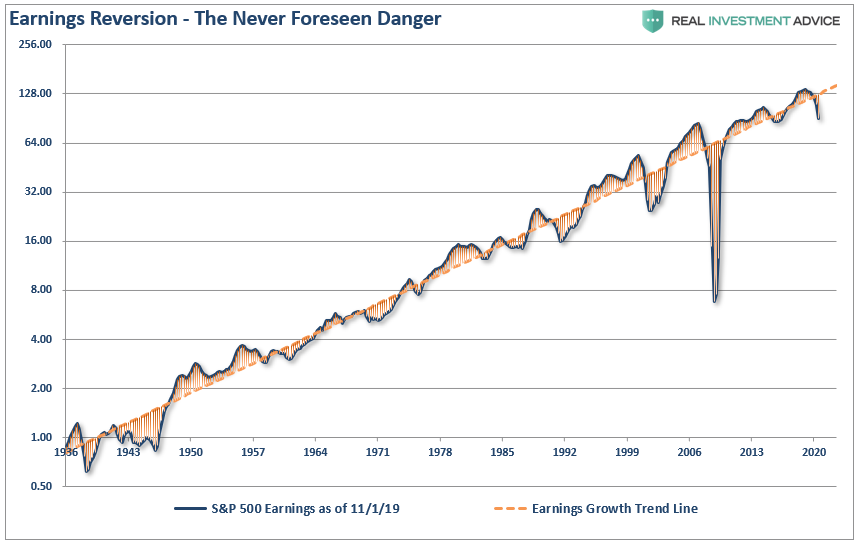
It isn’t just the deviation of asset prices from corporate profitability, which is skewed, but also reported earnings per share.
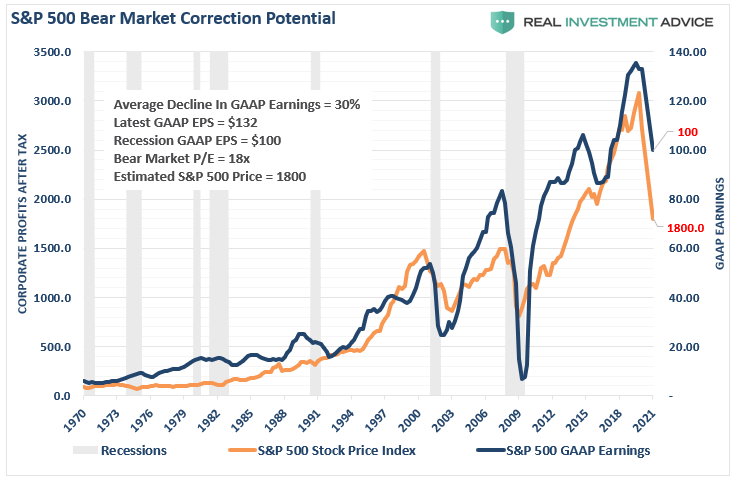
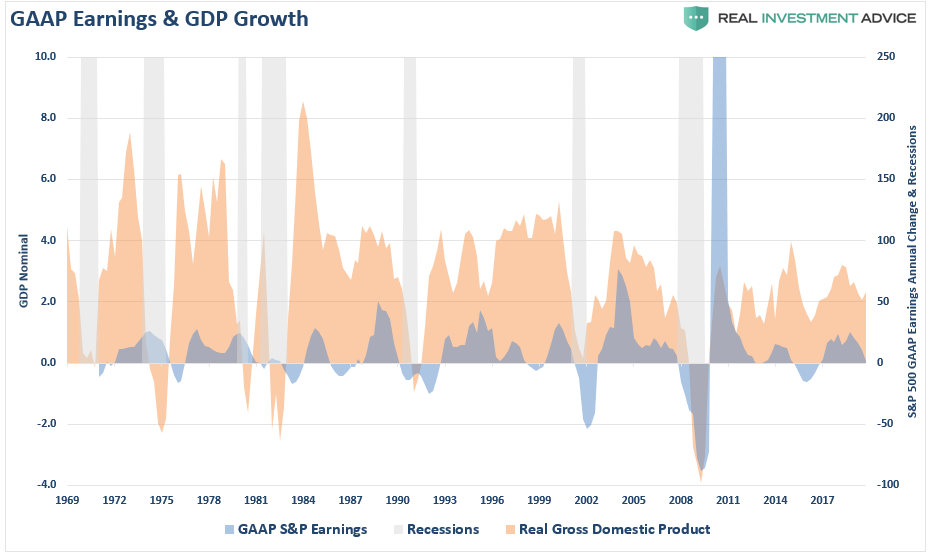
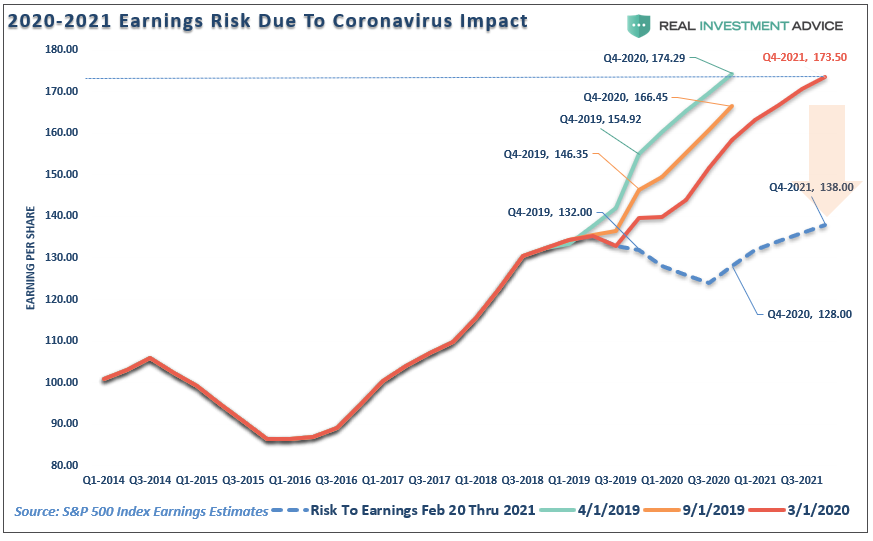
The impending recession, and consumption freeze, is going to start the mean-reversion process in both corporate profits, and earnings. I have projected the potential reversion in the chart below. The reversion in GAAP earnings is pretty calculable as swings from peaks to troughs have run on a fairly consistent trend.
Using that historical context, we can project a recession will reduce earnings to roughly $100/share. (Goldman Sachs currently estimates $110.) The resulting decline asset prices to revert valuations to a level of 18x (still high) trailing earnings would suggest a level of 1800 for the S&P 500 index. (Yesterday’s close of 2626 is still way to elevated.)
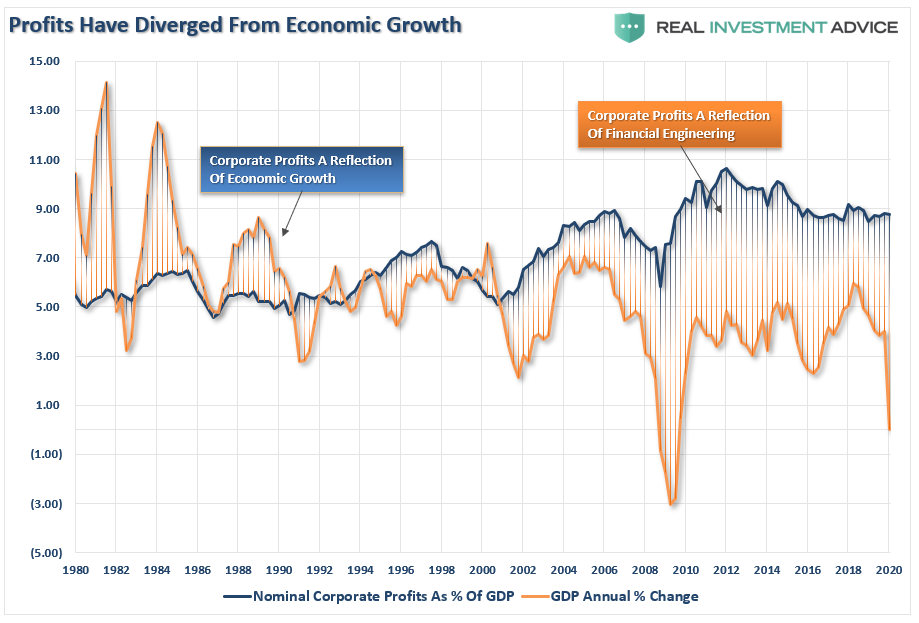
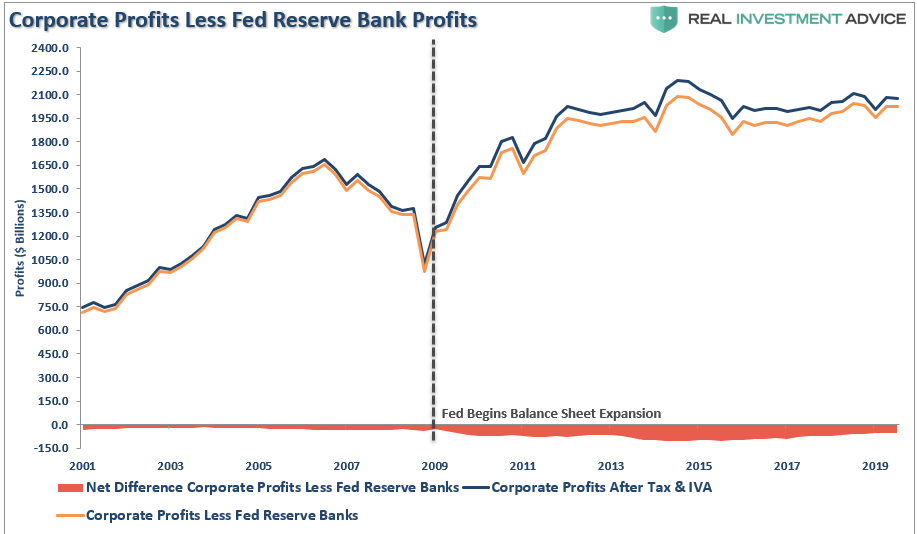
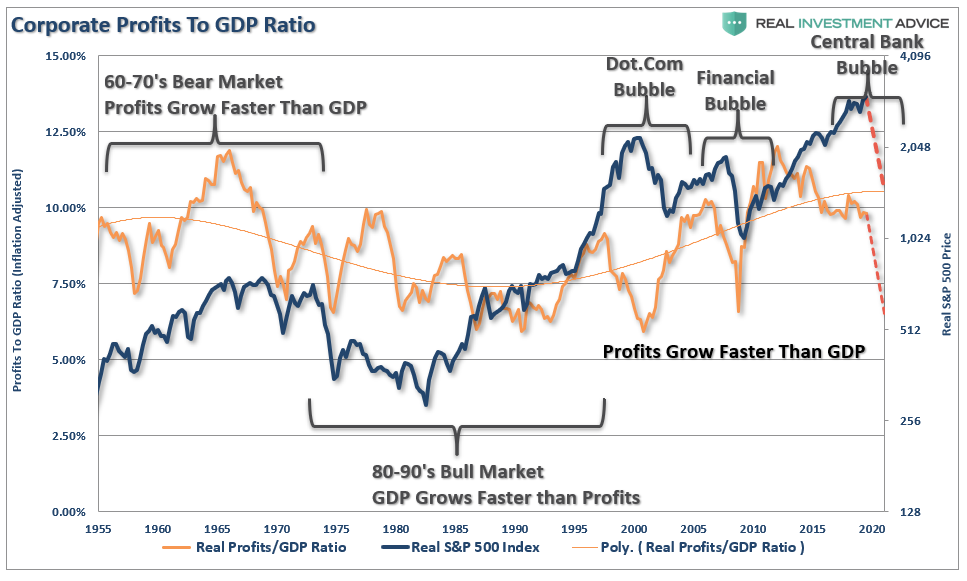
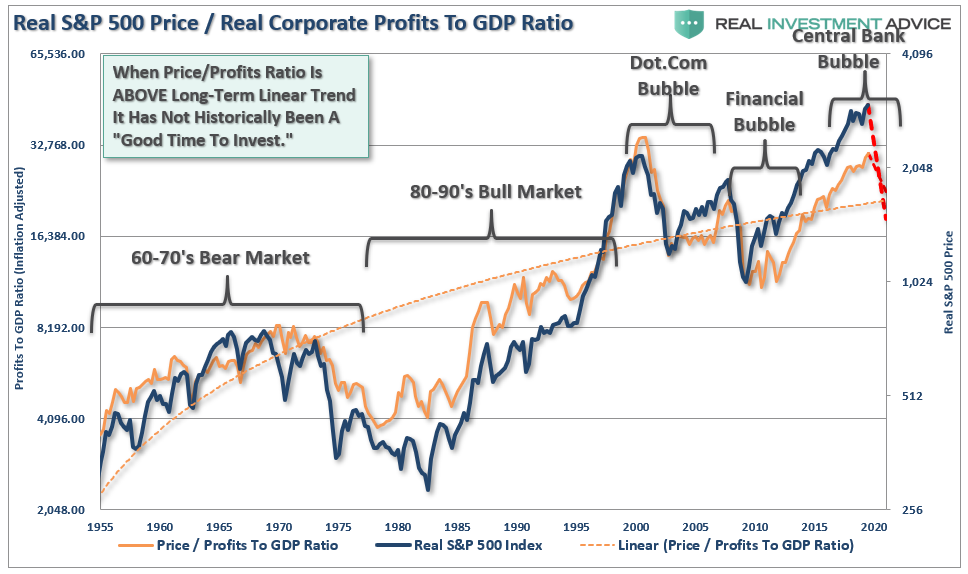
The decline in economic growth epitomizes the problem that corporations face today in trying to maintain profitability. The chart below shows corporate profits as a percentage of GDP relative to the annual change in GDP. The last time that corporate profits diverged from GDP, it was unable to sustain that divergence for long. As the economy declines, so will corporate profits and earnings.
Question: How long can asset prices remain divorced from falling corporate profits and weaker economic growth?
Technical Pressure
Given all of the issues discussed above, which must ultimately be reflected in market prices, the technical picture of the market also suggests the recent “bear market” rally will likely fade sooner than later. As noted above”
“Such an advance will ‘lure’ investors back into the market, thinking the ‘bear market’ is over.”
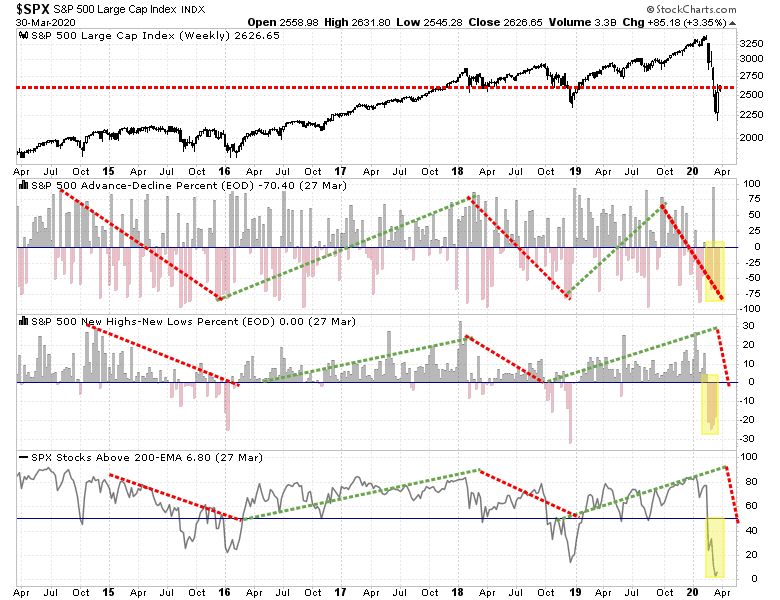
Importantly, despite the sizable rally, participation has remained extraordinarily weak. If the market was seeing strong buying, as suggested by the media, then we should see sizable upticks in the percent measures of advancing issues, issues at new highs, and a rising number of stocks above their 200-dma.
However, on a longer-term basis, since this is the end of the month, and quarter, we can look at our quarterly buy/sell indication which has triggered a “sell” signal for the first time since 2015. While such a signal does not demand a major reversion, it does suggest there is likely more risk to the markets currently than many expect.
Question: Does the technical backdrop currently support the resumption of a bull market?
There are reasons to be optimistic on the markets in the very short-term. However, we are continuing to extend the amount of time the economy will be “shut down,” which will exacerbate the decline in the unemployment and personal consumption data. The feedback loop from that data into corporate profits and earnings is going to make valuations more problematic even with low interest rates currently.
While Central Banks have rushed into a “burning building with a fire hose” of liquidity, there is the risk that after a decade of excess debt, leverage, and misallocation of assets, the “fire” may be too hot for them to put out.
Assuming that the “bear market” is over already may be a bit premature, and chasing what seems like a “raging bull market” is likely going to disappoint you.
Bear markets have a way of “suckering” investors back into the market to inflict the most pain possible. This is why “bear markets” never end with optimism, but in despair.
TPA Analytics: Death Cross On Russell 3000 Signals More Pain To Come
Jeffrey Marcus is the President of Turning Point Analytics. Turning Point Analytics utilizes a time-tested, real world strategy that optimizes client’s entry and exit points and adds alpha. TPA defines each stock as Trend or Range to identify actionable inflection points. For more information on TPA check out: http://www.TurningPointAnalyticsllc.com
Bull Market? No, The Bear Still Rules For Now (Full Report)
The “2020 SOCIALLY DISTANT INVESTMENT SUMMIT” is coming on Thursday, April 2nd.
Click the link below to receive an email with a special “invitation only” link when the summit goes “live.” (Current newsletter subscribers are already registered.)
Catch Up On What You Missed Last Week
NOTE: During these tumultuous times, we are unlocking our full newsletter to help you navigate the markets safely. Make sure you subscribe toRIAPRO.NET (Free 30-Day Trial) if you want to keep receiving the full report after the storm passes.
“From a purely technical basis, the extreme downside extension, and potential selling exhaustion, has set the markets up for a fairly strong reflexive bounce. This is where fun with math comes in.
As shown in the chart below, after a 35% decline in the markets from the previous highs, a rally to the 38.2% Fibonacci retracement would encompass a 20% advance.
Such an advance will ‘lure’ investors back into the market, thinking the ‘bear market’ is over.”
Chart Updated Through Friday
Not surprisingly, here were the headlines, almost exactly as we wrote them:
Well, you get the idea.
While it was indeed a sharp “reflex rally,” and expected, “bear markets” are not resolved in a single month. More importantly, “bear markets” only end when “NO ONE wants to buy it.”
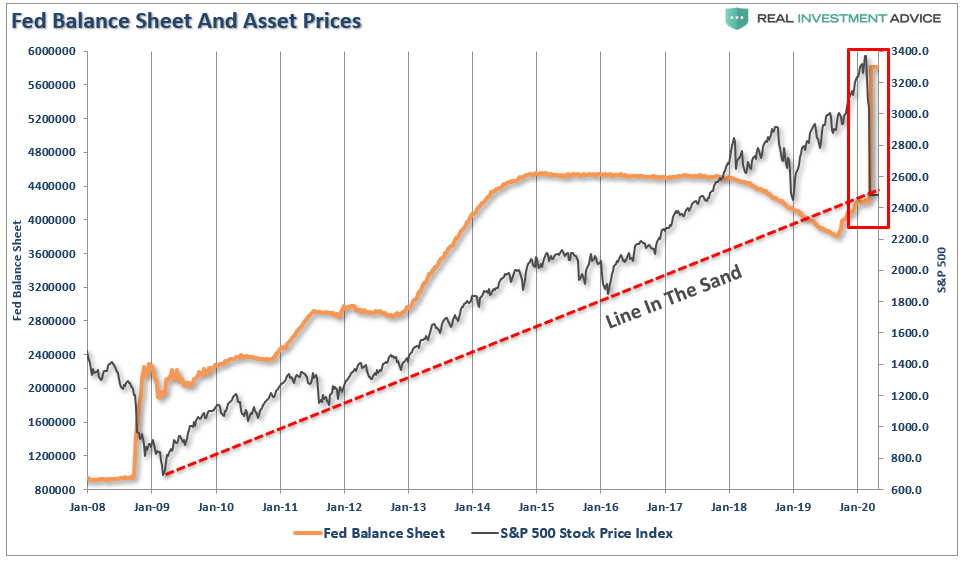
Fed Can’t Fix It
As noted above, the “bear market” will NOT be over until the credit market is fixed. We are a long way from that being done, given the blowout in yields currently occurring.
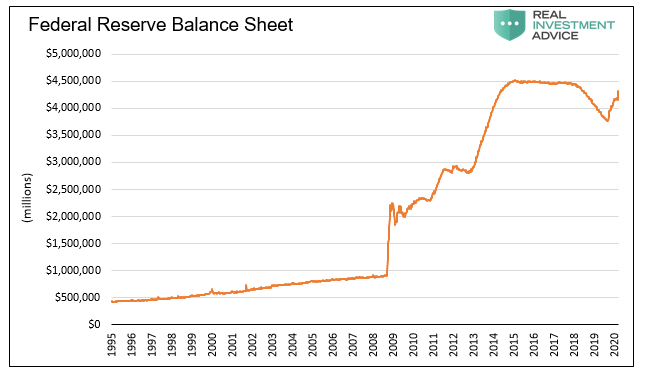
The Fed has cut rates by 150 basis points to near zero and run through its entire 2008 crisis handbook.
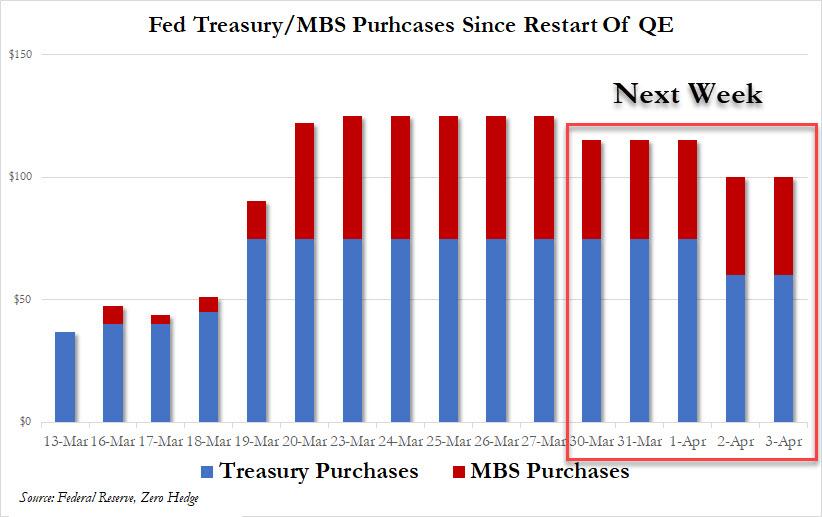
That wasn’t enough to calm markets, though — so the central bank also announced $1 trillion a day in repurchase agreements and unlimited quantitative easing, which includes a hard-to-understand $625 billion of bond-buying a week going forward. At this rate, the Fed will own two-thirds of the Treasury market in a year.
But it’s the alphabet soup of new programs that deserve special consideration, as they could have profound long-term consequences for the functioning of the Fed and the allocation of capital in financial markets. Specifically, these are:
CPFF (Commercial Paper Funding Facility) – buying commercial paper from the issuer.
PMCCF (Primary Market Corporate Credit Facility) – buying corporate bonds from the issuer.
SMCCF (Secondary Market Corporate Credit Facility) – buying corporate bonds and bond ETFs in the secondary market.
MSBLP (Main Street Business Lending Program) – Details are to come, but it will lend to eligible small and medium-sized businesses, complementing efforts by the Small Business Association.
To put it bluntly, the Fed isn’t allowed to do any of this.”
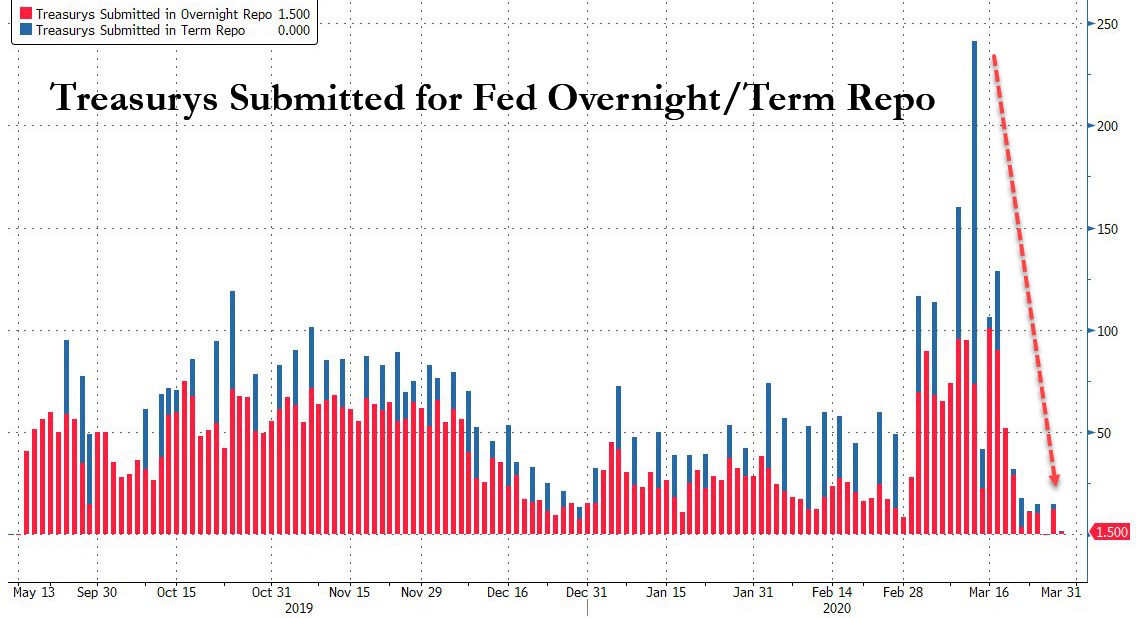
However, on Friday, the Federal Reserve ran into a problem, which could poses a risk for the markets going forward. As Jim noted, the mind-boggling pace of bond purchases quickly hit the limits of what was available to pledge for collateral.
Or rather, the Fed’s “unlimited QE,” may not be so “unlimited” after all.
The consequence is the Fed is already having to start cutting back on its QE program. That news fueled the late-day sell-off Friday afternoon. (Charts courtesy of Zerohedge)
While Congress did pass the “CARES” act on Friday, it will do little to backstop what is about to happen to the economy for two primary reasons:
The package will only support the economy for up to two months. Unfortunately, there is no framework for effective and timely deployment; firms are already struggling to pay rents, there are pockets of funding stress in credit markets as default risks build, and earnings guidance is abandoned.
The unprecedented uncertainty facing financial markets on the duration of social distancing, the depth of the economic shock and when the infection rate curve will flatten, and there are many unknowns which will further undermine confidence.
Both of these points are addressed in this week’s Macroview but here are the two salient points to support my statement:
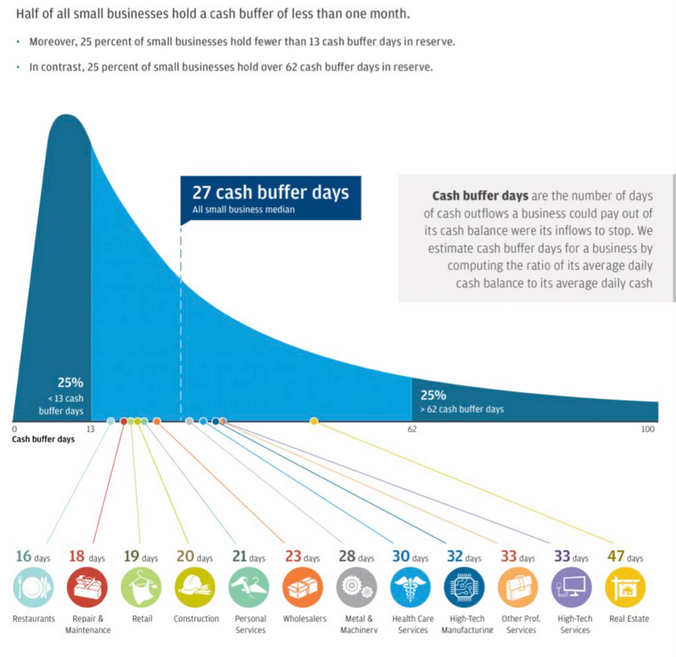
“Most importantly, as shown below, the majority of businesses will run out of money long before SBA loans, or financial assistance, can be provided. This will lead to higher and longer-duration of, unemployment.”
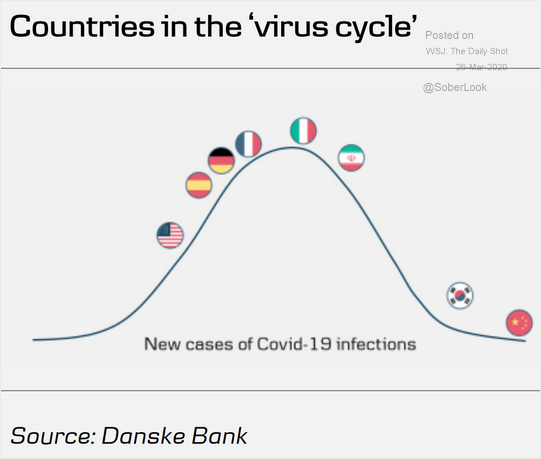
“While there is much hope that the current ‘economic shutdown’ will end quickly, we are still very early in the infection cycle relative to other countries. Importantly, we are substantially larger than most, and on a GDP basis, the damage will be worse.”
What the cycle tells us is that jobless claims, unemployment, and economic growth are going to worsen materially over the next couple of quarters.
The problem with the current economic backdrop, and mounting job losses, is the vast majority of American’s were woefully unprepared for any type of disruption to their income going into the recession. As job losses mount, a virtual spiral in the economy begins as reductions in spending put further pressures on corporate profitability. Lower profits leads to higher unemployment and lower asset prices until the cycle is complete.
The long term bull pattern that existed since the 3/9/09 is over. That means the pattern of investors confidently buying every decline is over.
The market became historically oversold on 3/23 using many metrics, and that oversold condition coincided with the long term support area of S&P 500 2110-2180.
The short-covering and rebalancing had a lot to do with the size and speed of the 3-day rally. Also, we know the lack of ETF liquidity played a huge role as well as algorithmic trading.
Technically the market can still go up 6.9% higher from here to hit the 50% retracement level (3386 – 2237 = 1149/2 = 574 + 2237 = 2811….2811/2630 = +6.9%.) I would not bet on it.
The market only sustains a rally once there is light at the Coronavirus tunnel.
I do not think the S&P 500 will hit a new high this year. Maybe not in 2021, either.
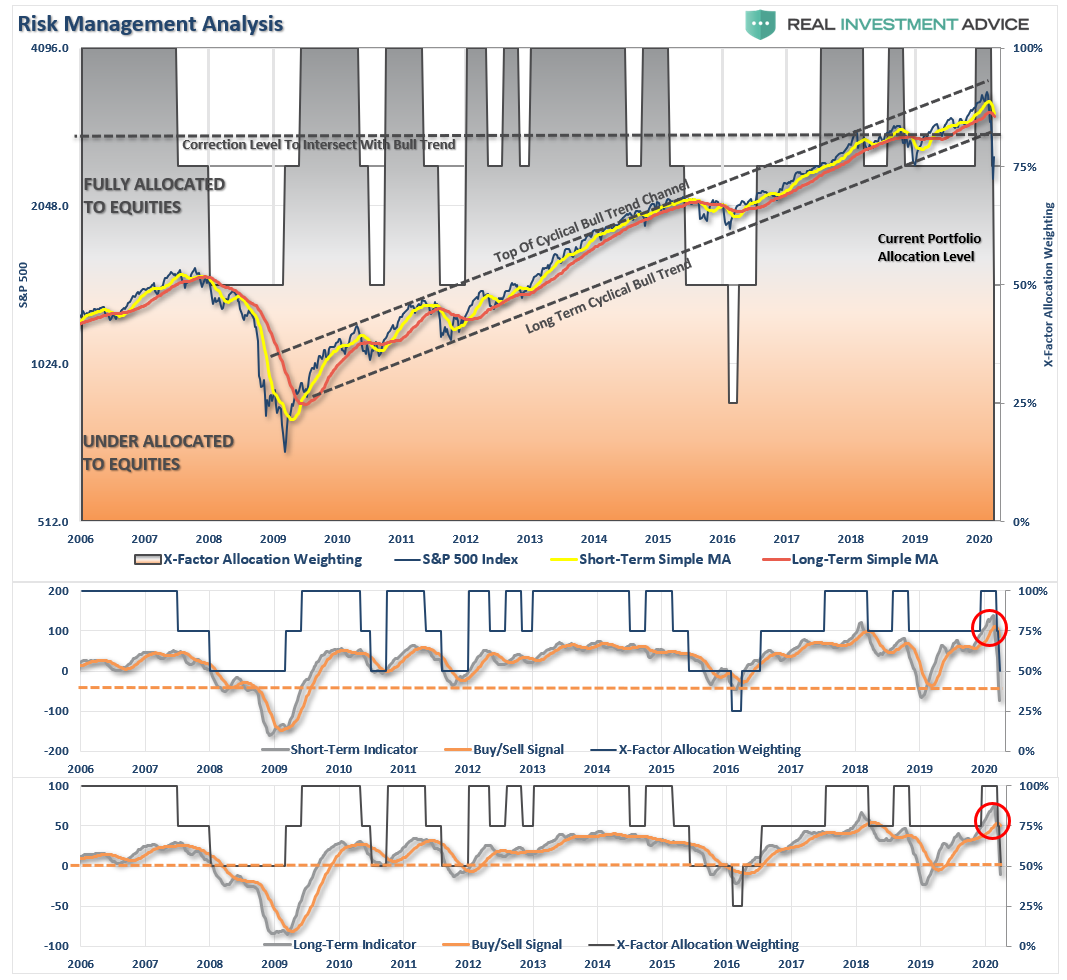
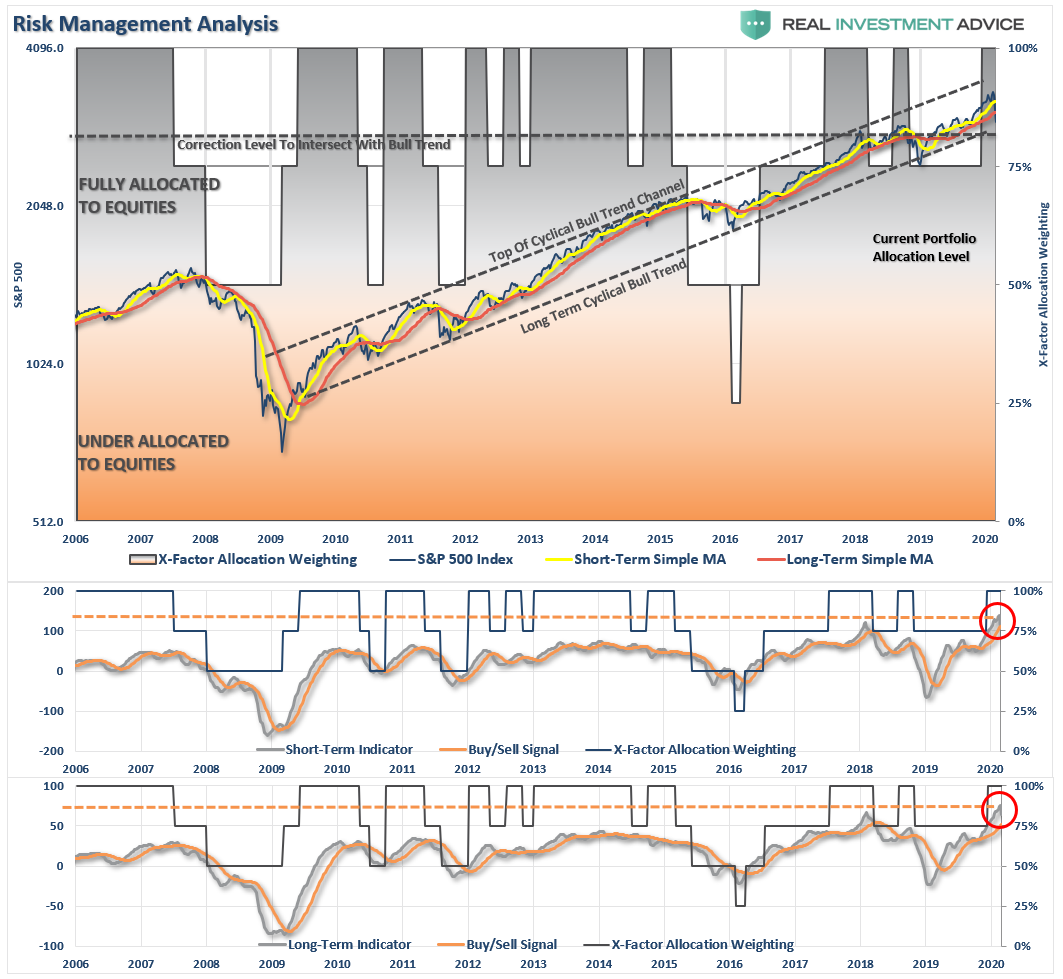
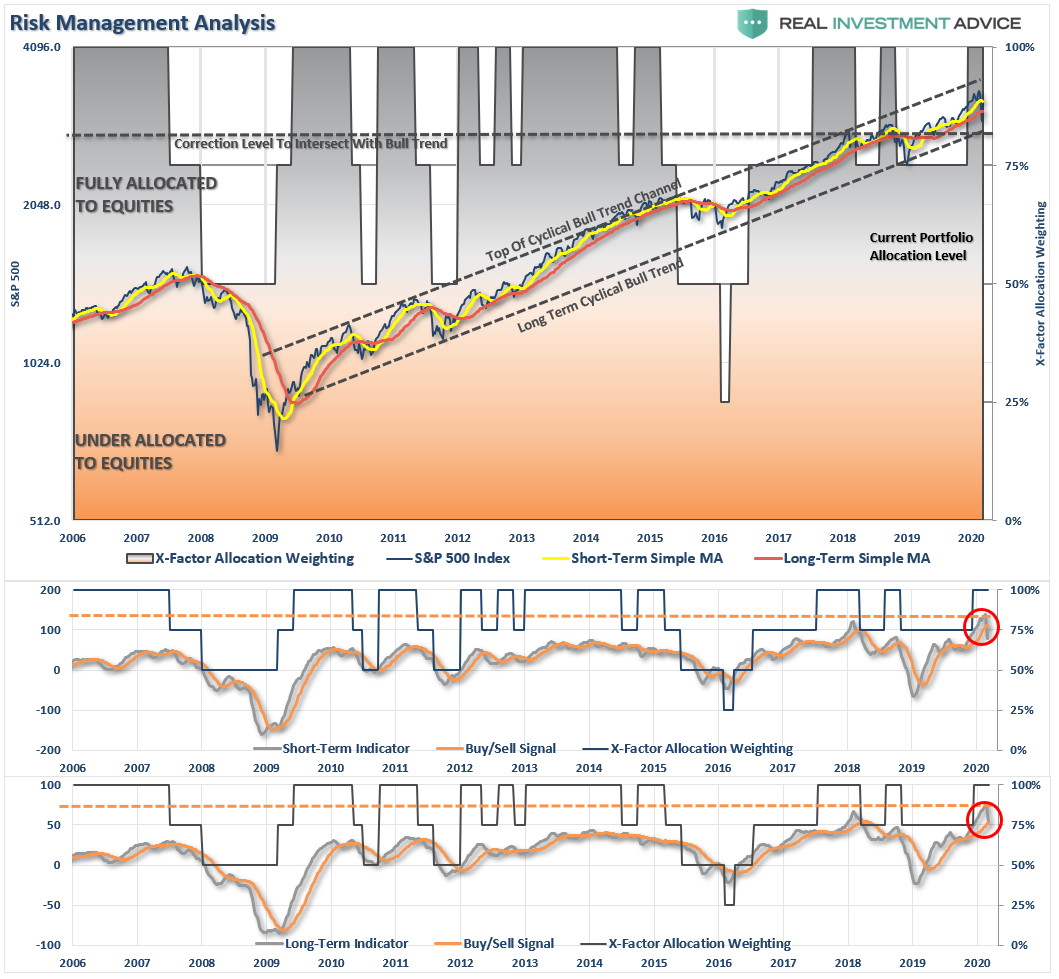
His analysis agrees with our own, which we discussed with you last week.
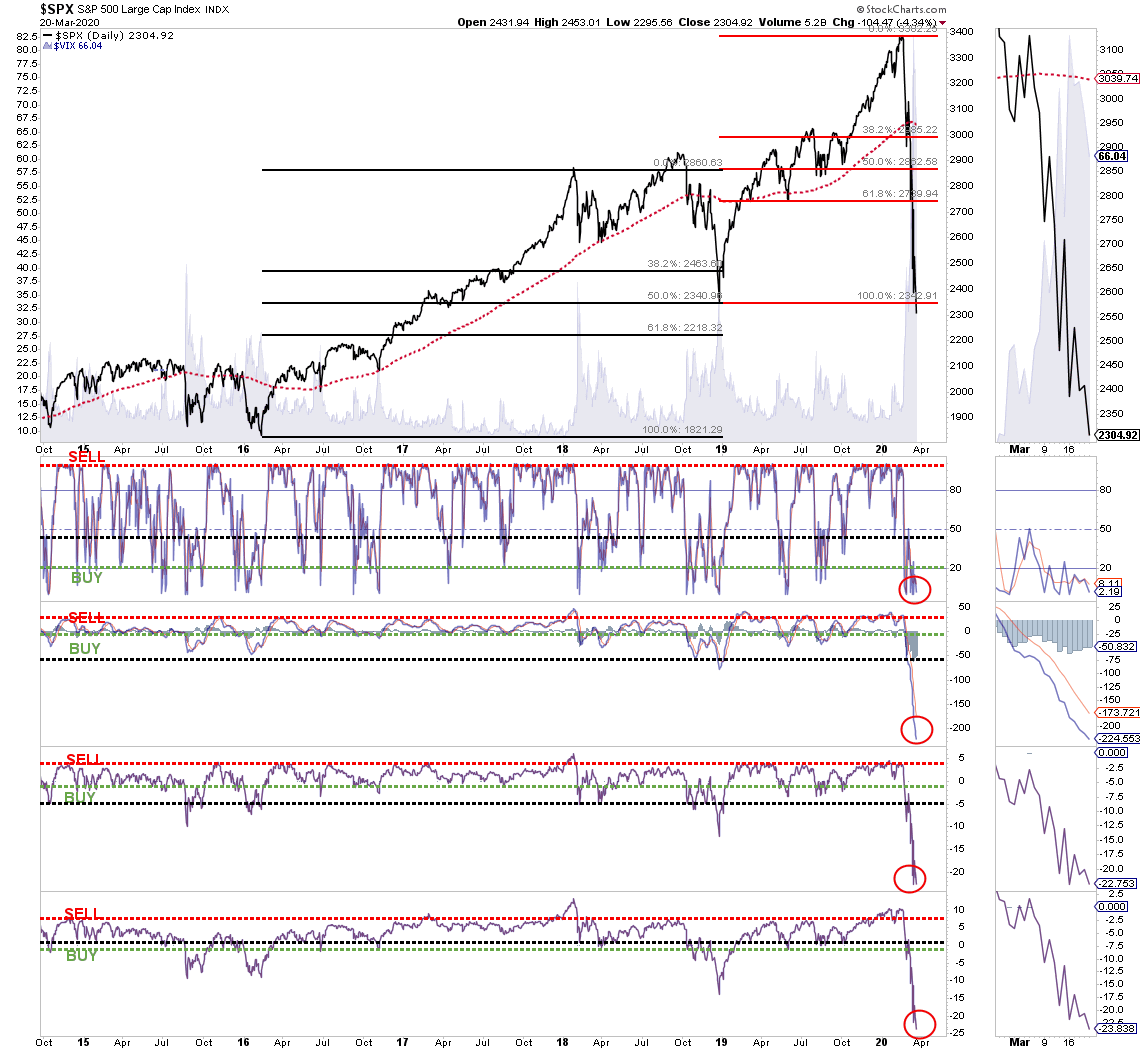
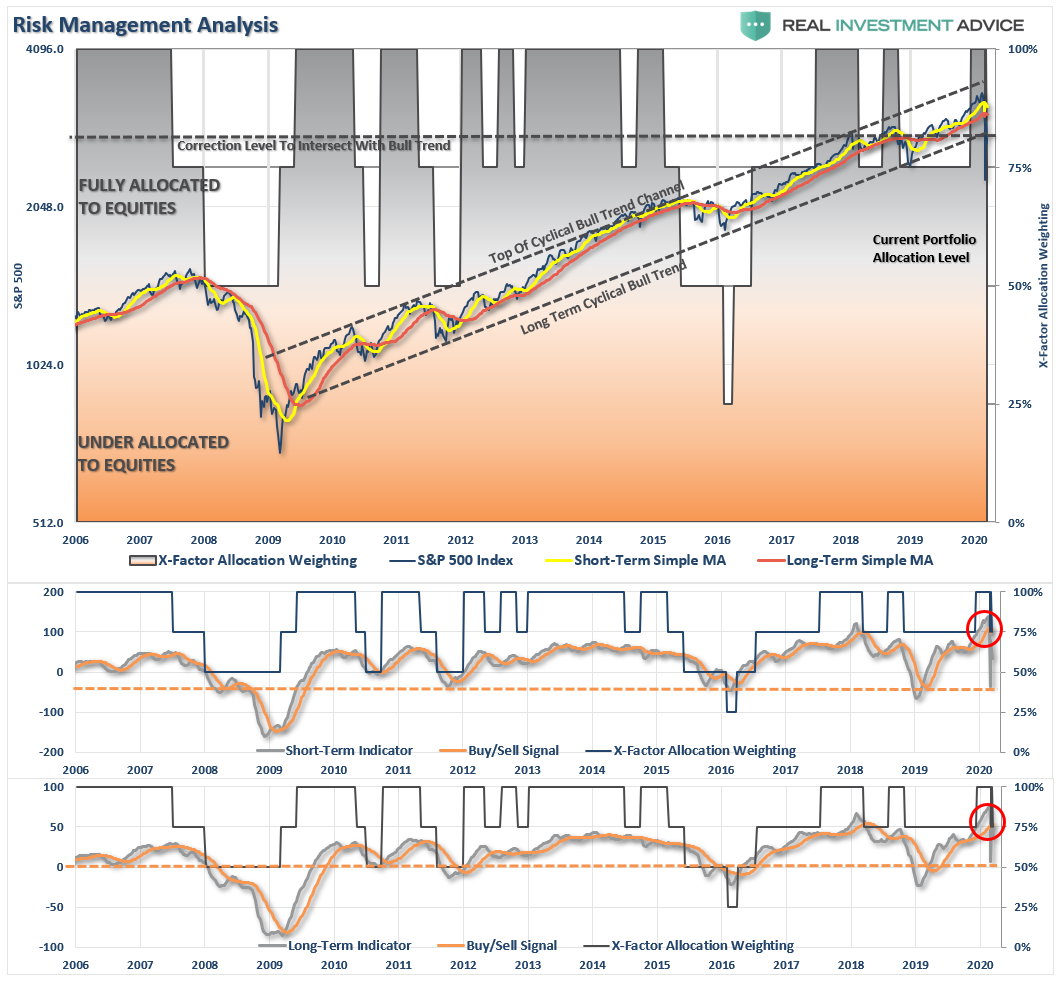
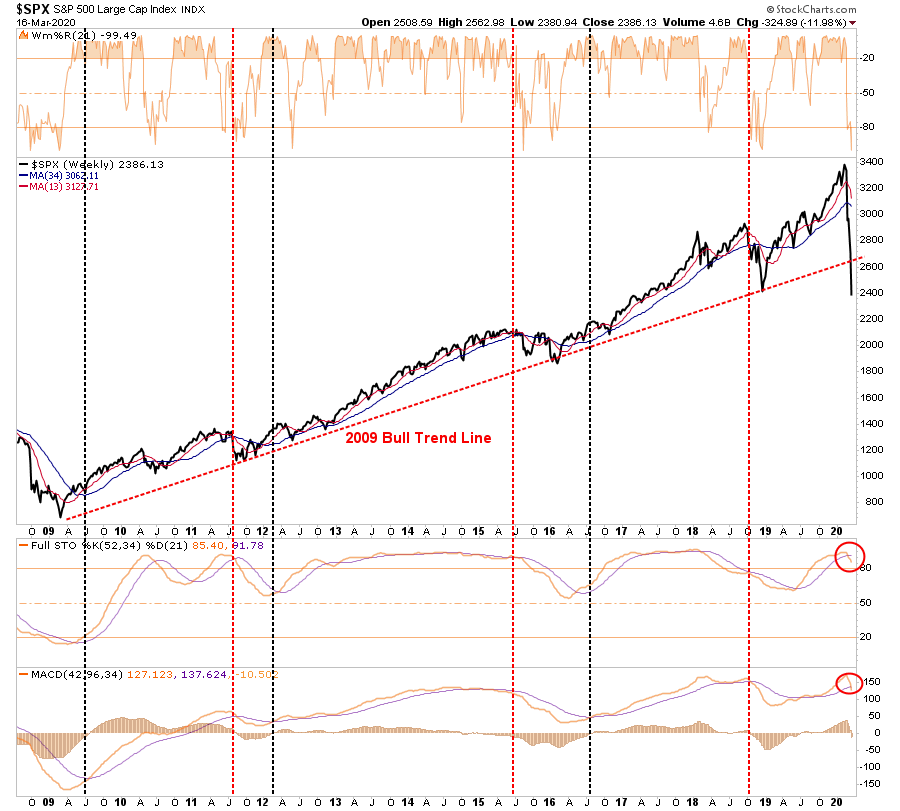
“The good news is the markets are now more extremely oversold on a variety of measures than at just about any other point in history.
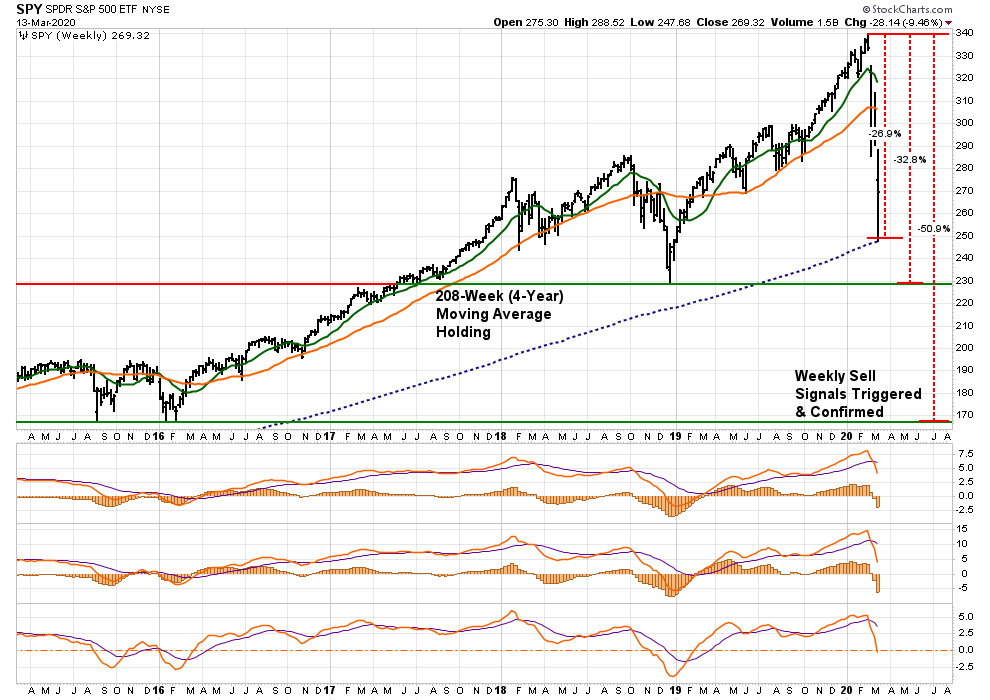
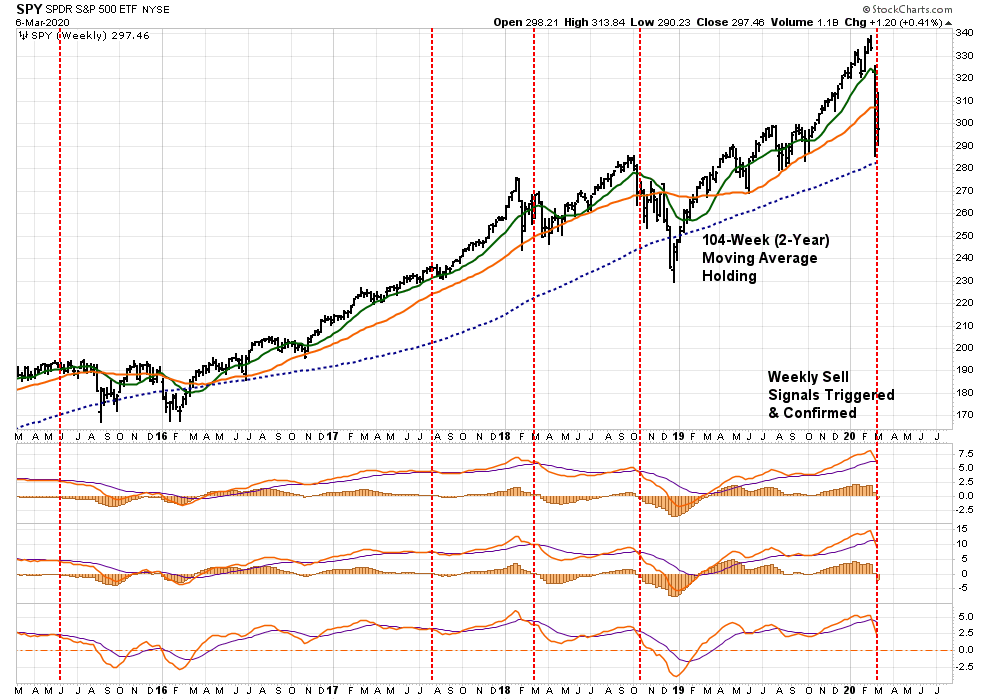
Warning: Any reversal will NOT BE the bear market bottom. It will be a ‘bear market’ rally you will want to ‘sell’ into. The reason is there are still many investors trapped in ‘buy and hold’ and ‘passive indexing’ strategies that are actively seeking an exit. Any rallies will be met with redemptions.
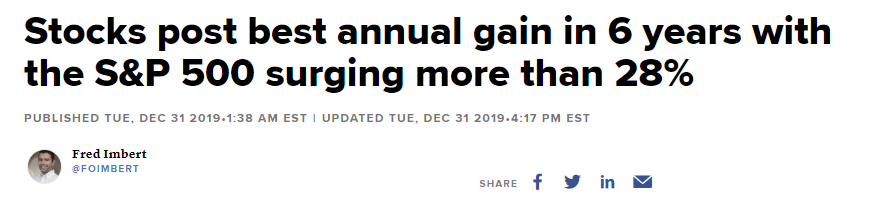
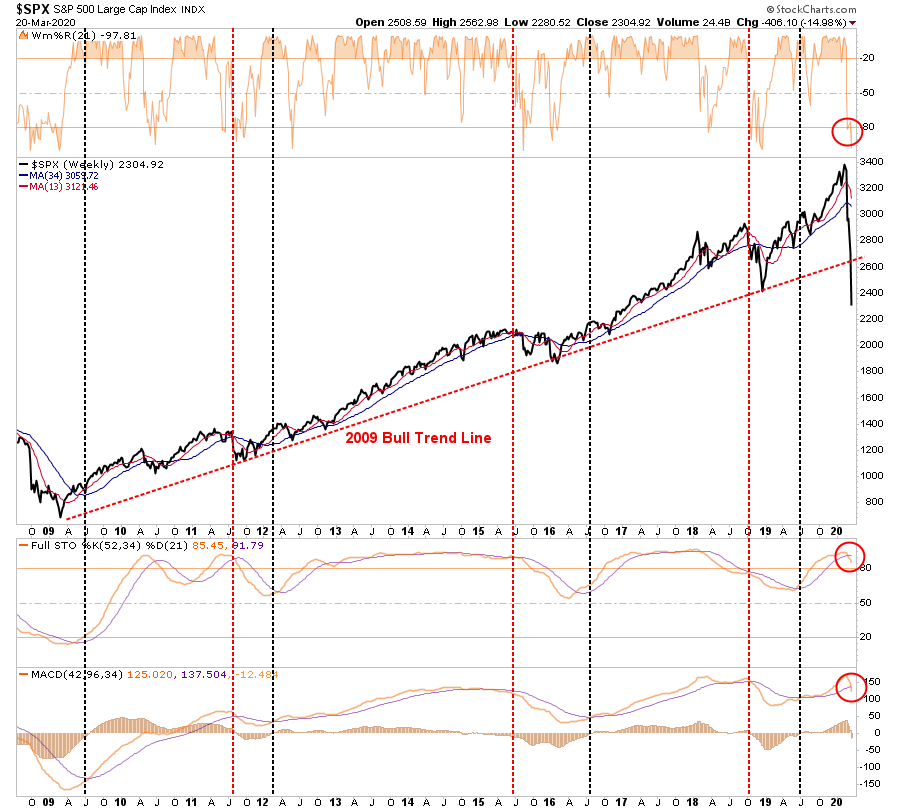
Most importantly, all of our long-term weekly ‘sell signals’ have now been triggered. Such would suggest that a rally back to the ‘bullish trend line’ from 2009 will likely be the best opportunity to ‘sell’ before the ‘bear market’ finds its final low.”
Last week’s chart updated through Friday’s close.
While the recent lows may indeed turn out to be “the bottom,” I highly suspect they won’t. Given the sell signals have been registered at such high levels, the time, and distance, needed to reverse the excesses will require a deeper market draw.
As Jeff Hirsch from Stocktrader’s Alamanc noted:
“While we are all rooting for the market to find support here so much damage has been done. A great deal of uncertainty remains for the economy and health crisis. This looks like a bear market bounce.
History suggests that we are in for some tough sledding in the market this year with quite a bit of chop. When the January Barometer came in with a negative reading, our outlook for 2020 began to diminish as every down January since 1950 has been followed by a new or continuing bear market, a 10% correction, or a flat year. Then another warning sign flashed when DJIA closed below its December closing low on February 26, 2020 as the impact of this novel coronavirus began to take its toll on Wall Street.
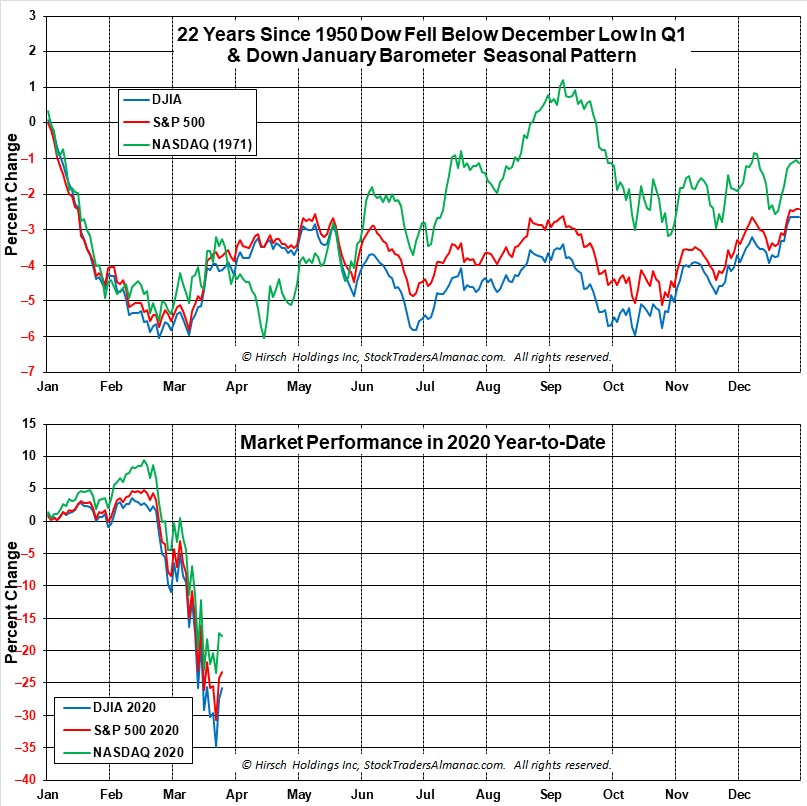
In the March Outlook, we presented this graph of the composite seasonal pattern for the 22 years since 1950 when both the January Barometer as measured by the S&P 500 were down, and the Dow closed below its previous December closing low in the first quarter. Below is a graph of DJIA, S&P 500 and NASDAQ Composite for 2020 year-to-date as of the close on March 25. Comparing 2020 market action to these 22 years, suggests a choppy year ahead with the potential for several tests of the recent low.”
“The depth of this waterfall decline may be too deep for the market to rebound quickly. This bear market also put this year’s Best Six Months (November-April) at risk of being negative. The record of down Best Six Months is not encouraging and it reminds us of a salient quote from the Almanac from an old market sage,
‘If the market does not rally, as it should during bullish seasonal periods, it is a sign that other forces are stronger and that when the seasonal period ends those forces will really have their say.’— Edson Gould (Stock market analyst, Findings & Forecasts, 1902-1987)'”
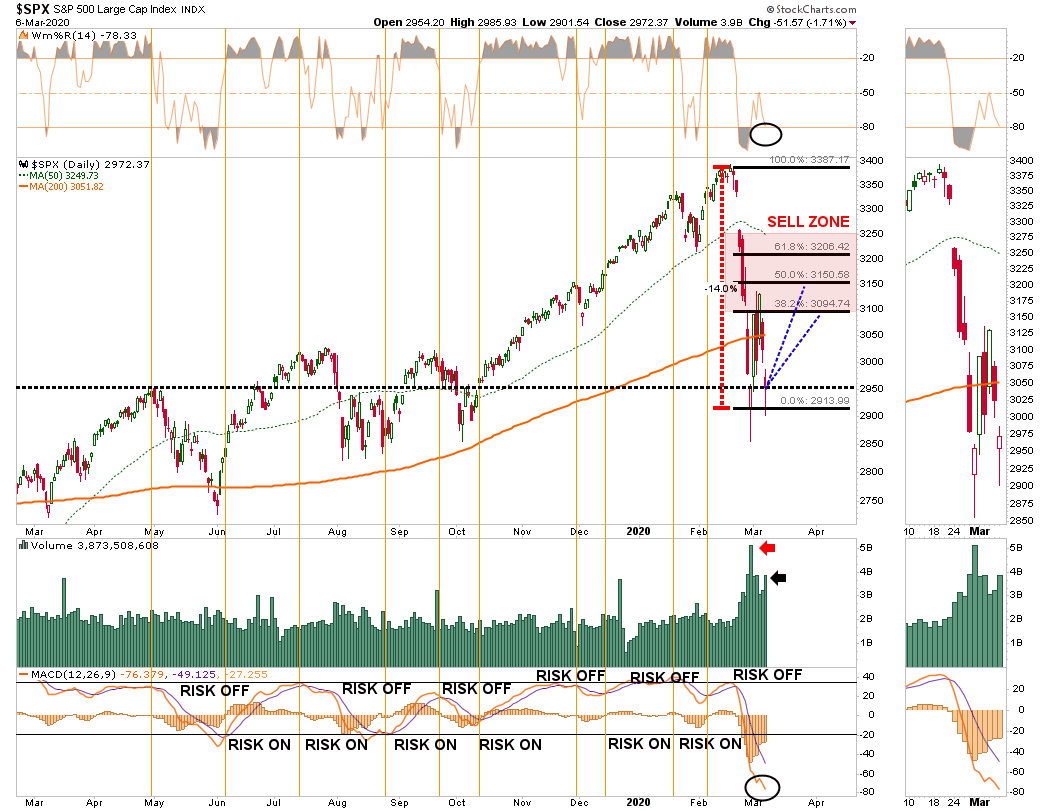
On a short-term basis, the market is also suggesting some risk. The daily chart below shows the market rallied to, and failed at, the first level of the Fibonacci retracement we outlined last week, suggesting profits be taken at this level. While there are two remaining targets for the bear market rally, the probabilities weigh heavily against them. (This doesn’t mean they can’t be achieved, it is “possible,” just not “probable.”)
Furthermore, with the “Death Cross” triggering on Friday (the 50-dma crossing below the 200-dma), this will put further downside pressure on any “bear market” advance from current levels.
Given the magnitude, and multiple confirmations, of these signals, it is far too soon to assume the “bear market” is over. This is particularly the case, given the sell-off is less than one-month-old.
Bear markets, and recessions, tend to last 18-months on average.
The current bear market and recession are not the results of just the “coronavirus” shock. It is the result of many simultaneous shocks from:
Economic disruption
Surging unemployment
Oil price shock
Collapsing consumer confidence, and
Most importantly, a “credit event.”
We likely have more to go before we can safely assume we have turned the corner.
In the meantime, use rallies to raise cash. Don’t worry about trying to “buy the bottom.”There will be plenty of time to see “THE” bottom is in, and having cash will allow you to “buy stocks” from the last of the “weak hands.”
The MacroView
If you need help or have questions, we are always glad to help. Just email me.
See You Next Week
By Lance Roberts, CIO
Market & Sector Analysis
Data Analysis Of The Market & Sectors For Traders
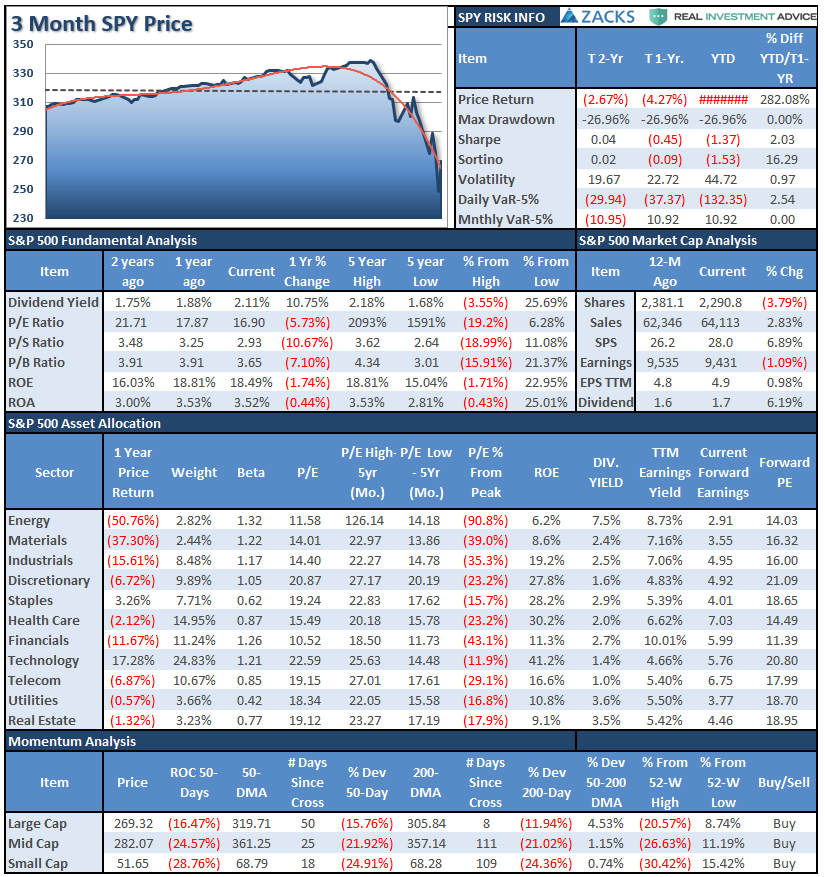
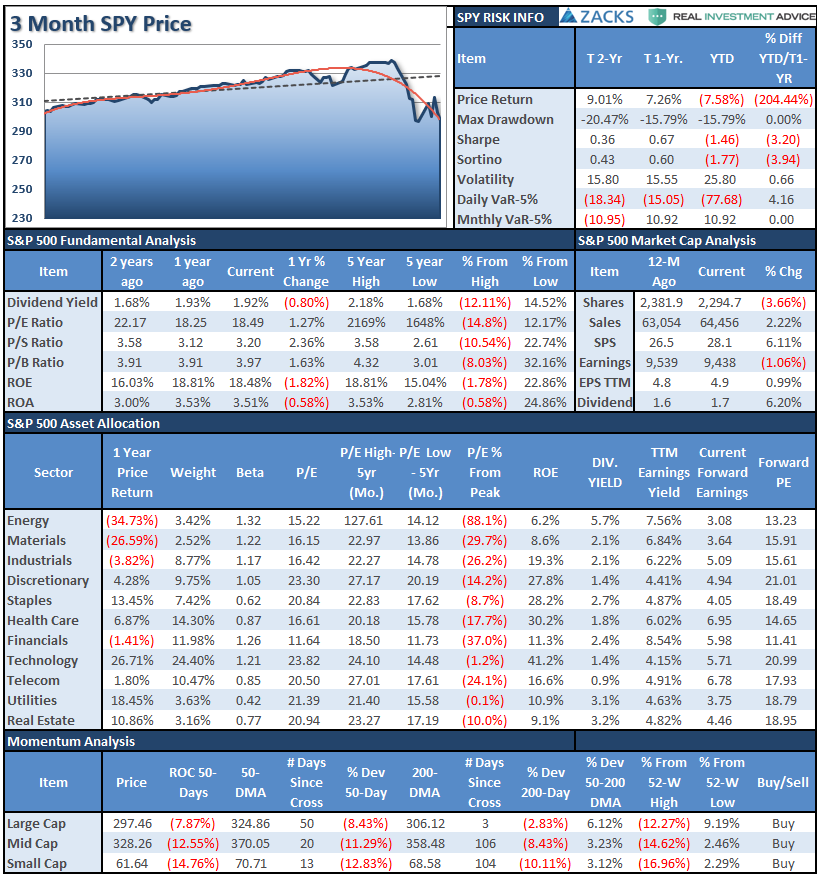
S&P 500 Tear Sheet
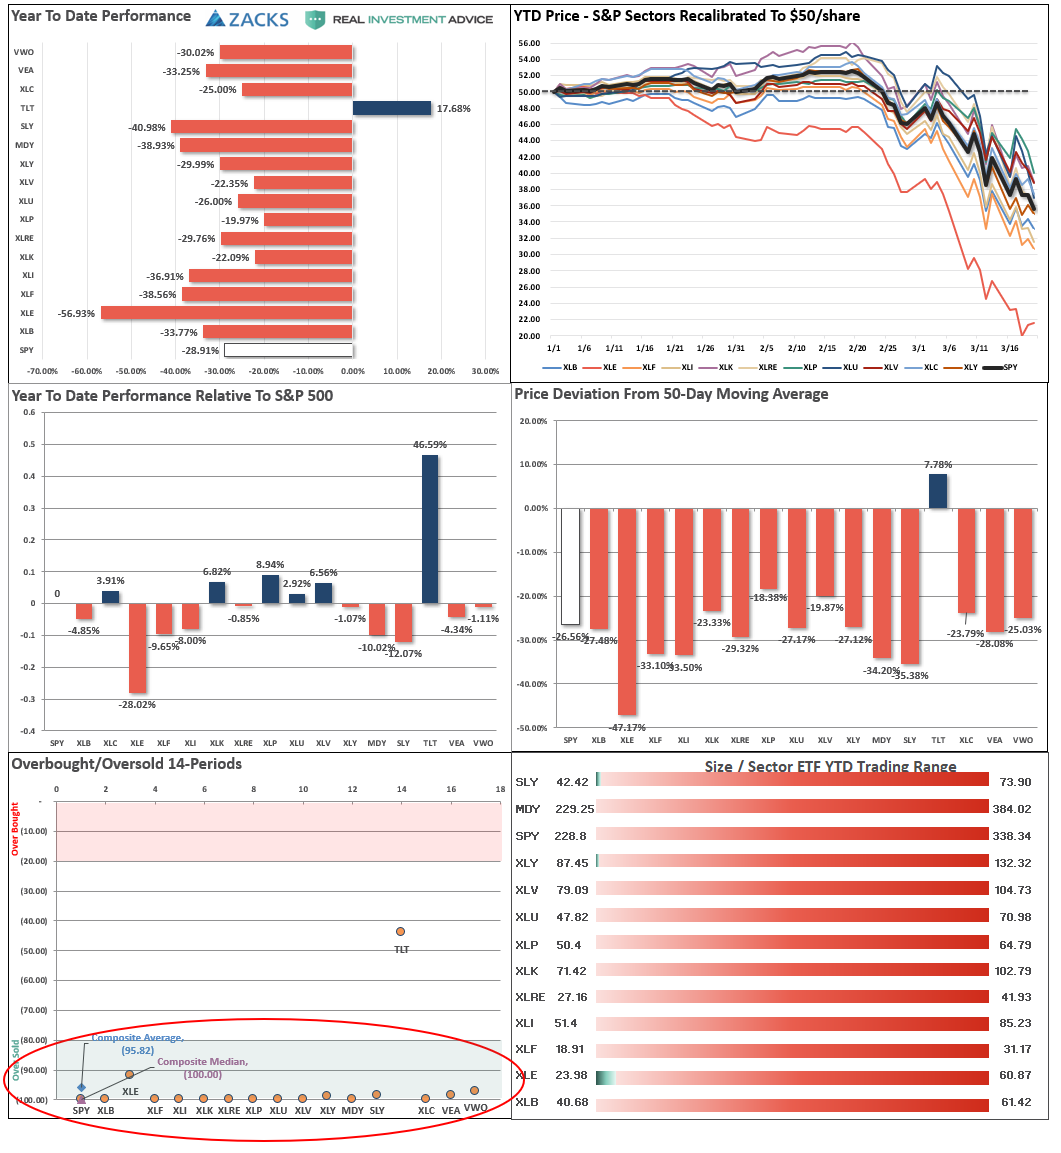
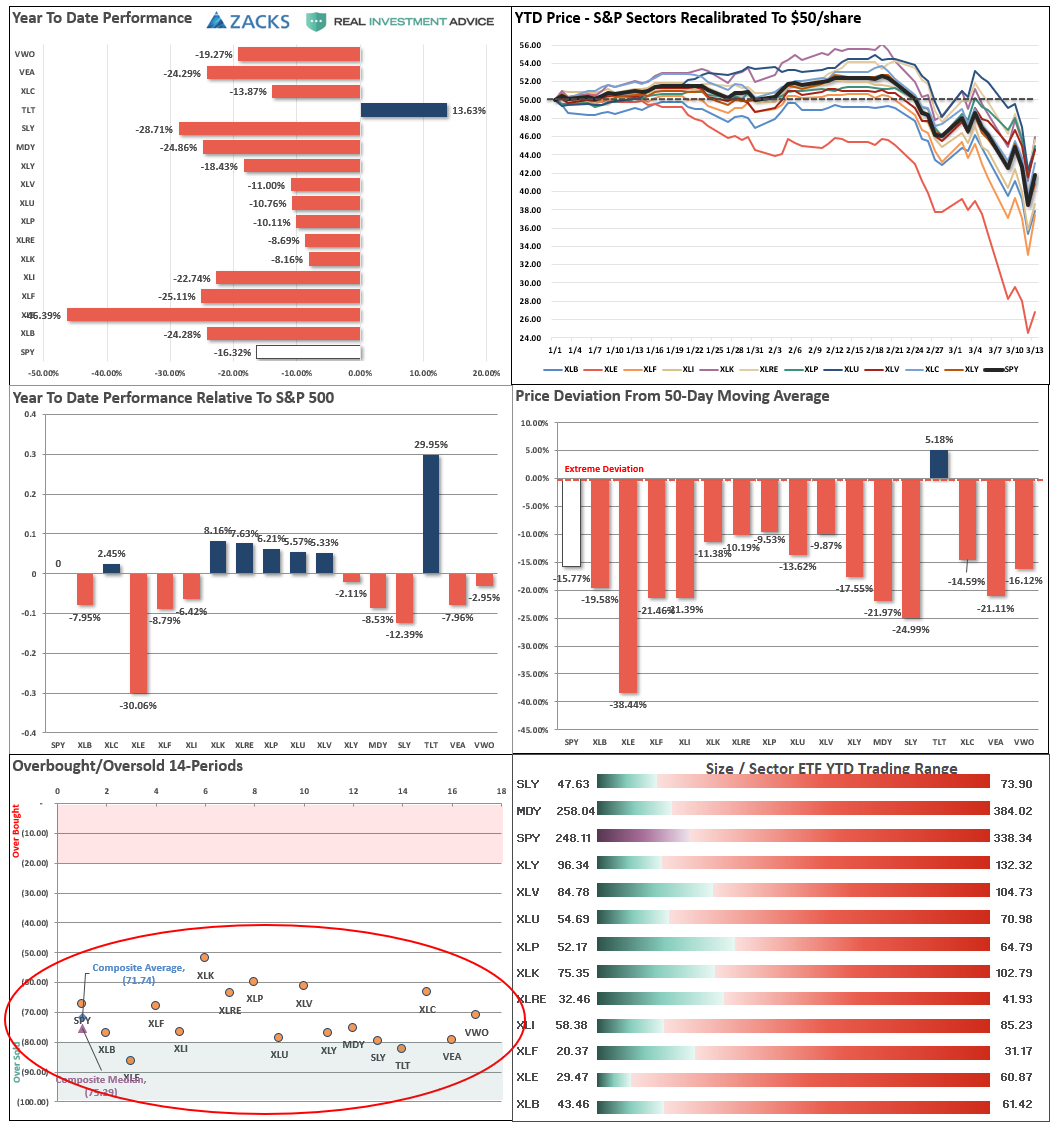
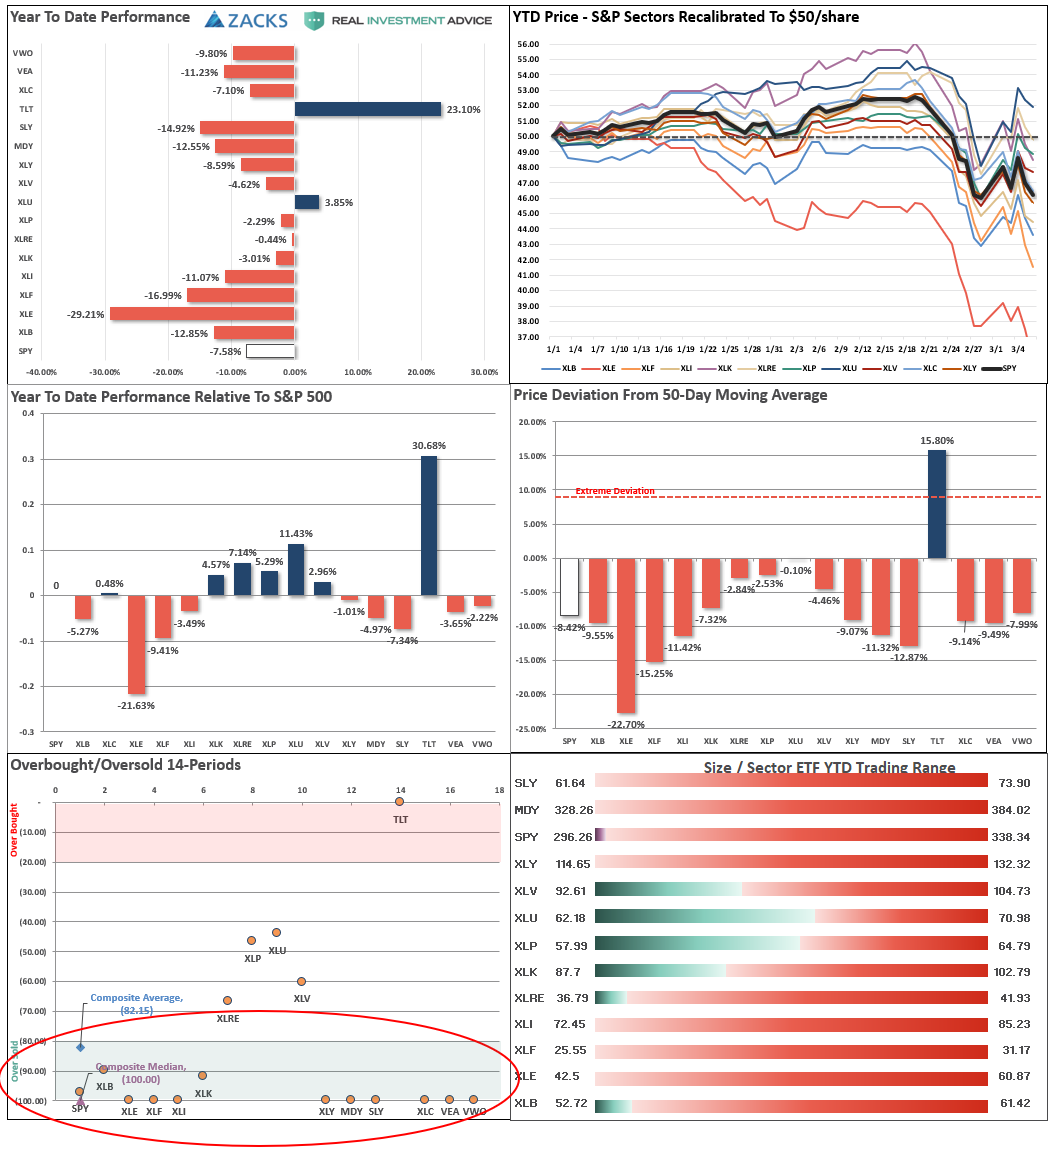
Performance Analysis
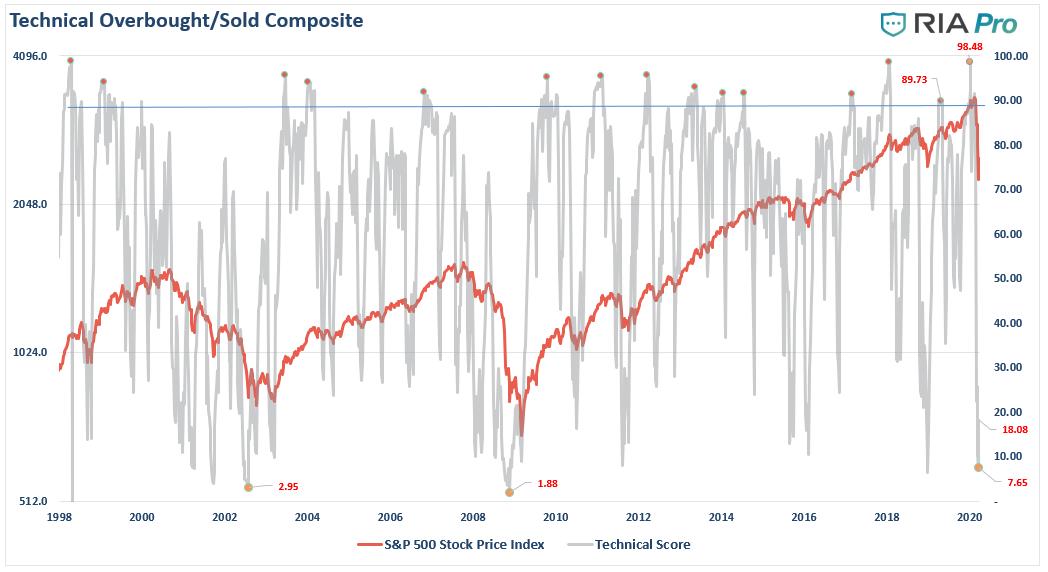
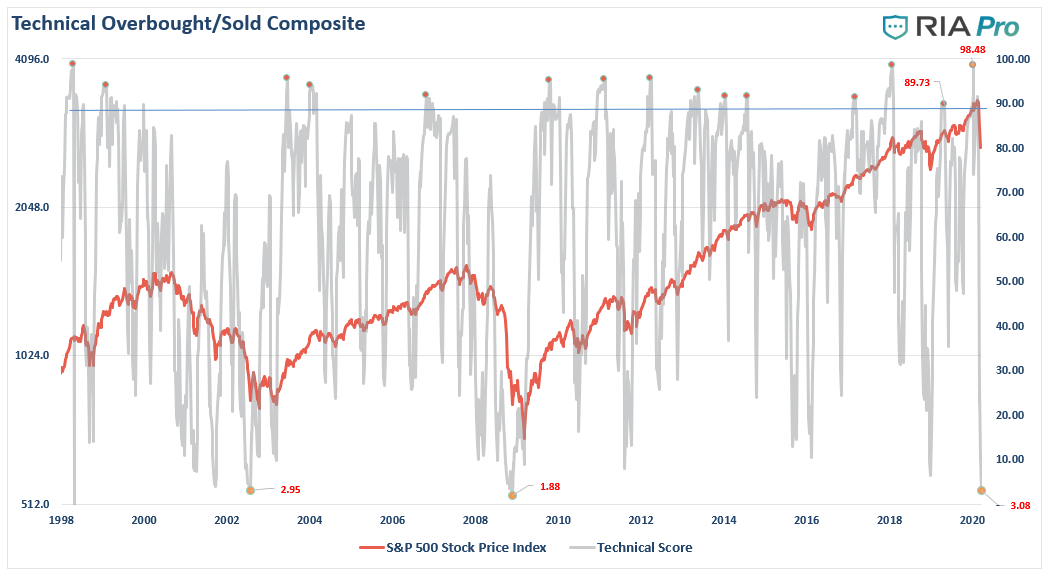
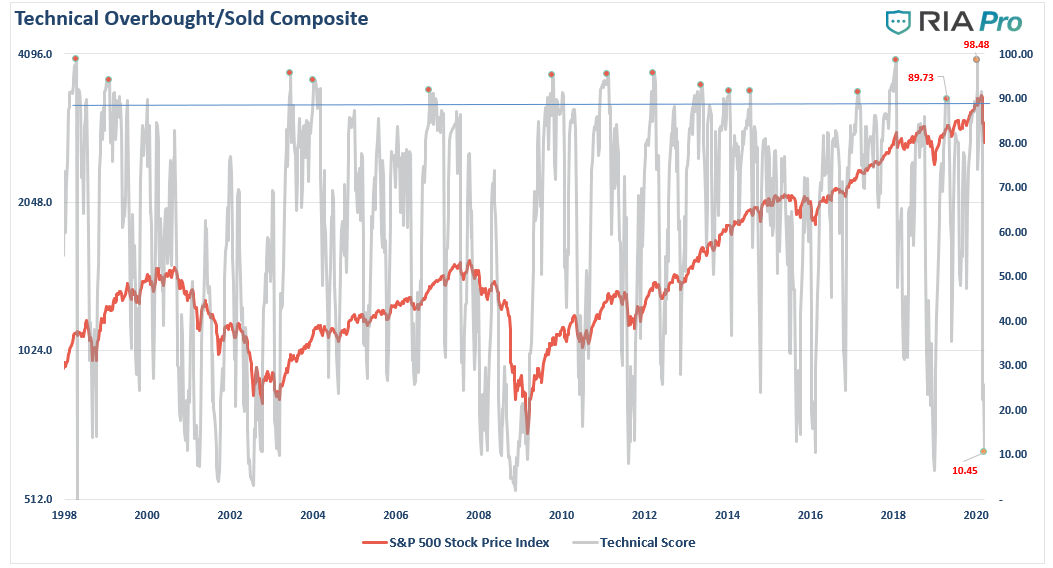
Technical Composite
Note: The technical gauge bounced from the lowest level since both the “Dot.com” and “Financial Crisis.” However, note the gauge bottoms BEFORE the market bottoms. In 2002, lows were retested. In 2008, there was an additional 22% decline in early 2009.
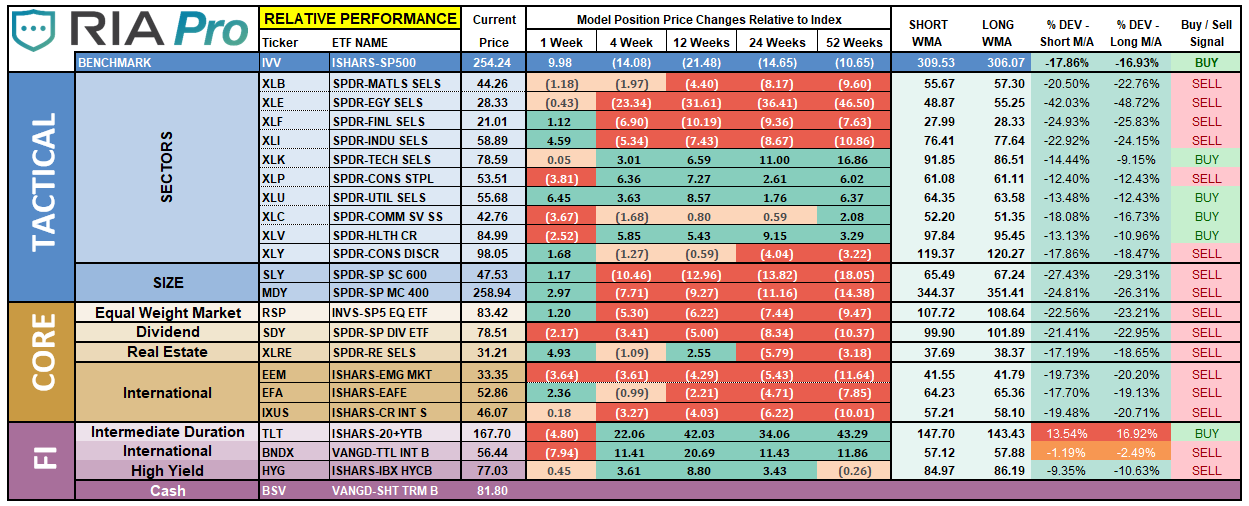
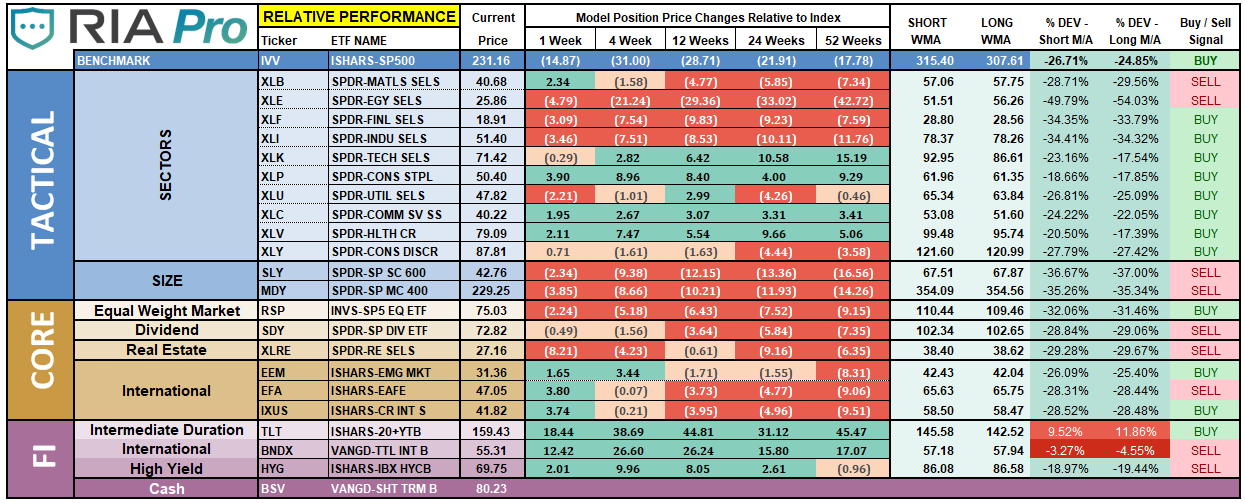
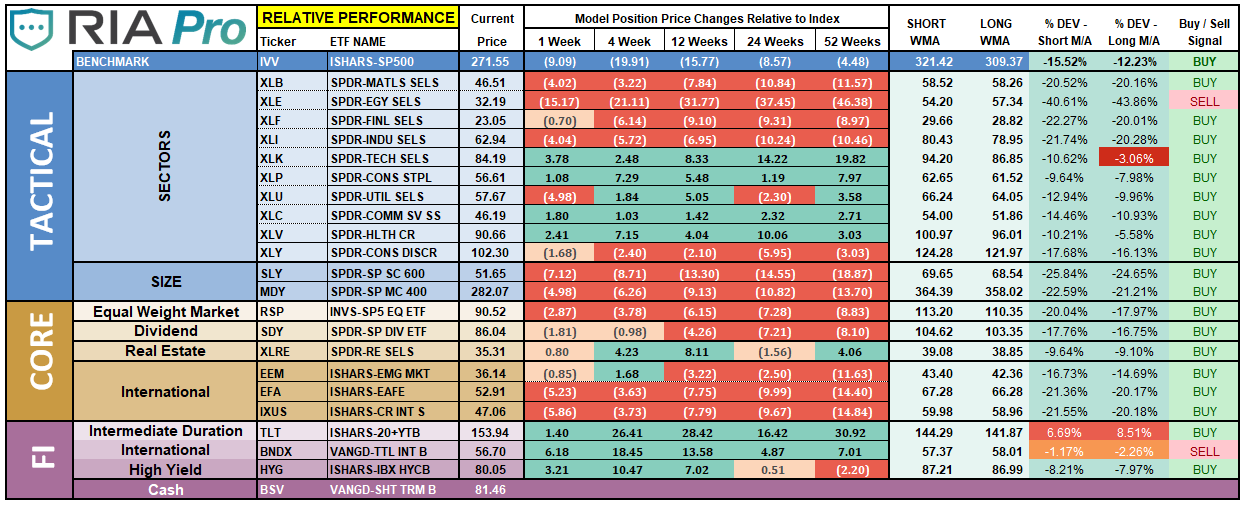
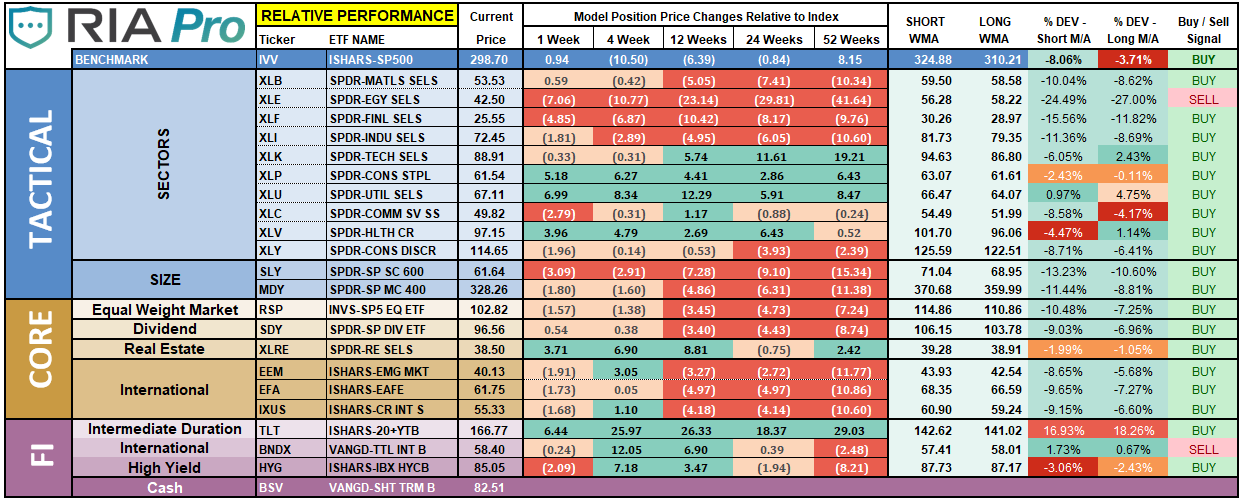
ETF Model Relative Performance Analysis
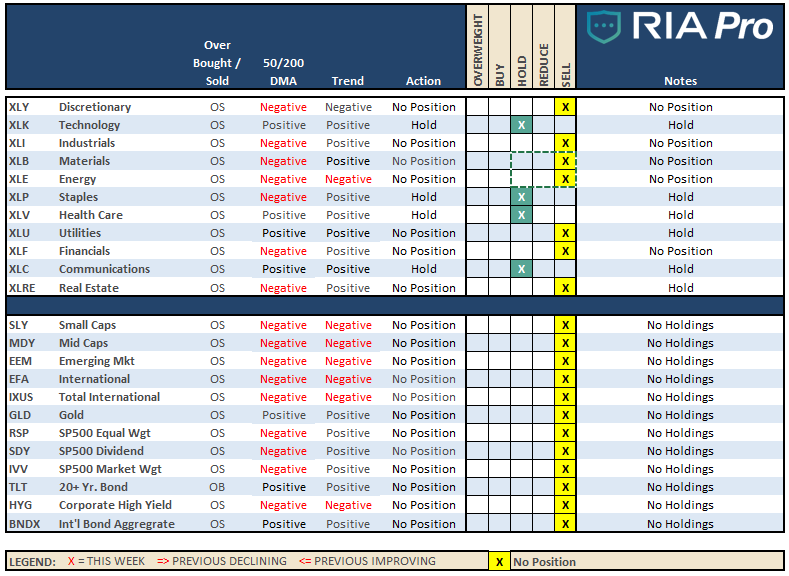
Sector & Market Analysis:
Be sure and catch our updates on Major Markets (Monday) and Major Sectors (Tuesday) with updated buy/stop/sell levels
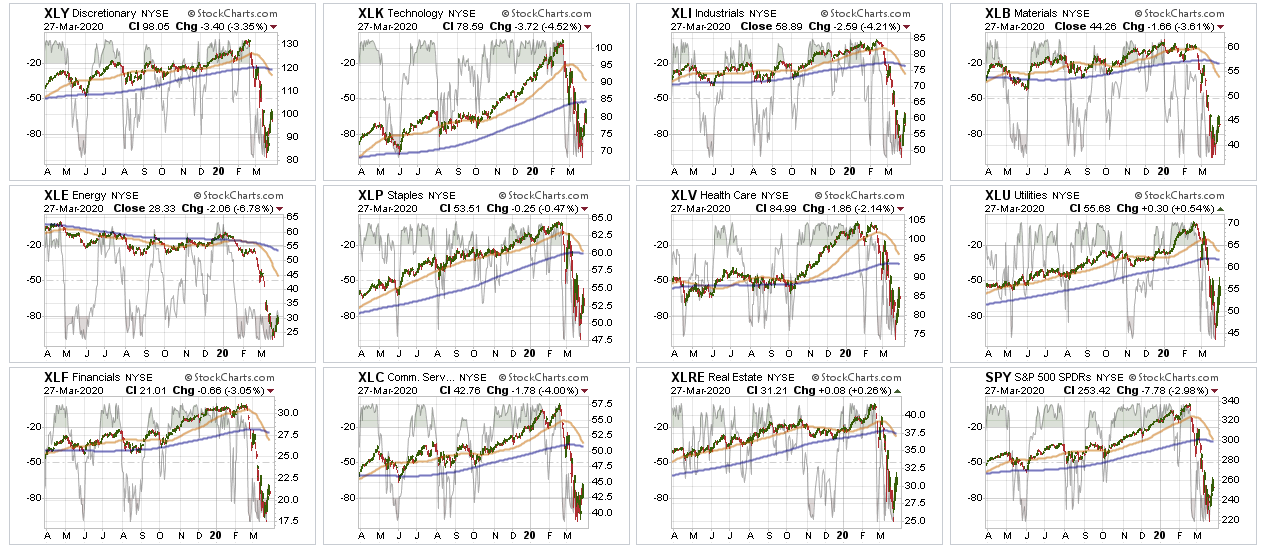
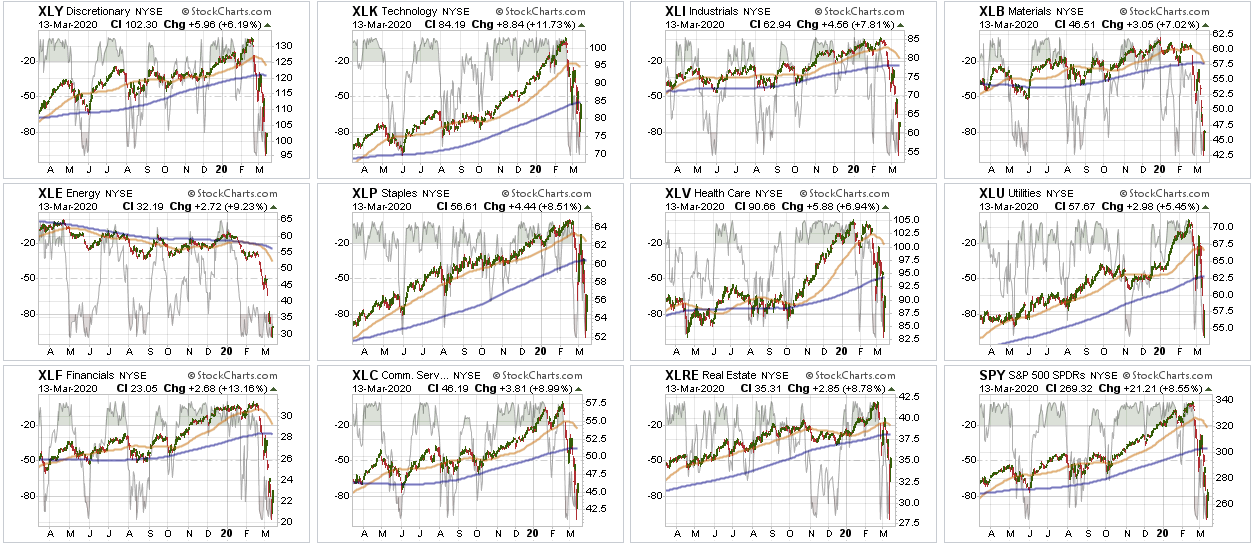
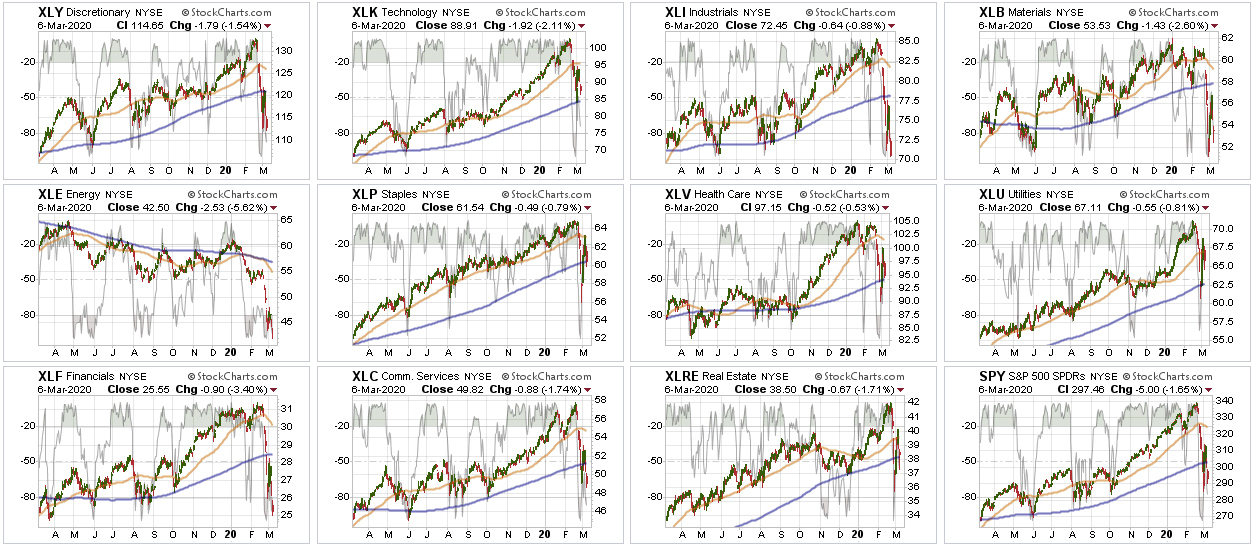
Sector-by-Sector
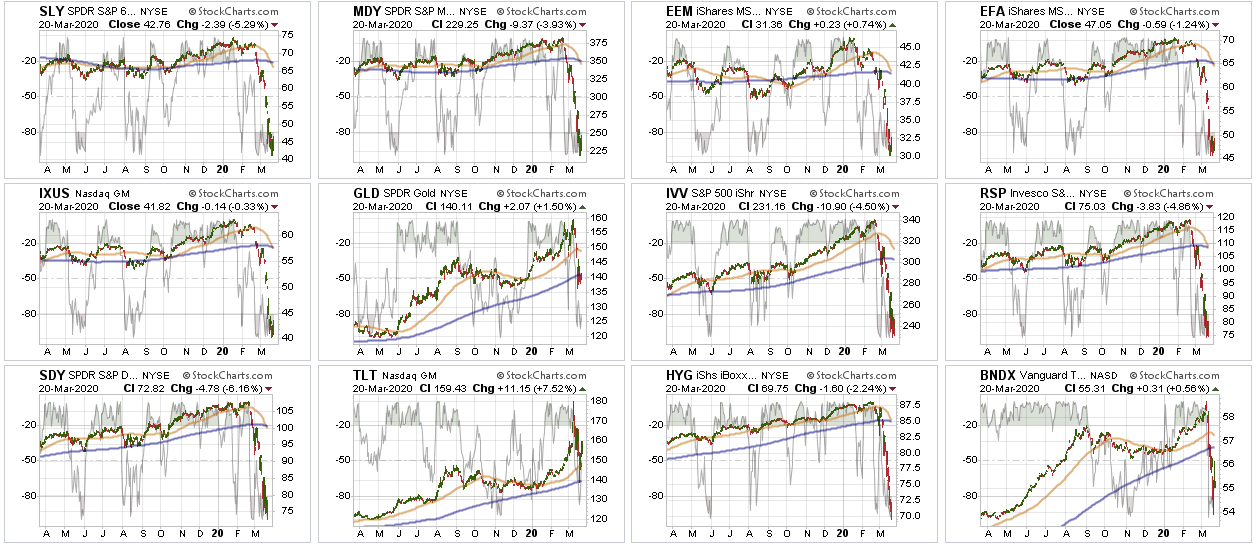
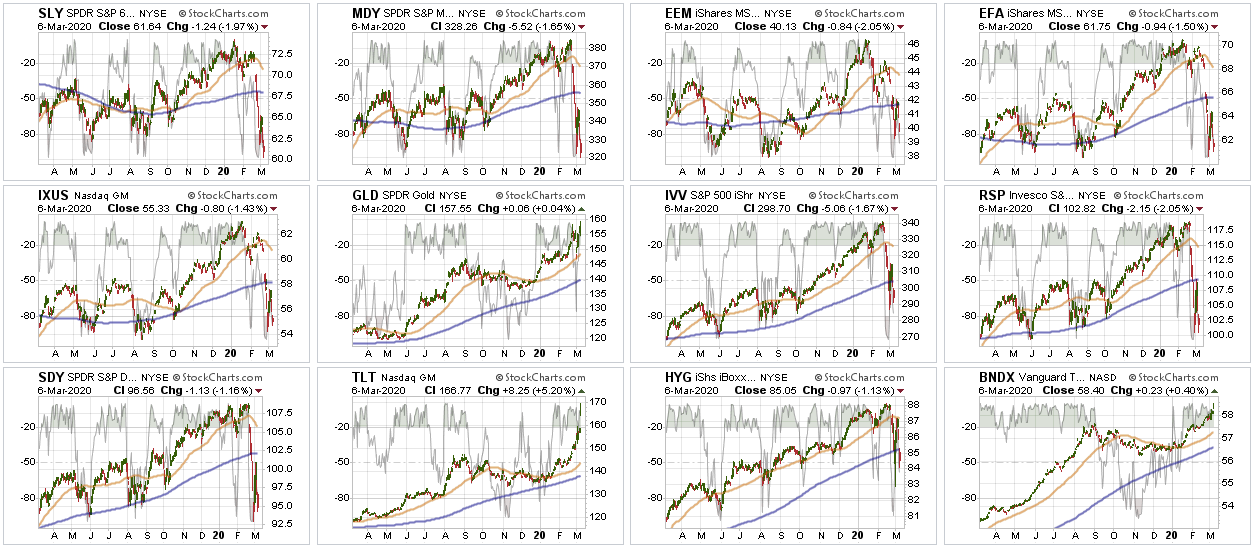
Finally, the markets bounced this past week.
However, don’t get too excited; there has been a tremendous amount of technical damage done which keeps us on the sidelines for now.
Improving – Discretionary (XLY), and Real Estate (XLRE)
We previously reduced our weightings to Real Estate and liquidated Discretionary entirely over concerns of the virus and impact on the economy. No change this week. We are getting more interested in REITs again, but are going to select individual holdings versus the ETF due to leverage concerns in the REITs.
Discretionary is going to remain under pressure due to people being able to go out and shop. This sector will eventually get a bid, so we are watching it, but we need to see an eventual end to the isolation of consumers.
Early last week, we shifted exposures in portfolios and added to our Technology and Communications sectors, bringing them up to weight. We also added QQQ, which was closed out on Friday.
Current Positions: XLK, XLC, 1/2 weight XLP, XLV
Weakening – None
No sectors in this quadrant.
Current Position: None
Lagging – Industrials (XLI), Financials (XLF), Materials (XLB), and Energy (XLE)
No change from last week, with the exception that performance continued to be worse than the overall market.
These sectors are THE most sensitive to Fed actions (XLF) and the shutdown of the economy. We eliminated all holdings in late February and early March.
Current Position: None
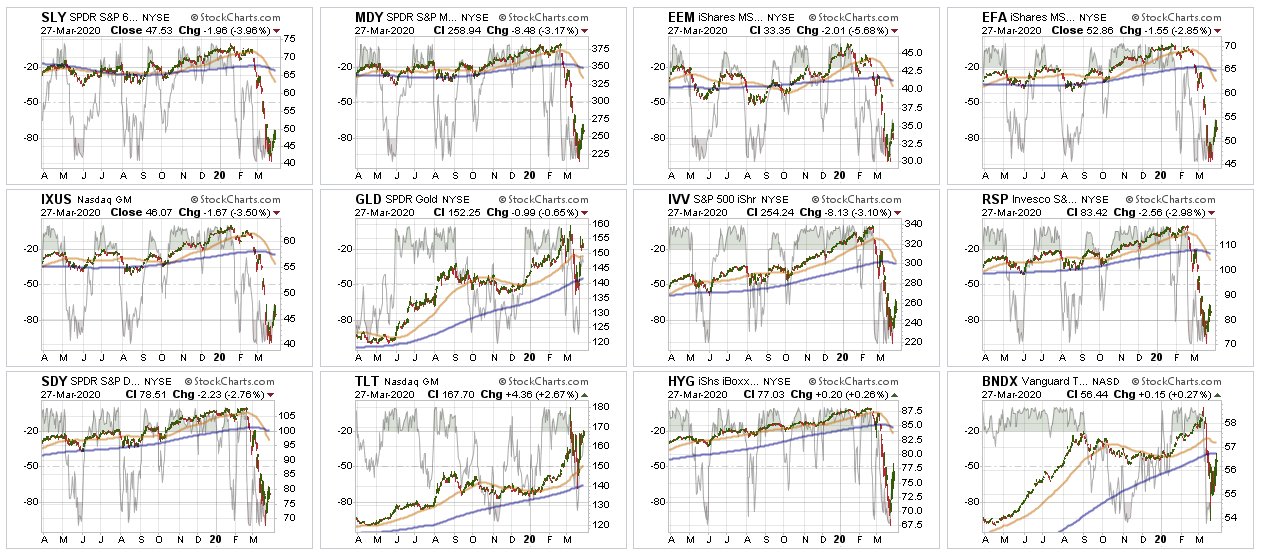
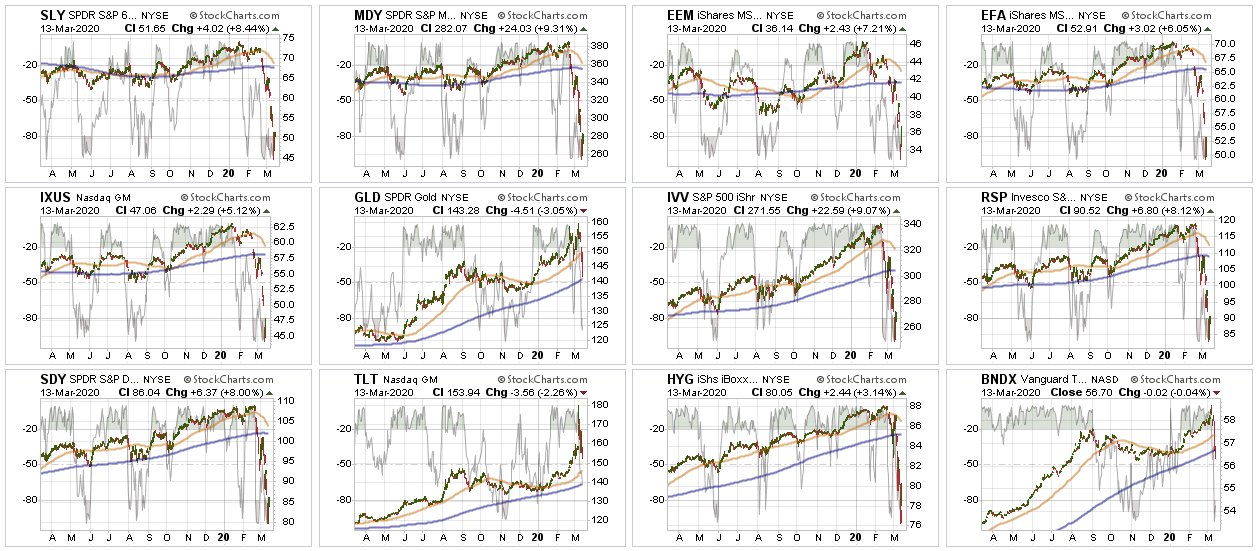
Market By Market
Small-Cap (SLY) and Mid Cap (MDY) – Four weeks ago, we sold all small-cap and mid-cap exposure over concerns of the impact of the coronavirus. We remain out of these sectors for now.
Current Position: None
Emerging, International (EEM) & Total International Markets (EFA)
Same as small-cap and mid-cap. Given the spread of the virus and the impact on the global supply chain. Trading opportunities only.
Current Position: None
S&P 500 Index (Core Holding) – Given the rapid deterioration of the broad market, we sold our entire core position holdings for the safety of cash. We did add a small trading position in QQQ on Monday afternoon, and sold it on Friday.
Current Position: None
Gold (GLD) – We added a small position in GDX recently, and increased our position in IAU early this week. With the Fed going crazy with liquidity, this will be good for gold long-term, so we continue to add to our holdings on corrections.
Bonds regained their footing this week, as the Fed became the “buyer” of both “first” and “last” resort. Simply, “bonds will not be allowed to default,” as the Fed will guarantee payments to creditors. We have now reduced our total bond exposure to 20% of the portfolio from 40% since we are only carrying 10% equity currently. (Rebalanced our hedge.)
Current Positions: SHY, IEF, BIL
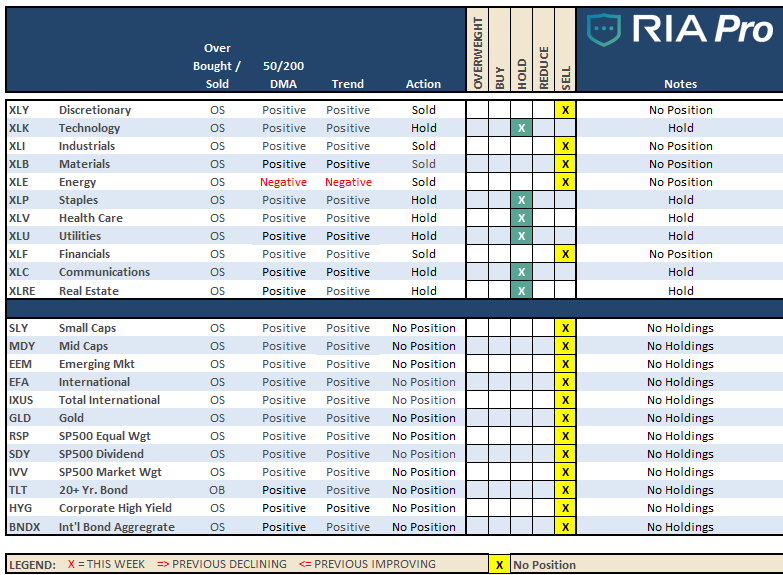
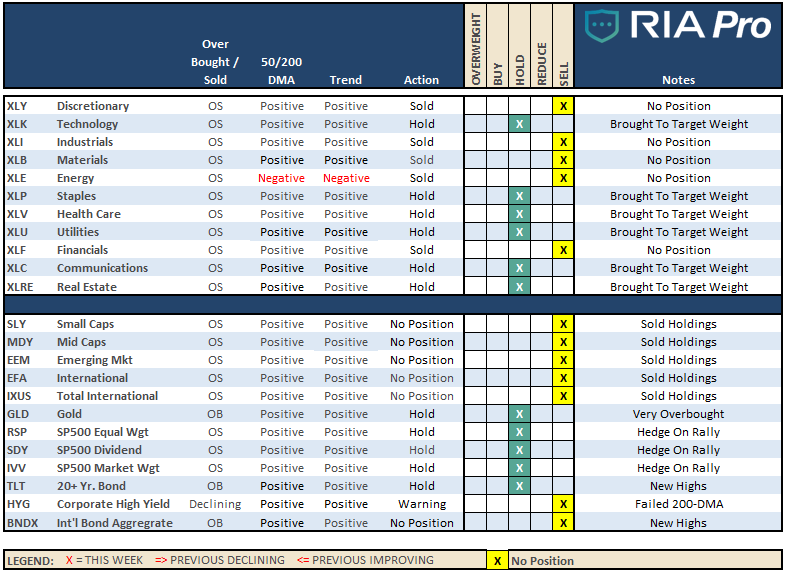
Sector / Market Recommendations
The table below shows thoughts on specific actions related to the current market environment.
(These are not recommendations or solicitations to take any action. This is for informational purposes only related to market extremes and contrarian positioning within portfolios. Use at your own risk and peril.)
Portfolio/Client Update:
Despite the headlines of the “biggest rally in history” this past week, it’s easy to get sucked into the “Media headline” hype. However, let’s put this into some perspective:
Over the last “X” days the S&P 500 is:
5-days: +10.2%
6-days: +5.4%
10-days: -6.25%
It is much less exciting when compared to the fastest 30% plunge in history.
Keeping some perspective on where we are currently is very important. It’s easy to get swayed by the media headlines, which can lead us into making emotional investment mistakes. More often than not, emotional decisions turn out poorly.
We are starting our process of adding equities to the ETF models. As we head out of this bear market, ETF’s will have less value relative to our selective strategies.
This doesn’t mean we won’t use ETF’s at all, but we will selectively use them to fill in gaps to our individual equity selection, or for short-term trading opportunities.
Such was the case on Monday when we took on a position in QQQ for a bounce, and was subsequently closed out on Friday.
We also added small holdings of CLX and MRK to our long-term equity portfolio, as well as increased our exposure to IAU.
We continue to remain very defensive, and are in an excellent position with plenty of cash, reduced bond holdings, and minimal equity exposure in companies we want to own for the next 10-years.
We are just patiently waiting for the right opportunity to buy large chunks of these holdings with both stable, and higher yields.
Let me repeat from last week:
The ONLY people who care more about your money than you, is all of us at RIA Advisors.
We will NOT “buy the bottom” of the market. We will buy when we SEE the bottom of the market is in and risk/reward ratios are clearly in our favor.
This has been THE fastest bear market in history. We are doing our best to preserve your capital so that you meet your financial goals. Bear markets are never fun, but they are necessary for future gains.
We’ve got this.
Please don’t hesitate to contact us if you have any questions, or concerns.
Lance Roberts
CIO
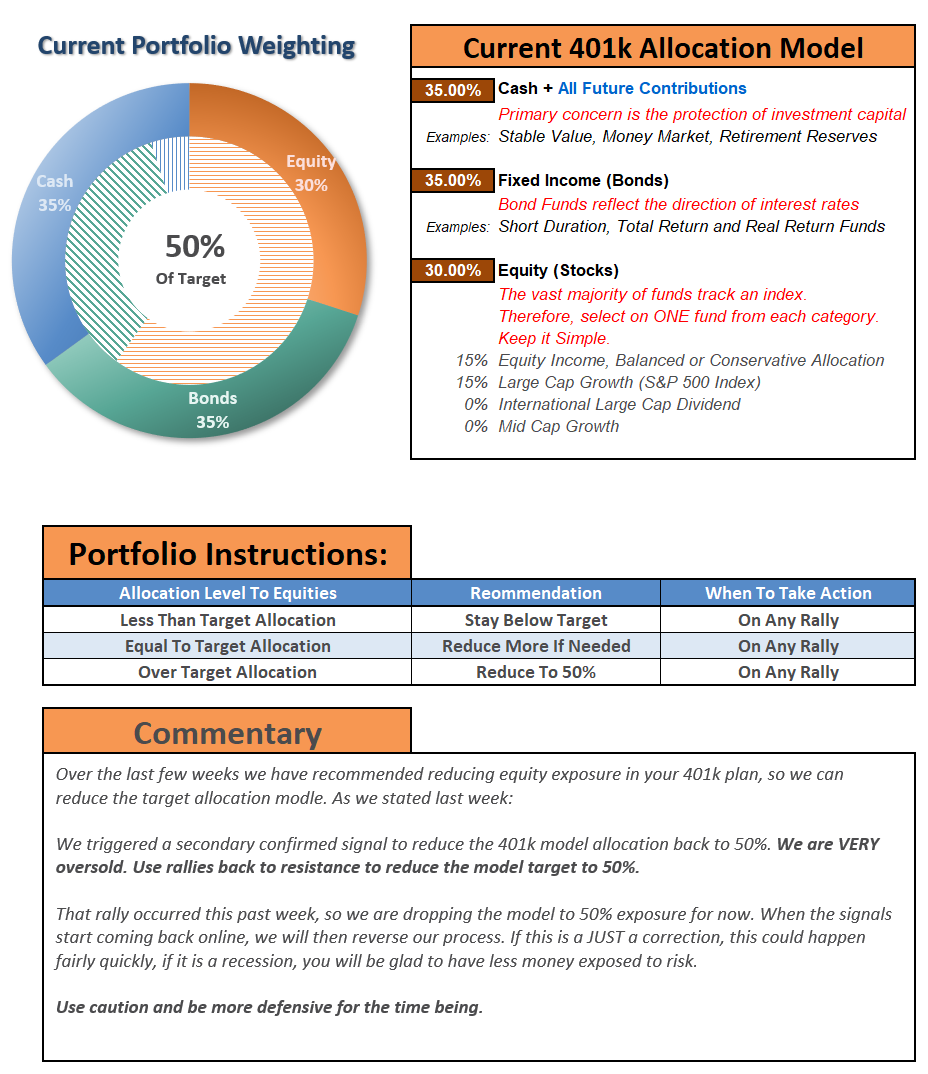
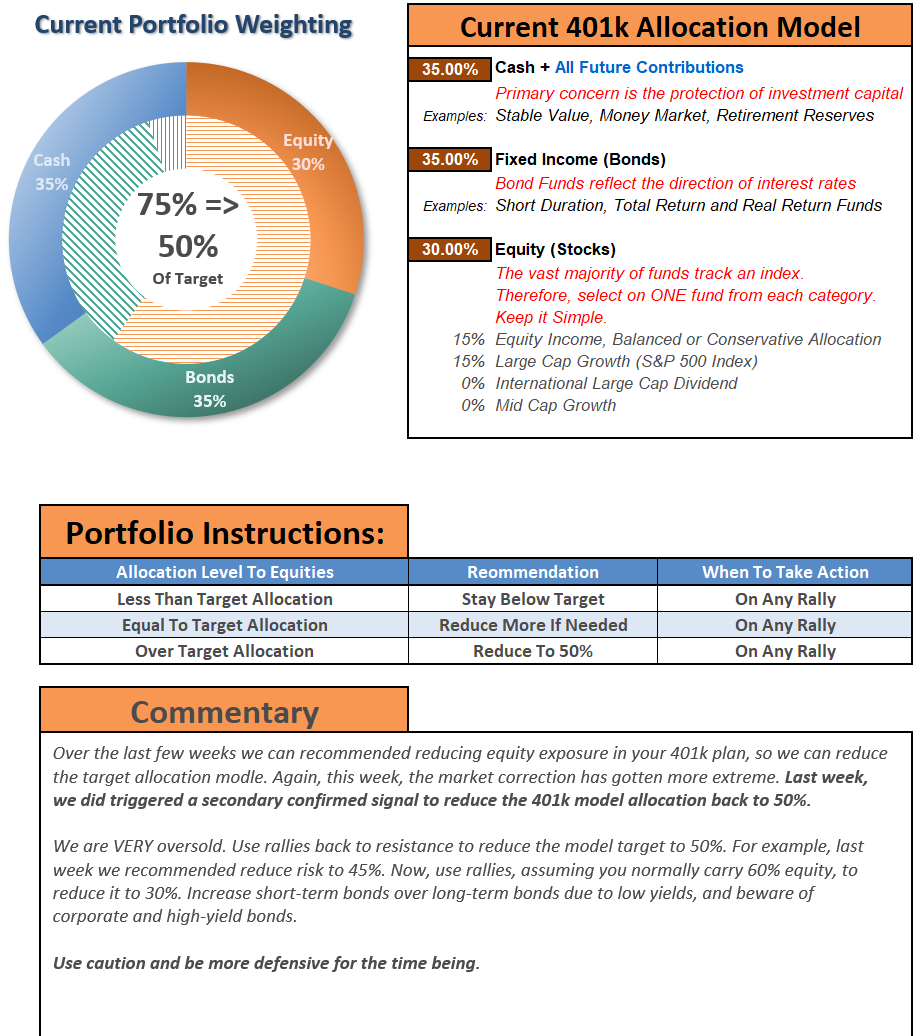
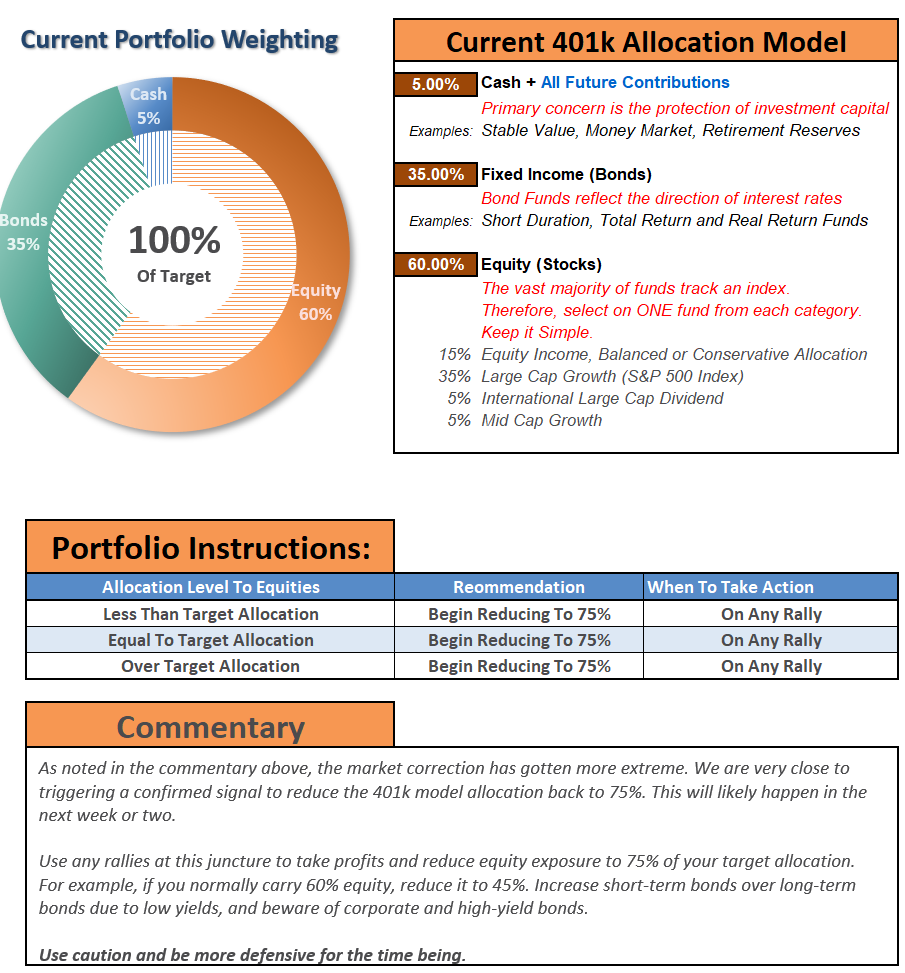
THE REAL 401k PLAN MANAGER
A Conservative Strategy For Long-Term Investors
Model performance is based on a two-asset model of stocks and bonds relative to the weighting changes made each week in the newsletter. This is strictly for informational and educational purposes only and should not be relied upon for any reason. Past performance is not a guarantee of future results. Use at your own risk and peril.
401k Plan Manager Live Model
As an RIA PRO subscriber(You get your first 30-days free) you have access to our live 401k p
The code will give you access to the entire site during the 401k-BETA testing process, so not only will you get to help us work out the bugs on the 401k plan manager, you can submit your comments about the rest of the site as well.
We are building models specific to company plans. So, if you would like to see your company plan included specifically, send me the following:
Name of the company
Plan Sponsor
A print out of your plan choices. (Fund Symbol and Fund Name)
If you would like to offer our service to your employees at a deeply discounted corporate rate, please contact me.
The “2020 SOCIALLY DISTANT INVESTMENT SUMMIT” is coming on Thursday, April 2nd.
Click the link below to receive an email with a special “invitation only” link when the summit goes “live.” (Current newsletter subscribers are already registered.)
“From a purely technical basis, the extreme downside extension, and potential selling exhaustion, has set the markets up for a fairly strong reflexive bounce. This is where fun with math comes in.
As shown in the chart below, after a 35% decline in the markets from the previous highs, a rally to the 38.2% Fibonacci retracement would encompass a 20% advance.
Such an advance will ‘lure’ investors back into the market, thinking the ‘bear market’ is over.”
Chart Updated Through Friday
Not surprisingly, here were the headlines, almost exactly as we wrote them:
Well, you get the idea.
While it was indeed a sharp “reflex rally,” and expected, “bear markets” are not resolved in a single month. More importantly, “bear markets” only end when “NO ONE wants to buy it.”
Fed Can’t Fix It
As noted above, the “bear market” will NOT be over until the credit market is fixed. We are a long way from that being done, given the blowout in yields currently occurring.
The Fed has cut rates by 150 basis points to near zero and run through its entire 2008 crisis handbook.
That wasn’t enough to calm markets, though — so the central bank also announced $1 trillion a day in repurchase agreements and unlimited quantitative easing, which includes a hard-to-understand $625 billion of bond-buying a week going forward. At this rate, the Fed will own two-thirds of the Treasury market in a year.
But it’s the alphabet soup of new programs that deserve special consideration, as they could have profound long-term consequences for the functioning of the Fed and the allocation of capital in financial markets. Specifically, these are:
CPFF (Commercial Paper Funding Facility) – buying commercial paper from the issuer.
PMCCF (Primary Market Corporate Credit Facility) – buying corporate bonds from the issuer.
SMCCF (Secondary Market Corporate Credit Facility) – buying corporate bonds and bond ETFs in the secondary market.
MSBLP (Main Street Business Lending Program) – Details are to come, but it will lend to eligible small and medium-sized businesses, complementing efforts by the Small Business Association.
To put it bluntly, the Fed isn’t allowed to do any of this.”
However, on Friday, the Federal Reserve ran into a problem, which could poses a risk for the markets going forward. As Jim noted, the mind-boggling pace of bond purchases quickly hit the limits of what was available to pledge for collateral.
Or rather, the Fed’s “unlimited QE,” may not be so “unlimited” after all.
The consequence is the Fed is already having to start cutting back on its QE program. That news fueled the late-day sell-off Friday afternoon. (Charts courtesy of Zerohedge)
While Congress did pass the “CARES” act on Friday, it will do little to backstop what is about to happen to the economy for two primary reasons:
The package will only support the economy for up to two months. Unfortunately, there is no framework for effective and timely deployment; firms are already struggling to pay rents, there are pockets of funding stress in credit markets as default risks build, and earnings guidance is abandoned.
The unprecedented uncertainty facing financial markets on the duration of social distancing, the depth of the economic shock and when the infection rate curve will flatten, and there are many unknowns which will further undermine confidence.
Both of these points are addressed in this week’s Macroview but here are the two salient points to support my statement:
“Most importantly, as shown below, the majority of businesses will run out of money long before SBA loans, or financial assistance, can be provided. This will lead to higher and longer-duration of, unemployment.”
“While there is much hope that the current ‘economic shutdown’ will end quickly, we are still very early in the infection cycle relative to other countries. Importantly, we are substantially larger than most, and on a GDP basis, the damage will be worse.”
What the cycle tells us is that jobless claims, unemployment, and economic growth are going to worsen materially over the next couple of quarters.
The problem with the current economic backdrop, and mounting job losses, is the vast majority of American’s were woefully unprepared for any type of disruption to their income going into the recession. As job losses mount, a virtual spiral in the economy begins as reductions in spending put further pressures on corporate profitability. Lower profits leads to higher unemployment and lower asset prices until the cycle is complete.
The long term bull pattern that existed since the 3/9/09 is over. That means the pattern of investors confidently buying every decline is over.
The market became historically oversold on 3/23 using many metrics, and that oversold condition coincided with the long term support area of S&P 500 2110-2180.
The short-covering and rebalancing had a lot to do with the size and speed of the 3-day rally. Also, we know the lack of ETF liquidity played a huge role as well as algorithmic trading.
Technically the market can still go up 6.9% higher from here to hit the 50% retracement level (3386 – 2237 = 1149/2 = 574 + 2237 = 2811….2811/2630 = +6.9%.) I would not bet on it.
The market only sustains a rally once there is light at the Coronavirus tunnel.
I do not think the S&P 500 will hit a new high this year. Maybe not in 2021, either.
His analysis agrees with our own, which we discussed with you last week.
“The good news is the markets are now more extremely oversold on a variety of measures than at just about any other point in history.
Warning: Any reversal will NOT BE the bear market bottom. It will be a ‘bear market’ rally you will want to ‘sell’ into. The reason is there are still many investors trapped in ‘buy and hold’ and ‘passive indexing’ strategies that are actively seeking an exit. Any rallies will be met with redemptions.
Most importantly, all of our long-term weekly ‘sell signals’ have now been triggered. Such would suggest that a rally back to the ‘bullish trend line’ from 2009 will likely be the best opportunity to ‘sell’ before the ‘bear market’ finds its final low.”
Last week’s chart updated through Friday’s close.
While the recent lows may indeed turn out to be “the bottom,” I highly suspect they won’t. Given the sell signals have been registered at such high levels, the time, and distance, needed to reverse the excesses will require a deeper market draw.
As Jeff Hirsch from Stocktrader’s Alamanc noted:
“While we are all rooting for the market to find support here so much damage has been done. A great deal of uncertainty remains for the economy and health crisis. This looks like a bear market bounce.
History suggests that we are in for some tough sledding in the market this year with quite a bit of chop. When the January Barometer came in with a negative reading, our outlook for 2020 began to diminish as every down January since 1950 has been followed by a new or continuing bear market, a 10% correction, or a flat year. Then another warning sign flashed when DJIA closed below its December closing low on February 26, 2020 as the impact of this novel coronavirus began to take its toll on Wall Street.
In the March Outlook, we presented this graph of the composite seasonal pattern for the 22 years since 1950 when both the January Barometer as measured by the S&P 500 were down, and the Dow closed below its previous December closing low in the first quarter. Below is a graph of DJIA, S&P 500 and NASDAQ Composite for 2020 year-to-date as of the close on March 25. Comparing 2020 market action to these 22 years, suggests a choppy year ahead with the potential for several tests of the recent low.”
“The depth of this waterfall decline may be too deep for the market to rebound quickly. This bear market also put this year’s Best Six Months (November-April) at risk of being negative. The record of down Best Six Months is not encouraging and it reminds us of a salient quote from the Almanac from an old market sage,
‘If the market does not rally, as it should during bullish seasonal periods, it is a sign that other forces are stronger and that when the seasonal period ends those forces will really have their say.’— Edson Gould (Stock market analyst, Findings & Forecasts, 1902-1987)'”
On a short-term basis, the market is also suggesting some risk. The daily chart below shows the market rallied to, and failed at, the first level of the Fibonacci retracement we outlined last week, suggesting profits be taken at this level. While there are two remaining targets for the bear market rally, the probabilities weigh heavily against them. (This doesn’t mean they can’t be achieved, it is “possible,” just not “probable.”)
Furthermore, with the “Death Cross” triggering on Friday (the 50-dma crossing below the 200-dma), this will put further downside pressure on any “bear market” advance from current levels.
Given the magnitude, and multiple confirmations, of these signals, it is far too soon to assume the “bear market” is over. This is particularly the case, given the sell-off is less than one-month-old.
Bear markets, and recessions, tend to last 18-months on average.
The current bear market and recession are not the results of just the “coronavirus” shock. It is the result of many simultaneous shocks from:
Economic disruption
Surging unemployment
Oil price shock
Collapsing consumer confidence, and
Most importantly, a “credit event.”
We likely have more to go before we can safely assume we have turned the corner.
In the meantime, use rallies to raise cash. Don’t worry about trying to “buy the bottom.”There will be plenty of time to see “THE” bottom is in, and having cash will allow you to “buy stocks” from the last of the “weak hands.”
The MacroView
If you need help or have questions, we are always glad to help. Just email me.
See You Next Week
By Lance Roberts, CIO
Market & Sector Analysis
Data Analysis Of The Market & Sectors For Traders
S&P 500 Tear Sheet
Performance Analysis
Technical Composite
Note: The technical gauge bounced from the lowest level since both the “Dot.com” and “Financial Crisis.” However, note the gauge bottoms BEFORE the market bottoms. In 2002, lows were retested. In 2008, there was an additional 22% decline in early 2009.
ETF Model Relative Performance Analysis
Sector & Market Analysis:
Be sure and catch our updates on Major Markets (Monday) and Major Sectors (Tuesday) with updated buy/stop/sell levels
Sector-by-Sector
Finally, the markets bounced this past week.
However, don’t get too excited; there has been a tremendous amount of technical damage done which keeps us on the sidelines for now.
Improving – Discretionary (XLY), and Real Estate (XLRE)
We previously reduced our weightings to Real Estate and liquidated Discretionary entirely over concerns of the virus and impact on the economy. No change this week. We are getting more interested in REITs again, but are going to select individual holdings versus the ETF due to leverage concerns in the REITs.
Discretionary is going to remain under pressure due to people being able to go out and shop. This sector will eventually get a bid, so we are watching it, but we need to see an eventual end to the isolation of consumers.
Early last week, we shifted exposures in portfolios and added to our Technology and Communications sectors, bringing them up to weight. We also added QQQ, which was closed out on Friday.
Current Positions: XLK, XLC, 1/2 weight XLP, XLV
Weakening – None
No sectors in this quadrant.
Current Position: None
Lagging – Industrials (XLI), Financials (XLF), Materials (XLB), and Energy (XLE)
No change from last week, with the exception that performance continued to be worse than the overall market.
These sectors are THE most sensitive to Fed actions (XLF) and the shutdown of the economy. We eliminated all holdings in late February and early March.
Current Position: None
Market By Market
Small-Cap (SLY) and Mid Cap (MDY) – Four weeks ago, we sold all small-cap and mid-cap exposure over concerns of the impact of the coronavirus. We remain out of these sectors for now.
Current Position: None
Emerging, International (EEM) & Total International Markets (EFA)
Same as small-cap and mid-cap. Given the spread of the virus and the impact on the global supply chain. Trading opportunities only.
Current Position: None
S&P 500 Index (Core Holding) – Given the rapid deterioration of the broad market, we sold our entire core position holdings for the safety of cash. We did add a small trading position in QQQ on Monday afternoon, and sold it on Friday.
Current Position: None
Gold (GLD) – We added a small position in GDX recently, and increased our position in IAU early this week. With the Fed going crazy with liquidity, this will be good for gold long-term, so we continue to add to our holdings on corrections.
Bonds regained their footing this week, as the Fed became the “buyer” of both “first” and “last” resort. Simply, “bonds will not be allowed to default,” as the Fed will guarantee payments to creditors. We have now reduced our total bond exposure to 20% of the portfolio from 40% since we are only carrying 10% equity currently. (Rebalanced our hedge.)
Current Positions: SHY, IEF, BIL
Sector / Market Recommendations
The table below shows thoughts on specific actions related to the current market environment.
(These are not recommendations or solicitations to take any action. This is for informational purposes only related to market extremes and contrarian positioning within portfolios. Use at your own risk and peril.)
Portfolio/Client Update:
Despite the headlines of the “biggest rally in history” this past week, it’s easy to get sucked into the “Media headline” hype. However, let’s put this into some perspective:
Over the last “X” days the S&P 500 is:
5-days: +10.2%
6-days: +5.4%
10-days: -6.25%
It is much less exciting when compared to the fastest 30% plunge in history.
Keeping some perspective on where we are currently is very important. It’s easy to get swayed by the media headlines, which can lead us into making emotional investment mistakes. More often than not, emotional decisions turn out poorly.
We are continuing our process of blending the Equity and ETF models. As we head out of this bear market, ETF’s will have much less value relative to our selective strategies.
This doesn’t mean we won’t use ETF’s at all, but we will selectively use them to fill in gaps to our individual equity selection, or for short-term trading opportunities.
Such was the case on Monday when we took on a position in QQQ for a bounce, and was subsequently closed out on Friday.
We also added small holdings of CLX and MRK to our long-term portfolio, as well as increased our exposure to IAU.
We continue to remain very defensive, and are in an excellent position with plenty of cash, reduced bond holdings, and minimal equity exposure in companies we want to own for the next 10-years.
We are just patiently waiting for the right opportunity to buy large chunks of these holdings with both stable, and higher yields.
Let me repeat from last week:
The ONLY people who care more about your money than you, is all of us at RIA Advisors.
We will NOT “buy the bottom” of the market. We will buy when we SEE the bottom of the market is in and risk/reward ratios are clearly in our favor.
This has been THE fastest bear market in history. We are doing our best to preserve your capital so that you meet your financial goals. Bear markets are never fun, but they are necessary for future gains.
We’ve got this.
Please don’t hesitate to contact us if you have any questions, or concerns.
Lance Roberts
CIO
THE REAL 401k PLAN MANAGER
A Conservative Strategy For Long-Term Investors
Model performance is based on a two-asset model of stocks and bonds relative to the weighting changes made each week in the newsletter. This is strictly for informational and educational purposes only and should not be relied upon for any reason. Past performance is not a guarantee of future results. Use at your own risk and peril.
401k Plan Manager Live Model
As an RIA PRO subscriber(You get your first 30-days free) you have access to our live 401k p
The code will give you access to the entire site during the 401k-BETA testing process, so not only will you get to help us work out the bugs on the 401k plan manager, you can submit your comments about the rest of the site as well.
We are building models specific to company plans. So, if you would like to see your company plan included specifically, send me the following:
Name of the company
Plan Sponsor
A print out of your plan choices. (Fund Symbol and Fund Name)
If you would like to offer our service to your employees at a deeply discounted corporate rate, please contact me.
#WhatYouMissed On RIA This Week: 03-27-20
We know you get busy and don’t check our website as often as you might like. Plus, with so much content being pushed out every week from the RIA Team, we thought we would send you a weekly synopsis of everything you might have missed.
The 2020 Investment Summit is coming April 2nd. – A “socially distant” investment summit and outlook from our special guests covering the markets, outlook for the economy, and what you should be doing with you money now.
IT’S FREE – But We Need Your Email Address To Send You The Link To This Exclusive Event
Wake me up when one of the companies begging for a bailout tries to issue stock and save themselves.
— Michael Lebowitz, CFA (@michaellebowitz) March 23, 2020
"After a 35% decline in the markets from the previous highs, a rally to the 38.2% Fibonacci retracement would encompass a 20% advance. Such an advance will “lure” investors back into the market, thinking the “bear market” is over."https://t.co/9rTSh0HcVGpic.twitter.com/UbFqF3QnPz
Good synopsis of the Fed's "Kitchen Sink" yesterday. If you don't really don't think we're in a #financialcrisis of rather mass proportions…then I really don't know what to tell you. This is more than just virus/economic issues. @SoberLookpic.twitter.com/Q27n1VIeqm
We all can be tempted to follow the path of least resistance and in a competitive world there are always incentives to get the most bang for the buck. Often this means taking shortcuts to gain some advantage. In a forgiving world, the penalties for such transgressions tend to be small but the rewards can be significant. When conditions are extremely forgiving, shortcuts can become so pervasive that failing to take them can be a competitive disadvantage.
In a less forgiving world, however, the deal gets completely flipped around and penalties can be significant for those who take shortcuts. This will be important for investors to keep in mind as rapidly weakening economic fundamentals and increasing stress in financial markets make for far less forgiving conditions. When things get real, competence and merit matter again – and this is a crucial lesson for investors.
Leaders of companies and organizations normally receive a lot of attention and rightly so; their decisions and behaviors affect a lot people. In the best of situations, leaders can distinguish themselves by creatively finding a “third” way to resolve difficult challenges. In other situations, however, leaders can reveal all-too-human weakness by taking shortcuts, cheating, and acting excessively in their own self-interest.
One of the situations in which these weaknesses can be spotted is in whistleblower incidents. For example, the Financial Times reported on the illuminating experiences of one HR director who in successive jobs was requested to break rules by a boss:
“Told by a senior manager at a FTSE 100 business to rig a pay review to favour his allies, she refused. ‘After that, he did everything to make my life absolute hell,’ she says. Then, at the first opportunity, he fired her, claiming that she was underperforming. Warned that the company would use its resources to fight her all the way if she took legal action, she accepted a pay-off and left’.”
“Her next employer asked her to manipulate the numbers for a statutory reporting requirement to make its performance look better. She refused, signed another non-disclosure agreement and resigned.”
As unfortunate as these experiences were, they were not isolated events. The HR director described such incidents as happening “left, right and centre”. The fact that such cases are extremely hard to prosecute in any meaningful way helps explain why they are so pervasive. Columbia law professor John Coffee describes: “It’s extremely difficult to make a case against the senior executives because they don’t get Involved in operational issues. But they can put extreme pressure on the lower echelons to cut costs or hit targets.”
Company employees aren’t the only ones who risk facing hostility for standing for what they believe is right. Anjana Ahuja reports in the FT that scientists can fall victim to the same abuses. As she points out, “Some are targeted by industry or fringe groups; others, as the Scholars at Risk network points out, by their own governments. The academic freedom to tell inconvenient truths is being eroded even in supposed strong holds of democracy.”
Ahuja noted that the Canadian pharmacist and blogger, Olivier Bernard, was chastised for “interrogating the claim that vitamin C injections can treat cancer.” As a consequence of his efforts, “He endured death threats” and “opponents demanded his sacking.”
In yet another example, Greece’s former chief statistician Andreas Georgiou “has been repeatedly convicted, and acquitted on appeal, of manipulating data.” The rationale for such a harsh response has nothing to do with merit: “statisticians worldwide insist that Mr Georgiou has been victimised for refusing to massage fiscal numbers.” It is simply a higher profile case of refusing to be complicit in wrongdoing.
The lessons from these anecdotes also play out across the broader population. The FT reports:
“According to the [CIPD human resources survey], 28 per cent of HR personnel perceive a conflict between their professional judgment and what their organisation expects of them; the same proportion feel ‘it’s often necessary to compromise ethical values to succeed in their organisation’.”
Employees are all-too familiar with the reality that such compromises may be required simply to survive in an organization and to continue getting health insurance: “Most HR directors know colleagues who have been fired for standing their ground.”
Yet another arena in which expertise and values get compromised is politics. While political rhetoric nearly always involves exaggerations and simplifications, the cost of such manipulations becomes apparent when important issues of public policy are at stake. Bill Blain highlighted this point on Zerohedge:
“It’s as clear as a bell that Trump had no plan to address the Coronavirus before he was finally forced to say something Monday [March 9, 2020]. Until then it was a ‘fake-news’ distraction. He made a political gamble: that the virus would recede before it became a crisis, making him look smart and a market genius for calling it.”
Blain’s assessment illustrates a point that is common to all these examples: Each involves a calculation as to whether it is worth it or not to do the right thing based on merit or to take a shortcut. Each involves an intentional effort to reject/deny/attack positions that are real and valid. Evidence, expertise and professional judgment are foresworn and replaced by narrative, heuristics, and misinformation. While such tactics undermine the long-term success of organizations and societies, they can yield tremendous personal advantages. The good of the whole is sacrificed for the good of the few.
Another point is that these efforts are absolutely pervasive. They can be found across companies, academia, politics, and beyond. They can also be found in countries all across the world. In an important sense, we have been living in an environment of pervasive tolerance of such decisions.
A third point, and the most important one, is that now it is starting to matter. It appears that the real human impact of the coronavirus has shaken many people out of complacency. The types of narratives and misinformation regarding the market that had been accepted suddenly seem woefully out of place when dealing with a real threat to public health. As Janan Ganesh reports in the FT, “This year provides a far less hospitable atmosphere for such hokum than 2016”. He concludes, “Overnight, competence matters.”
True enough, but Ganesh could have gone further. Suddenly, additional traits such as courage, good judgment, and ethical behavior also matter. Overnight, carelessness and complacency have become much more costly.
All these things will become extremely important for investors as well. For example, information sources are crucial for early identification of potential problems and for proper diagnosis. Most mainstream news outlets were slow to report on the threat of the coronavirus even though it was clearly a problem in China in January. By far the best sources on this issue have been a handful of independent researchers and bloggers who have shared their insights publicly.
One form of news that will be interesting to monitor is upcoming earnings reports and conference calls. These events can provide an opportunity to learn about companies as well as to learn about management’s philosophy and decision-making.
Which companies are busily responding to the crisis by scrutinizing their supply chains and developing HR policies to ensure the safety of their employees? Which companies already had these measures in place and are simply executing on them now? Which companies are withdrawing guidance while they frantically try to figure out what’s going on? These responses will reveal a great deal about management teams and business models.
In addition, a much higher premium on merit will also place much higher premia on security analysis, valuation, and risk management. Alluring stories about stocks and narratives about the market can be fun to follow and even compelling. At the end of the day, however, what really matters is streams of cash flows.
Finally, a higher premium on merit is likely to significantly re-order the ranks of advisors and money managers. Those ridiculed as “overly cautious” and “perma bears” will emerge as valuable protectors of capital. Conversely, those arguing that there is no alternative (TINA) to equities will be spending a lot of time trying to pacify (and retain) angry clients who suffer big losses. Further, things like education, training, and experience will re-emerge as necessary credentials for investment professionals.
As the coronavirus continues to spread across the US, things are starting to get real for many investors. Suddenly, the world is appearing less forgiving as it is becoming clear that economic growth will slow substantially for some period of time. This especially exposes the many companies who have binged on debt while rates have been so low. Further, it is becoming increasingly obvious that there is very little the Fed can do with monetary policy to stimulate demand.
While the coronavirus will eventually dissipate, the increasing premium on merit is likely to hang around. The bad news is that in many cases it will be too late to avoid the harm caused by leaders and managers and advisors who exploited favorable conditions for personal advantage. The good news is that there are very competent people out there to make the best of things going forward.
Everyone Wanting To Buy Suggests The Bear Still Prowls (Full Report)
Everyone Wanting To Buy Suggests The Bear Still Prowls
NOTE: During these tumultuous times, we are unlocking our full newsletter to help you navigate the markets safely. Make sure you subscribe to RIAPRO.NET (Free 30-Day Trial) if you want to keep receiving the full report after the storm passes.
Everyone Wanting To Buy Suggests The Bear Still Prowls
“If you own 10% equities, as we do, and the market falls 100%, you will lose 10%. That said, you have 90 cents on the dollar to buy equities for free.” – Michael Lebowitz
For the last several months, we have been issuing repeated warnings about the market. While such comments are often mistaken for “being bearish,” we have often stated it is our process of managing “risk,” which is most important.
Beginning in mid-January, we began taking profits out of our portfolios and reducing risk. To wit:
‘On Friday, we began the orderly process of reducing exposure in our portfolios to take in profits, reduce portfolio risk, and raise cash levels.’
Importantly, we did not ‘sell everything’ and go to cash.
Since then, we took profits and rebalanced risk again in late January and early February as well.
On Friday/Monday, our ‘limits’ were breached, which required us to sell more.”
There are a couple of important things to understand about our current equity exposure.
To begin with, we never go to 100% cash. The reason is that “psychologically” it is too difficult for clients to start “buying” when the market finally bottoms. Seeing the market begin to recover, along with their portfolio, makes it easier to fight the fear the market is “going to zero.”
Secondly, and most importantly, at just 10% in current equity exposure, the market could literally fall 100% and our portfolios would only decline by 10%.(Of course, given we still have 90% of our capital left, we can buy a tremendous amount of “free assets.”)
Of course, the market isn’t going to zero.
However, let’s map out a more realistic example.
In this week’s MacroView, we discussed the “valuation” issue
“If our, and Mr. Rosenberg’s, estimates are correct of a 5-8% recessionary drag in the second quarter of 2020, then an average reduction in earnings of 30% is most likely overly optimistic.
However, here is the math:
Current Earnings = 132.90
30% Reduction = $100 (rounding down for easier math)
At various P/E multiples, we can predict where “fair value” for the market is based on historical assumptions:
20x earnings: Historically high but markets have traded at high valuations for the last decade.
18x earnings: Still historically high.
15x earnings: Long-Term Average
13x earnings: Undervalued
10x earnings: Extremely undervalued but aligned with secular bear market bottoms.
You can pick your own level where you think P/E’s will account for the global recession but the chart below prices it into the market.”
So, let’s assume our numbers are optimistically in the “ballpark” of a valuation reversion, and earnings are only cut by 30% while the market bottoms at 1800, or 18x earnings.(I say optimistically because normal valuation reversions are 15x earnings or less.)
Here’s the math:
For a “buy and hold” investor (who is already down 20-30% from the peak)will lose an additional 22%.
For a client with 10% equity exposure, they will lose an additional 2.2%.
When the market does eventually bottom, and it will, it will be far easier for our clients to recover 10% of their portfolio versus 50% for most “buy and hold” strategies.
As we have often stated, “getting back to even is not an investment strategy.”
Is The Bear Market Over?
This is THE QUESTION for investors. Here are a few articles from the past couple of days:
Bear markets have three stages – sharp down, reflexive rebound and a drawn-out fundamental downtrend – Rule #8
Bear markets often START with a sharp and swift decline.
After this decline, there is an oversold bounce that retraces a portion of that decline.
The longer-term decline then continues, at a slower and more grinding pace, as the fundamentals deteriorate.
Dow Theory also suggests that bear markets consist of three down legs with reflexive rebounds in between.
The chart above shows the stages of the last two primary cyclical bear markets versus today (the 2020 scale has been adjusted to match.)
The answer to the question is simply this:
“When is it time to start buying the market? When you do NOT want to.”
Bond Market Implosion
At the moment, the Federal Reserve is fighting a potentially losing battle – the bond market.
After cutting rates to zero and launching QE of $700 billion – the markets crashed.
The ECB starts an $800 billion QE program, and the markets fail to move.
The Fed injected liquidity into money markets, the credit market, and is buying municipal bonds.
And the market crashed more.
The Fed has literally turned on a “garden hose” to extinguish a literal “bon(d)fire.”
This was no more evident than their action this past week to revive a program from the financial crisis called the Primary Dealer Credit Facility (PDCF) to bailout hedge funds and banks. Via Mike Witney:
“The Fed is reopening its most controversial and despised crisis-era bailout facility, the Primary Dealer Credit Facility. The facility’s real purpose is to transfer the toxic bonds and securities from failing financial institutions and corporations (through an intermediary) onto the Fed’s balance sheet.
The objective of this sleight of hand is to recapitalize big investors who, through their own bad bets, are now either underwater or in deep trouble. Just like 2008, the Fed is now doing everything in its power to save its friends and mop up the ocean of red ink that was generated during the 10-year orgy of speculation that has ended in crashing markets and a wave of deflation. Check out this excerpt from an article at Wall Street on Parade. Here’s an excerpt:
“Veterans on Wall Street think of the PDCF as the cash-for-trash facility, where Wall Street’s toxic waste from a decade of irresponsible trading and lending, will be purged from the balance sheets of the Wall Street firms and handed over to the balance sheet of the Federal Reserve – just as it was during the last financial crisis on Wall Street.”
In other words, the PDCF is a landfill for distressed assets that have lost much of their value and for which there is little or no demand. And, as bad as that sounds, the details about the resuscitated PDCF are much worse.”
If you have any doubt how bad it is in the bond market, just take a look at what happened to both investment grade and junk bond spreads. (Charts courtesy of David Rosenberg)
As they say: “That clearly ain’t normal.”
More importantly, the “Bear Market” won’t be over until the credit markets get fixed.
Hunting The Bear
It was a pretty stunning week in the market. Over the last 5-days, the market declined an astonishing, or should I say breathtaking, 15%. The last time we saw a one week decline of that magnitude was during the “Lehman” crisis. (Of course, with hedge funds blowing up all week, this is precisely what the Fed has been bailing out.)
Since the peak of the market at the end of February, the market is now down a whopping 32%.
Surely, we are close to a bottom?
Let’s revisit our daily and weekly charts for some clues as to where we are, what could happen next, and what actions to take.
On a daily basis, the market is extremely stretched and deviated to the downside. Friday’s selloff smacked of an “Oriental Rug Company” where it was an “Everything Must Go Liquidation Event.”
Remember all those headlines from early this year:
Well….
This selloff completely reversed the entire advance from the 2018 lows. That’s the bad news.
The good news is the markets are now more extremely oversold on a variety of measures than at just about any other point in history.
Such a reversal, particularly given the “speed and magnitude” of the decline, argues for a “reversal” of some sort.
Warning: Any reversal will NOT BE the bear market bottom. It will be a “bear market” rally you will want to “sell” into. The reason is there are still many investors trapped in “buy and hold” and “passive indexing” strategies which are actively seeking an exit. Any rallies will be met with redemptions.
As noted above, bear markets do not end with investors wanting to “buy” the market. They end when “everyone wants to sell.”
And, NO, investors are “not different this time.”
This “bear market” rally scenario becomes more evident when we view our longer-term weekly “sell signals.” As we warned last week:
“With all of our signals now triggered from fairly high levels, it suggests the current selloff is not over as of yet. In other words, we will see a rally, followed by a secondary failure to lower lows, before the ultimate bottom is put in.”
Unfortunately, we have yet to see any attempt at a sustained rally.
More importantly, with the failure of the markets to hold lows this week, both of our long-term weekly “sell signals” have now been triggered. Such would suggest that a rally back to the “bullish trend line” from 2009 will likely be the best opportunity to “sell” before the “bear market” finds its final low.
Where will that low likely be:
Let’s update our mapping from last week:
A retest of current lows that holds is a 27% decline. – Failed
A retest of the 2018 lows, which is most likely, an average recessionary decline of 32.8% – Current
A retest of the 2016 lows, coincident with a “credit event,” would entail a 50.9% decline. – Pending Possibility.
Given the magnitude, and multiple confirmations, of these signals, it is far too soon to assume the “bear market” is over. This is particularly the case, given the selloff is less than one-month old.
Bear markets, and recessions, tend to last 18-months on average.
The current bear market and recession are not the result of just the “coronavirus” shock. It is the result of many simultaneous shocks from:
Economic disruption
Surging unemployment
Oil price shock
Collapsing consumer confidence, and
A “credit event.”
We likely have more to go before we can safely assume we have turned the corner.
In the meantime, use rallies to raise cash. Don’t worry about trying to “buy the bottom.”There will be plenty of time to see “THE” bottom is in, and having cash will allow you to “buy stocks” from the last of the “weak hands.”
The MacroView
If you need help or have questions, we are always glad to help. Just email me.
See You Next Week
By Lance Roberts, CIO
Market & Sector Analysis
Data Analysis Of The Market & Sectors For Traders
S&P 500 Tear Sheet
Performance Analysis
Technical Composite
Note: The technical gauge is now at the lowest level since both the “Dot.com” and “Financial Crisis.” However, note the gauge bottoms BEFORE the market bottoms. In 2002, lows were retested. In 2008, there was an additional 22% decline into early 2009.
ETF Model Relative Performance Analysis
Sector & Market Analysis:
Be sure and catch our updates on Major Markets (Monday) and Major Sectors (Tuesday) with updated buy/stop/sell levels
Sector-by-Sector
For the 3rd week in a row:
“Everything was crushed again this past week, so the difference between leading and lagging sectors is which sector fell faster or slower than the S&P 500 index itself.”
Improving – Discretionary (XLY), and Real Estate (XLRE)
We previously reduced our weightings to Real Estate and liquidated Discretionary entirely over concerns of the virus and impact to the economy. No change this week.
The correction in Technology last week broke support at the 200-dma but finished the week very close to the May 2019 lows. Communication and Utilities didn’t perform as well but also held up better during the decline on a relative basis. The same is true for Utilities and Staples. These are our core ETF’s right now at which we are carrying substantially reduced exposure.
Current Positions: 1/2 weight XLK, XLC, XLU, XLP, XLV
Weakening – None
No sectors in this quadrant.
Current Position: None
Lagging – Industrials (XLI), Financials (XLF), Materials (XLB), and Energy (XLE)
No change from last week, with the exception that performance continued to be worse than the overall market.
These sectors are THE most sensitive to Fed actions (XLF) and the shutdown of the economy. We eliminated all holdings in late February and early March.
Current Position: None
Market By Market
Small-Cap (SLY) and Mid Cap (MDY) – Three weeks ago, we sold all small-cap and mid-cap exposure over concerns of the impact of the coronavirus. Remain out of these sectors for now.
Current Position: None
Emerging, International (EEM) & Total International Markets (EFA)
Same as small-cap and mid-cap. Given the spread of the virus and the impact on the global supply chain. Trading opportunities only.
Current Position: None
S&P 500 Index (Core Holding) – Given the rapid deterioration of the broad market, we sold our entire core position holdings for the safety of cash.
Current Position: None
Gold (GLD) – Gold broke our stop, and we sold our holdings. We are now on the watch for an entry point if Gold can climb back above the 200-dma.
Bonds collapsed last week as the “credit event” we have been concerned about took shape. We had previously taken profits and reduced our bond holdings duration and increased credit quality. We have now reduced our total bond exposure to 20% of the portfolio from 40% since we are only carrying 10% equity currently. (Rebalanced our hedge.)
Current Positions: SHY, IEF, BIL
Sector / Market Recommendations
The table below shows thoughts on specific actions related to the current market environment.
(These are not recommendations or solicitations to take any action. This is for informational purposes only related to market extremes and contrarian positioning within portfolios. Use at your own risk and peril.)
Portfolio/Client Update:
I know it is ugly.
The S&P 500 is down nearly 32% in just three weeks.
That’s scary.
However, it is important to keep some perspective on where we are currently.
Last Monday, we further reduced our equity to just 10% (from 25% previously) of the portfolio
What does that mean? Here is some math:
If the market goes to ZERO from here, (it’s not going to) your MAXIMUM loss is just 10%.
This is recoverable, particularly if we could buy a portfolio of assets for FREE.
We currently expect a maximum decline from current levels of 20%. This would be a 2% net hit to portfolios leaving us with a LOT of cash to buy distressed assets at 50% off.
This is the opportunity we have been waiting for during the entire last decade.
Currently, we are busy rebuilding all of our portfolio models, rethinking risk management in a post-bear market environment, and what role the future of “fixed income” will play in asset allocations.
These are all essential questions that we need solid answers for.
We are in an excellent position with plenty of cash, reduced bond holdings, and minimal equity exposure in companies we want to own for the next 10-years. We are just patiently waiting to buy large chunks of these holdings soon with both stable and higher yields.
Let me assure you of four things;
The ONLY people who care more about your money than you, is all of us at RIA Advisors.
We will NOT “buy the bottom” of the market. We will buy when we SEE the bottom of the market is in and risk/reward ratios are clearly in our favor.
This has been THE fastest bear market in history. We are doing our best to preserve your capital so that you meet your financial goals. Bear markets are never fun, but they are necessary for future gains.
We’ve got this.
Please don’t hesitate to contact us if you have any questions, or concerns.
Lance Roberts
CIO
THE REAL 401k PLAN MANAGER
A Conservative Strategy For Long-Term Investors
Model performance is based on a two-asset model of stocks and bonds relative to the weighting changes made each week in the newsletter. This is strictly for informational and educational purposes only and should not be relied upon for any reason. Past performance is not a guarantee of future results. Use at your own risk and peril.
401k Plan Manager Live Model
As an RIA PRO subscriber(You get your first 30-days free) you have access to our live 401k p
The code will give you access to the entire site during the 401k-BETA testing process, so not only will you get to help us work out the bugs on the 401k plan manager, you can submit your comments about the rest of the site as well.
We are building models specific to company plans. So, if you would like to see your company plan included specifically, send me the following:
Name of the company
Plan Sponsor
A print out of your plan choices. (Fund Symbol and Fund Name)
If you would like to offer our service to your employees at a deeply discounted corporate rate, please contact me.
Everyone Wanting To Buy Suggests The Bear Still Prowls
Everyone Wanting To Buy Suggests The Bear Still Prowls
Everyone Wanting To Buy Suggests The Bear Still Prowls
“If you own 10% equities, as we do, and the market falls 100%, you will lose 10%. That said, you have 90 cents on the dollar to buy equities for free.” – Michael Lebowitz
For the last several months, we have been issuing repeated warnings about the market. While such comments are often mistaken for “being bearish,” we have often stated it is our process of managing “risk,” which is most important.
Beginning in mid-January, we began taking profits out of our portfolios and reducing risk. To wit:
‘On Friday, we began the orderly process of reducing exposure in our portfolios to take in profits, reduce portfolio risk, and raise cash levels.’
Importantly, we did not ‘sell everything’ and go to cash.
Since then, we took profits and rebalanced risk again in late January and early February as well.
On Friday/Monday, our ‘limits’ were breached, which required us to sell more.”
There are a couple of important things to understand about our current equity exposure.
To begin with, we never go to 100% cash. The reason is that “psychologically” it is too difficult for clients to start “buying” when the market finally bottoms. Seeing the market begin to recover, along with their portfolio, makes it easier to fight the fear the market is “going to zero.”
Secondly, and most importantly, at just 10% in current equity exposure, the market could literally fall 100% and our portfolios would only decline by 10%.(Of course, given we still have 90% of our capital left, we can buy a tremendous amount of “free assets.”)
Of course, the market isn’t going to zero.
However, let’s map out a more realistic example.
In this week’s MacroView, we discussed the “valuation” issue
“If our, and Mr. Rosenberg’s, estimates are correct of a 5-8% recessionary drag in the second quarter of 2020, then an average reduction in earnings of 30% is most likely overly optimistic.
However, here is the math:
Current Earnings = 132.90
30% Reduction = $100 (rounding down for easier math)
At various P/E multiples, we can predict where “fair value” for the market is based on historical assumptions:
20x earnings: Historically high but markets have traded at high valuations for the last decade.
18x earnings: Still historically high.
15x earnings: Long-Term Average
13x earnings: Undervalued
10x earnings: Extremely undervalued but aligned with secular bear market bottoms.
You can pick your own level where you think P/E’s will account for the global recession but the chart below prices it into the market.”
So, let’s assume our numbers are optimistically in the “ballpark” of a valuation reversion, and earnings are only cut by 30% while the market bottoms at 1800, or 18x earnings.(I say optimistically because normal valuation reversions are 15x earnings or less.)
Here’s the math:
For a “buy and hold” investor (who is already down 20-30% from the peak)will lose an additional 22%.
For a client with 10% equity exposure, they will lose an additional 2.2%.
When the market does eventually bottom, and it will, it will be far easier for our clients to recover 10% of their portfolio versus 50% for most “buy and hold” strategies.
As we have often stated, “getting back to even is not an investment strategy.”
Is The Bear Market Over?
This is THE QUESTION for investors. Here are a few articles from the past couple of days:
Bear markets have three stages – sharp down, reflexive rebound and a drawn-out fundamental downtrend – Rule #\8
Bear markets often START with a sharp and swift decline.
After this decline, there is an oversold bounce that retraces a portion of that decline.
The longer-term decline then continues, at a slower and more grinding pace, as the fundamentals deteriorate.
Dow Theory also suggests that bear markets consist of three down legs with reflexive rebounds in between.
The chart above shows the stages of the last two primary cyclical bear markets versus today (the 2020 scale has been adjusted to match.)
The answer to the question is simply this:
“When is it time to start buying the market? When you do NOT want to.”
Bond Market Implosion
At the moment, the Federal Reserve is fighting a potentially losing battle – the bond market.
After cutting rates to zero and launching QE of $700 billion – the markets crashed.
The ECB starts an $800 billion QE program, and the markets fail to move.
The Fed injected liquidity into money markets, the credit market, and is buying municipal bonds.
And the market crashed more.
The Fed has literally turned on a “garden hose” to extinguish a literal “bon(d)fire.”
This was no more evident than their action this past week to revive a program from the financial crisis called the Primary Dealer Credit Facility (PDCF) to bailout hedge funds and banks. Via Mike Witney:
“The Fed is reopening its most controversial and despised crisis-era bailout facility, the Primary Dealer Credit Facility. The facility’s real purpose is to transfer the toxic bonds and securities from failing financial institutions and corporations (through an intermediary) onto the Fed’s balance sheet.
The objective of this sleight of hand is to recapitalize big investors who, through their own bad bets, are now either underwater or in deep trouble. Just like 2008, the Fed is now doing everything in its power to save its friends and mop up the ocean of red ink that was generated during the 10-year orgy of speculation that has ended in crashing markets and a wave of deflation. Check out this excerpt from an article at Wall Street on Parade. Here’s an excerpt:
“Veterans on Wall Street think of the PDCF as the cash-for-trash facility, where Wall Street’s toxic waste from a decade of irresponsible trading and lending, will be purged from the balance sheets of the Wall Street firms and handed over to the balance sheet of the Federal Reserve – just as it was during the last financial crisis on Wall Street.”
In other words, the PDCF is a landfill for distressed assets that have lost much of their value and for which there is little or no demand. And, as bad as that sounds, the details about the resuscitated PDCF are much worse.”
If you have any doubt how bad it is in the bond market, just take a look at what happened to both investment grade and junk bond spreads. (Charts courtesy of David Rosenberg)
As they say: “That clearly ain’t normal.”
More importantly, the “Bear Market” won’t be over until the credit markets get fixed.
Hunting The Bear
It was a pretty stunning week in the market. Over the last 5-days, the market declined an astonishing, or should I say breathtaking, 15%. The last time we saw a one week decline of that magnitude was during the “Lehman” crisis. (Of course, with hedge funds blowing up all week, this is precisely what the Fed has been bailing out.)
Since the peak of the market at the end of February, the market is now down a whopping 32%.
Surely, we are close to a bottom?
Let’s revisit our daily and weekly charts for some clues as to where we are, what could happen next, and what actions to take.
On a daily basis, the market is extremely stretched and deviated to the downside. Friday’s selloff smacked of an “Oriental Rug Company” where it was an “Everything Must Go Liquidation Event.”
Remember all those headlines from early this year:
Well….
This selloff completely reversed the entire advance from the 2018 lows. That’s the bad news.
The good news is the markets are now more extremely oversold on a variety of measures than at just about any other point in history.
Such a reversal, particularly given the “speed and magnitude” of the decline, argues for a “reversal” of some sort.
Warning: Any reversal will NOT BE the bear market bottom. It will be a “bear market” rally you will want to “sell” into. The reason is there are still many investors trapped in “buy and hold” and “passive indexing” strategies which are actively seeking an exit. Any rallies will be met with redemptions.
As noted above, bear markets do not end with investors wanting to “buy” the market. They end when “everyone wants to sell.”
And, NO, investors are “not different this time.”
This “bear market” rally scenario becomes more evident when we view our longer-term weekly “sell signals.” As we warned last week:
“With all of our signals now triggered from fairly high levels, it suggests the current selloff is not over as of yet. In other words, we will see a rally, followed by a secondary failure to lower lows, before the ultimate bottom is put in.”
Unfortunately, we have yet to see any attempt at a sustained rally.
More importantly, with the failure of the markets to hold lows this week, both of our long-term weekly “sell signals” have now been triggered. Such would suggest that a rally back to the “bullish trend line” from 2009 will likely be the best opportunity to “sell” before the “bear market” finds its final low.
Where will that low likely be:
Let’s update our mapping from last week:
A retest of current lows that holds is a 27% decline. – Failed
A retest of the 2018 lows, which is most likely, an average recessionary decline of 32.8% – Current
A retest of the 2016 lows, coincident with a “credit event,” would entail a 50.9% decline. – Pending Possibility.
Given the magnitude, and multiple confirmations, of these signals, it is far too soon to assume the “bear market” is over. This is particularly the case, given the selloff is less than one-month old.
Bear markets, and recessions, tend to last 18-months on average.
The current bear market and recession are not the result of just the “coronavirus” shock. It is the result of many simultaneous shocks from:
Economic disruption
Surging unemployment
Oil price shock
Collapsing consumer confidence, and
A “credit event.”
We likely have more to go before we can safely assume we have turned the corner.
In the meantime, use rallies to raise cash. Don’t worry about trying to “buy the bottom.”There will be plenty of time to see “THE” bottom is in, and having cash will allow you to “buy stocks” from the last of the “weak hands.”
The MacroView
If you need help or have questions, we are always glad to help. Just email me.
See You Next Week
By Lance Roberts, CIO
Market & Sector Analysis
Data Analysis Of The Market & Sectors For Traders
S&P 500 Tear Sheet
Performance Analysis
Technical Composite
Note: The technical gauge is now at the lowest level since both the “Dot.com” and “Financial Crisis.” However, note the gauge bottoms BEFORE the market bottoms. In 2002, lows were retested. In 2008, there was an additional 22% decline into early 2009.
ETF Model Relative Performance Analysis
Sector & Market Analysis:
Be sure and catch our updates on Major Markets (Monday) and Major Sectors (Tuesday) with updated buy/stop/sell levels
Sector-by-Sector
For the 3rd week in a row:
“Everything was crushed again this past week, so the difference between leading and lagging sectors is which sector fell faster or slower than the S&P 500 index itself.”
Improving – Discretionary (XLY), and Real Estate (XLRE)
We previously reduced our weightings to Real Estate and liquidated Discretionary entirely over concerns of the virus and impact to the economy. No change this week.
The correction in Technology last week broke support at the 200-dma but finished the week very close to the May 2019 lows. Communication and Utilities didn’t perform as well but also held up better during the decline on a relative basis. The same is true for Utilities and Staples. These are our core ETF’s right now at which we are carrying substantially reduced exposure.
Current Positions: 1/2 weight XLK, XLC, XLU, XLP, XLV
Weakening – None
No sectors in this quadrant.
Current Position: None
Lagging – Industrials (XLI), Financials (XLF), Materials (XLB), and Energy (XLE)
No change from last week, with the exception that performance continued to be worse than the overall market.
These sectors are THE most sensitive to Fed actions (XLF) and the shutdown of the economy. We eliminated all holdings in late February and early March.
Current Position: None
Market By Market
Small-Cap (SLY) and Mid Cap (MDY) – Three weeks ago, we sold all small-cap and mid-cap exposure over concerns of the impact of the coronavirus. Remain out of these sectors for now.
Current Position: None
Emerging, International (EEM) & Total International Markets (EFA)
Same as small-cap and mid-cap. Given the spread of the virus and the impact on the global supply chain. Trading opportunities only.
Current Position: None
S&P 500 Index (Core Holding) – Given the rapid deterioration of the broad market, we sold our entire core position holdings for the safety of cash.
Current Position: None
Gold (GLD) – Gold broke our stop, and we sold our holdings. We are now on the watch for an entry point if Gold can climb back above the 200-dma.
Bonds collapsed last week as the “credit event” we have been concerned about took shape. We had previously taken profits and reduced our bond holdings duration and increased credit quality. We have now reduced our total bond exposure to 20% of the portfolio from 40% since we are only carrying 10% equity currently. (Rebalanced our hedge.)
Current Positions: SHY, IEF, BIL
Sector / Market Recommendations
The table below shows thoughts on specific actions related to the current market environment.
(These are not recommendations or solicitations to take any action. This is for informational purposes only related to market extremes and contrarian positioning within portfolios. Use at your own risk and peril.)
Portfolio/Client Update:
I know it is ugly.
The S&P 500 is down nearly 32% in just three weeks.
That’s scary.
However, it is important to keep some perspective on where we are currently.
Last Monday, we further reduced our equity to just 10% (from 25% previously) of the portfolio
What does that mean? Here is some math:
If the market goes to ZERO from here, (it’s not going to) your MAXIMUM loss is just 10%.
This is recoverable, particularly if we could buy a portfolio of assets for FREE.
We currently expect a maximum decline from current levels of 20%. This would be a 2% net hit to portfolios leaving us with a LOT of cash to buy distressed assets at 50% off.
This is the opportunity we have been waiting for during the entire last decade.
Currently, we are busy rebuilding all of our portfolio models, rethinking risk management in a post-bear market environment, and what role the future of “fixed income” will play in asset allocations.
These are all essential questions that we need solid answers for.
We are in an excellent position with plenty of cash, reduced bond holdings, and minimal equity exposure in companies we want to own for the next 10-years. We are just patiently waiting to buy large chunks of these holdings soon with both stable and higher yields.
Let me assure you of four things;
The ONLY people who care more about your money than you, is all of us at RIA Advisors.
We will NOT “buy the bottom” of the market. We will buy when we SEE the bottom of the market is in and risk/reward ratios are clearly in our favor.
This has been THE fastest bear market in history. We are doing our best to preserve your capital so that you meet your financial goals. Bear markets are never fun, but they are necessary for future gains.
We’ve got this.
Please don’t hesitate to contact us if you have any questions, or concerns.
Lance Roberts
CIO
THE REAL 401k PLAN MANAGER
A Conservative Strategy For Long-Term Investors
Model performance is based on a two-asset model of stocks and bonds relative to the weighting changes made each week in the newsletter. This is strictly for informational and educational purposes only and should not be relied upon for any reason. Past performance is not a guarantee of future results. Use at your own risk and peril.
401k Plan Manager Live Model
As an RIA PRO subscriber(You get your first 30-days free) you have access to our live 401k p
The code will give you access to the entire site during the 401k-BETA testing process, so not only will you get to help us work out the bugs on the 401k plan manager, you can submit your comments about the rest of the site as well.
We are building models specific to company plans. So, if you would like to see your company plan included specifically, send me the following:
Name of the company
Plan Sponsor
A print out of your plan choices. (Fund Symbol and Fund Name)
If you would like to offer our service to your employees at a deeply discounted corporate rate, please contact me.
#WhatYouMissed On RIA This Week: 03-20-20
We know you get busy and don’t check our website as often as you might like. Plus, with so much content being pushed out every week from the RIA Team, we thought we would send you a weekly synopsis of everything you might have missed.
Michael Lebowitz, CFA and I dig into the financial markets, the Fed’s bailouts, and what potentially happens next and what we are looking for. (Also, our take on corporate bailouts, and why, I can’t believe I am saying this, we mostly agree with Elizabeth Warren.)
Here is my only concern – this chart is everywhere over the last couple of days. Everyone seems to be convinced the #bearmarket is over already and can't wait to jump back in. Not typically how bear markets end. pic.twitter.com/4Y8lLXGft5
Here is the crazy part of this sell-off, stocks still aren't cheap to historical valuations. 1823 is fair value pic.twitter.com/CDNJtnXQ46
— Michael Lebowitz, CFA (@michaellebowitz) March 18, 2020
"I bought it for the dividend." "Muni's are super safe." "The packaging said high yield, nobody said it was all Califonia and Illinois bonds?" When things go wrong, they go wrong fast. pic.twitter.com/sBh86WcStq
Hey .@Delta you bought back almost $12 billion in stock over the last decade. How about selling that stock before asking tax payers for a handout. h/t @JackPScott
— Michael Lebowitz, CFA (@michaellebowitz) March 17, 2020
One day, we will find out exactly who "blew up," who got "bailed out," and which "Master of the Universe" was responsible. pic.twitter.com/kavDphjgBi
Michael Markowski: Dip Buyers, Beware Of Sensational Headlines
Michael Markowski has been involved in the Capital Markets since 1977. He spent the first 15 years of his career in the Financial Services Industry as a Stockbroker, Portfolio Manager, Venture Capitalist, Investment Banker and Analyst. Since 1996 Markowski has been involved in the Financial Information Industry and has produced research, information and products that have been used by investors to increase their performance and reduce their risk.Read more at BullsNBears.com
Many investors are salivating to trade the dips in a stock market which is becoming increasingly more volatile. It’s because Wall Street for the week ended March 13th according to the headlines had its worst week since 2008. Its human nature to want to buy at fire sale prices.
Investors became conditioned to buy the dips after the record setting 2008 crash. The S&P 500 made a quick recovery after crashing down by 40% within six months to its lowest level since 1996 after Lehman declared bankruptcy in September 2008.
Those who jumped in the last time the markets had their worst week since 2008, the week ended February 28, 2020, lost 8.2% in 10 days based on the S&P 500’s March 13th close. Secular bear markets are famous for producing one sensational headline after another as a market continues to reach new lows.
From September 12, 2008, the last market close prior to Lehman’s bankruptcy to the bottom of the 2000 to 2009 secular bear market which began in 2000 and ended on March 9, 2009:
Passive buy and hold investors lost 39%
bullish traders who precisely got in at all bottoms and sold at tops made 136.5%
bearish traders who precisely sold short at all tops and bought the shares back at all bottoms made 162.3%
What likely happened due to the extreme volatility as depicted in the chart below most non-professional traders lost money. Buy and hold bargain hunters who bought during the first five months after the 2008 crash began lost a minimum of 20%. From February 9, 2009, which was five months after the decline began, to the March 9th final bottom the market declined by an additional 22%.
The table below reinforces the difficulties that anyone but a professional investor had to make money from the 2008 crash. $100 traded from September 12th to March 2009, would have declined to $74.20 at the 2000 secular bear’s final bottom.
The current market is much riskier than the 2008 market for dip buying. Instead of being at the bottom of secular bear, the chart below depicts that the S&P 500 has been in a secular bull market since 2009. In my March 5th article when the S&P 500 was 10% higher included my prediction that the secular bull likely reached its all-time high on February 19, 2020 and the secular bear began the very next day on February 20, 2020.
Based on my recent empirical research findings from analyzing prior crashes which have similar traits as the crash of 2020, the probability is high that the decline from the top to the bottom will be from 79% to 89%. The final bottom will be reached between October and December of 2022.
BullsNBears.com which covers all of the emerging and declining economic and market trends is an excellent resource site. Click here to view one-minute video about the site.
Shedlock: Fed Trying To Save The Bond Market As Unemployment Explodes
Bond market volatility remains a sight to behold, even at the low end of the curve.
Bond Market Dislocations Remain
The yield on a 3-month T-Bill fell to 1.3 basis points then surged to 16.8 basis points in a matter of hours. The yield then quickly crashed to 3 basis points and now sits at 5.1 basis points.
The Fed is struggling even with the low end of the Treasury curve.
$IRX 3-Month Yield
Stockcharts shows the 3-month yield ($IRX) dipping below zero but Investing.Com does not show the yield went below zero.
In a crisis, it is said, all correlations go to one. Threats get so overwhelming that everything reacts in unison. And the common thread running through all facets of financial markets and the real economy right now is simple: a global cash crunch of epic proportions.
Investors piled $137 billion into cash-like assets in the five days ending March 11, according to a Bank of America report citing EPFR Global data. Its monthly fund manager survey showed the fourth-largest monthly jump in allocations to cash ever, from 4% to 5.1%.
“Cash has become the king as the short-term government funds have had massive deposits, with ~$13 billion inflows last week (a 10-standard deviation move),” adds Maneesh Dehspande, head of equity derivatives strategy at Barclays.
4th Largest Jump in History
It’s quite telling that a jump of a mere 1.1 percentage point to 5.1% cash is the 4th largest cash jump in history.
Margin and Short Covering
“In aggregate, the market saw a large outflow, with $9 billion of long liquidation and $6 billion of short covering,” said Michael Haigh, global head of commodity research at Societe Generale. “This general and non-directional closure of money manager positions could be explained by a need for cash to pay margin calls on other derivatives contracts.”
The comment is somewhat inaccurate. Sideline cash did not change “in aggregate” although cash balances t various fund managers did.
This is what happens when leveraged longs get a trillion dollar derivatives margin call or whatever the heck it was.
Need a Better Hedge
With the S&P 500 down more than 12% in the five sessions ending March 17, the Japanese yen is weaker against the greenback, the 10-year Treasury future is down, and gold is too.
That’s another sign dollars are top of mind, and investors are selling not only what they want to, but also what they have to.
Dash to Cash
It’s one thing to see exchange-traded products stuffed full of relatively illiquid corporate bonds trade below the purported sum of the value of their holdings. It’s quite another to see such a massive discount develop in a more plain-vanilla product like the Vanguard Total Bond Market ETF (BND) as investors ditched the product to raise cash despite not quite getting their money’s worth.
The fund closed Tuesday at a discount of nearly 2% to its net asset value, which blew out to above 6% last week amid accelerating, record outflows. That exceeded its prior record discount from 2008.
It is impossible for everyone to go to cash at the same time.
Someone must hold every stock, every bond and every dollar.
The Fed said the swaps, in which the Fed accepts other currencies in exchange for dollars, will for at least the next six months allow the central banks of Australia, Brazil, South Korea, Mexico, Singapore, Sweden, Denmark, Norway and New Zealand to tap up to a combined total of $450 billion, money to ensure the world’s dollar-dependent financial system continues to function.
The new swap lines “like those already established between the Federal Reserve and other central banks, are designed to help lessen strains in global U.S. dollar funding markets, thereby mitigating the effects of these strains on the supply of credit to households and businesses, both domestically and abroad,” the Fed said in a statement.
The central banks of South Korea, Singapore, Mexico and Sweden all said in separate statements they intended to use them.
Fed Does Another Emergency Repo and Relaunches Commercial Paper Facility
The Fed blew three economic bubbles in succession. A deflationary bust has started. They blew bubbles trying to prevent “deflation” defined as falling consumer prices.
BIS Deflation Study
The BIS did a historical study and found routine price deflation was not any problem at all.
“Deflation may actually boost output. Lower prices increase real incomes and wealth. And they may also make export goods more competitive,” stated the BIS study.
Deflation is not really about prices. It’s about the value of debt on the books of banks that cannot be paid back by zombie corporations and individuals.
Blowing bubbles in absurd attempts to arrest “price deflation” is crazy. The bigger the bubbles the bigger the resultant “asset bubble deflation”. Falling consumer prices do not have severe negative repercussions. Asset bubble deflations are another matter.
Assessing the Blame
Central banks are not responsible for the coronavirus. But they are responsible for blowing economic bubbles prone to crash.
The equities bubbles before the coronavirus hit were the largest on record.
Dollar Irony
The irony in this madness is the US will be printing the most currency and have the biggest budget deficits as a result. Yet central banks can’t seem to get enough dollars. In that aspect, the dollar ought to be sinking.
But given the US 10-year Treasury yield at 1.126% is among the highest in the world, why not exchange everything one can for dollars earning positive yield.
This is all such circular madness, it’s hard to say when or how it ends.
Unemployment Set To Explode
A SurveyUSA poll reveals 9% of the US is out of a job due to the coronavirus.
9% of Working Americans (14 Million) So Far Have Been Laid Off As Result of Coronavirus; 1 in 4 Workers Have Had Their Hours Reduced;
2% Have Been Fired; 20% Have Postponed a Business Trip; Shock Waves Just Now Beginning to Ripple Through Once-Roaring US Economy:
Early markers on the road from recession to depression as the Coronavirus threatens to stop the world from spinning on its axis show that 1 in 4 working Americans have had their hours reduced as a result of COVID-19, according to SurveyUSA’s latest time-series tracking poll conducted 03/18/20 and 03/19/20.
Approximately 160 million Americans were employed in the robust Trump economy 2 months ago. If 26% have had their hours reduced, that translates to 41 million Americans who this week will take home less money than last, twice as many as SurveyUSA found in an identical poll 1 week ago. Time-series tracking graphs available here.
9% of working Americans, or 14 million of your friends and neighbors, will take home no paycheck this week, because they were laid off, up from 1% in an identical SurveyUSA poll 1 week ago. Time-series tracking graphs available here.
Unlike those laid-off workers who have some hope of being recalled once the worst of the virus has past, 2% of Americans say they have lost their jobs altogether as a result of the virus, up from 1% last week.
Of working Americans, 26% are working from home either some days or every day, up from 17% last week. A majority, 56%, no longer go to their place of employment, which means they are not spending money on gasoline or transit tokens.
About: SurveyUSA interviewed 1,000 USA adults nationwide 03/18/20 through 03/19/20. Of the adults, approximately 60% were, before the virus, employed full-time or part-time outside of the home and were asked the layoff and reduced-hours questions. Approximately half of the interviews for this survey were completed before the Big 3 Detroit automakers announced they were shutting down their Michigan assembly lines. For most Americans, events continue to unfold faster than a human mind is able to process the consequences.
If we assume the SurveyUSA numbers are accurate and will not get worse, we can arrive at some U3 and U6 unemployment estimates.
Baseline Unemployment Estimate (U3)
Unemployed: 5.787 million + 14 million = 19.787 million unemployed
Civilian Labor Force: 164.546 million (unchanged)
Unemployment Rate: 19.787 / 164.546 = 12.0%
That puts my off the top of the head 15.0% estimate a few days in the ballpark.
Underemployment Estimate (U6)
Employed: 158.759 million.
26% have hours reduced = 41.277 million
Part Time for Economic Reasons: 4.318 million + 41.277 million = 45.595 million underemployed
45.595 million underemployed + 19.787 million unemployed = 65.382 million
Civilian Labor Force: 164.546 million (unchanged)
U6 Unemployment Rate: 65.382 / 164.546 = 39.7%
Whoa Nellie
Wow, that’s not a recession. A depression is the only word.
Note that economists coined a new word “recession” after the 1929 crash and stopped using the word depression assuming it would never happen again.
Prior to 1929 every economic slowdown was called a depression. So if you give credit to the Fed for halting depressions, they haven’t. Ity’s just a matter of semantics.
Depression is a very fitting word if those numbers are even close to what’s going to happen.
The Fed blew three economic bubbles in succession. A deflationary bust has started. They blew bubbles trying to prevent “deflation” defined as falling consumer prices.
BIS Deflation Study
The BIS did a historical study and found routine price deflation was not any problem at all.
“Deflation may actually boost output. Lower prices increase real incomes and wealth. And they may also make export goods more competitive,” stated the BIS study.
Deflation is not really about prices. It’s about the value of debt on the books of banks that cannot be paid back by zombie corporations and individuals.
Blowing bubbles in absurd attempts to arrest “price deflation” is crazy. The bigger the bubbles the bigger the resultant “asset bubble deflation”. Falling consumer prices do not have severe negative repercussions. Asset bubble deflations are another matter.
Assessing the Blame
Central banks are not responsible for the coronavirus. But they are responsible for blowing economic bubbles prone to crash.
The equities bubbles before the coronavirus hit were the largest on record.
Dollar Irony
The irony in this madness is the US will be printing the most currency and have the biggest budget deficits as a result. Yet central banks can’t seem to get enough dollars. In that aspect, the dollar ought to be sinking.
But given the US 10-year Treasury yield at 1.126% is among the highest in the world, why not exchange everything one can for dollars earning positive yield.
This is all such circular madness, it’s hard to say when or how it ends.
The Problem With Pragmatism… and Inflation
Pragmatism is seeking immediate solutions with little to no consideration for the longer-term benefits and consequences. An excellent example of this is the Social Security system in the United States. In the Depression-era, a government-sponsored savings plan was established to “solve” for lack of retirement savings by requiring contributions to a government-sponsored savings plan. At the time, the idea made sense as the population was greatly skewed towards younger people. No one seriously considered whether there would always be enough workers to support benefits for retired people in the future. Now, long after those policies were enacted and those that pushed the legislation are long gone, the time is fast approaching when Social Security will be unable to pay out what the government has promised.
Pragmatism is the common path of governments, led by politicians seeking re-election and the retention of power. Instead of considering the long-term implications of their policies, they focus on satisfying an immediate desire of their constituents.
In his book Economics in One Lesson, Henry Hazlitt made this point very clear by elaborating on the problems that eventually transpire from imprudent monetary and fiscal policy.
“The art of economics consists in looking not merely at the immediate but at the longer effects of any act or policy; it consists in tracing the consequences of that policy not merely for one group but for all groups.
Nine-tenths of the economic fallacies that are working such dreadful harm in the world today are the result of ignoring this lesson.”
Inflation
One of the most pernicious of these issues in our “modern and sophisticated” intellectual age is that of inflation. When asked to define inflation, most people say “rising prices,” with no appreciation for the fact that price movements are an effect, not a cause. They are a symptom of monetary circumstances. Inflation is a disequilibrium between the amounts of currency entering an economic system relative to the productive output of that same system.
In today’s world, there is only fiat (“by decree”) currencies. In other words, the value of currencies are not backed by some physical commodity such as gold, silver, or oil. Currencies are only backed by the perceived productive capacity of the nation and the stability of the issuing government. If a government takes unreasonable measures in managing its fiscal and monetary affairs, then the standard of living in that society will deteriorate, and confidence in it erodes.
Put another way, when the people of a nation or its global counterparts lose confidence in the fiscal and monetary policy-makers, the result is a loss of confidence in the medium of exchange, and a devaluation of the currency ensues. The influence of those in power will ultimately prove to be unsustainable.
Inflation is an indicator of confidence in the currency as a surrogate of confidence in the policies of a government. It is a mirror. This is why James Grant is often quoted as saying, “The gold price is the reciprocal of the world’s faith in central banking.”
Confidence in a currency may be lost in a variety of ways. The one most apparent today is creating too many dollars as a means of subsidizing the spending habits of politicians and the borrowing demands of corporations and citizens.
Precedent
There is plenty of modern-day historical precedent for a loss of confidence from excessive debt creation and the inevitable excessive currency creation. Weimar Germany in the 1920s remains the modern era poster child, but Zimbabwe, Argentina, and Venezuela also offer recent examples.
Following the 2008 financial crisis, many believed that the actions of the Federal Reserve were “heroic.” Despite failing to see the warning signs of a housing bubble in the months and even years leading up to the crisis, the Fed’s perspective was that it exists to provide liquidity. As the chart below illustrates, that is precisely what they did.
Data Courtesy Bloomberg
That pragmatic response failed to heed Hazlitt’s warning. What are the longer-term effects for the economy, the bailed-out banking system, and all of us? How would these policies affect the economy, markets, society, and the wealth of the nation’s citizens in five, ten, or twenty years?
Keeping interest rates at a low level for many years following the financial crisis while the economy generally appears to have recovered raises other questions. The Fed continues to argue that inflation remains subdued. That argument goes largely undisputed despite credible evidence to the contrary. Further, it provides the Fed a rationalization for keeping rates well below normal.
Politicians who oversee the Fed and want to retain power, consent to low-rate policies believing it will foster economic growth. While that may make sense to some, it is short-sighted and, therefore, pragmatic. The assessment does not account for a variety of other complicating factors, namely, what may transpire in the future as a result? Are seeds of excess being sown as was the case in the dot-com bubble and the housing bubble? If so, can we gauge the magnitude?
Policy Imposition
In the mid-1960s, President Lyndon Johnson sought to escalate U.S. involvement in the Vietnam War. In doing so, he knew he would need the help of the Fed to hold interest rates down to run the budget deficits required to fund that war. Although then-Fed Chairman William McChesney Martin was reluctant to ease monetary policy, he endured various forms of abuse from the Oval Office and finally acquiesced.
The bullying these days comes from President Trump. Although his arguments for easier policy contradict what he said on the campaign trail in 2016, Jerome Powell is compliant. Until recently, the economy appeared to be running at full employment and all primary fundamental metrics were well above the prior peaks set in 2007.
Additionally, Congress, at Trump’s behest and as the chart below illustrates, has deployed massive fiscal stimulus that created a yawning gap (highlighted) between fiscal deficits and the unemployment picture. This is a divergence not seen since the Johnson administration in the 1960s (also highlighted) and one of magnitude never seen. As is very quickly becoming clear, those actions both monetary and fiscal, were irresponsible to the point of negligence. Now, when we need it most as the economy shuts down, there is little or no “dry powder”.
Data Courtesy Bloomberg
President Johnson got his way and was able to fund the war with abnormally low interest rates. However, what ensued over the next 15 years was a wave of inflation that destroyed the productive capacity of the economy well into the early 1980s. Interest rates eventually rose to 18%, and economic dynamism withered as did the spirits of the average American.
The springboard for that scenario was a pragmatic policy designed to solve an immediate problem with no regard for the future. Monetary policy that suppressed interest rates and fiscal policy that took advantage of artificially low interest rates to accumulate debt at a relatively low cost went against the American public best interests. The public could not conceive that government “of, by and for the people” would act in such a short-sighted and self-serving manner.
Data Courtesy Bloomberg
The Sequel
Before the COVID-19 pandemic, the Congressional Budget Office (CBO) projections for U.S. budget deficits exceeded $1 trillion per year for the next 10-years. According to the CBO, the U.S. Treasury’s $22.5 trillion cumulative debt outstanding was set to reach $34.5 trillion by 2029, and that scenario assumed a very optimistic GDP growth of 3% per year. Further, it laughably assumed no recession will occur in the next decade, even though we are already in the longest economic expansion since the Civil War. In the event of a recession, a $1.8 trillion-dollar annual deficit would align with average historical experience. Given the severity of what is evident from the early stages of the pandemic, that forecast may be very much on the low end of reality.
The 1960s taught us that monetary and fiscal policy is always better erring on the side of conservatism to avoid losing confidence in the currency. Members of the Fed repeatedly tell the public they know this. Yet, if that is the case, why would they be so influenced by a President focused on marketing for re-election purposes? Alternatively, maybe the policy table has been set over the past ten years in a way that prevents them from taking proper measures? Do they assume they would be rejected despite the principled nature of their actions?
Summary
Inflation currently seems to be the very least of our worries. Impeachment, Iran, North Korea and climate change were all crisis head fakes.
The Fed was also distracted by what amounted to financial dumpster fires in the fall of 2019. After a brief respite, the Fed’s balance sheet began surging higher again and they cut the Fed Funds rate well before there was any known threat of a global pandemic. What is unclear is whether imprudent fiscal policies were forcing the Fed into imprudent monetary policy or whether the Fed’s policies, historical and current, are the enabler of fiscal imprudence. Now that the world has changed, as it has a habit of doing sometimes even radically, policymakers and the collective public are in something of a fine mess to understate the situation.
Now we are contending with a real global financial, economic, and humanitarian threat and one that demands principled action as opposed to short-sighted pragmatism.
The COVID-19 pandemic is clearly not a head fake nor is it a random dumpster fire. Neither is it going away any time soon. Unlike heads of state or corporate CEOs, biological threats do not have a political agenda and they do not care about the value of their stock options. There is nothing to negotiate other than the effectiveness of efforts required to protect society.
Given the potential harm caused by the divergence between stimulus and economic fundamentals, it would be short-sighted and irresponsibly pragmatic to count out the prospect of inflation. Given the actions of the central bankers, it could also be the understatement of this new and very unusual decade.
Technically Speaking: Risk Limits Hit, When Too Little Is Too Much
For the last several months, we have been issuing repeated warnings about the market. While such comments are often mistaken for “being bearish,” we have often stated it is our process of managing “risk” which is most important.
Beginning in mid-January,we began taking profits out of our portfolios and reducing risk. To wit:
“On Friday, we began the orderly process of reducing exposure in our portfolios to take in profits, reduce portfolio risk, and raise cash levels.”
Importantly, we did not “sell everything” and go to cash.
Since then, we took profits and rebalanced risk again in late January and early February as well.
Our clients, their families, their financial and emotional “well being,” rest in our hands. We take that responsibility very seriously, and work closely with our clients to ensure that not only are they financially successful, but they are emotionally stable in the process.
This is, and has been, our biggest argument against “buy and hold,” and “passive investing.” While there are plenty of case studies showing why individuals will eventually get back to even, the vast majority of individuals have a “pain point,” where they will sell.
So, we approach portfolio management from a perspective of “risk management,” but not just in terms of “portfolio risk,” but “emotional risk” as well. By reducing our holdings to raise cash to protect capital, we can reduce the risk of our clients hitting that “threashold” where they potentially make very poor decisions.
In investing, the worst decisions are always made at the moment of the most pain. Either at the bottom of the market or near the peaks.
Investing is not always easy. Our portfolios are designed to have longer-term holding periods, but we also understand that things do not always go as planned.
This is why we have limits, and when things go wrong, we sell.
So, why do I tell you this?
On Friday/Monday, our “limits” were breached, which required us to sell more.
Two Things
Two things have now happened, which signaled us to reduce risk further in portfolios.
“After an emergency 50-basis-point rate cut on March 3, the Federal Reserve doubled down Sunday evening, lowering its benchmark rate by an additional 100 basis points to a range of 0%-0.25% following another emergency meeting.
After ramping up its $60 billion of monthly Treasury bill purchases to include Treasuries of all maturities and offering $1.5 trillion of liquidity to the market via repurchase agreements on March 3, the Fed doubled down Sunday evening with announced purchases of at least $500 billion of Treasuries and at least $200 billion of agency mortgage-backed securities.
In addition, the Fed reduced reserve requirements to zero, encouraged banks to borrow from its discount window at a rate of 0.25%, and, in coordination with five other central banks, lowered the price of U.S. dollar swap arrangements to facilitate dollar liquidity abroad”
We had been anticipating the Federal Reserve to try and rescue the markets, which is why we didn’t sell even more aggressively previously. The lesson investors have been taught repeatedly over the last decade was “Don’t Fight The Fed.”
One of the reasons we reduced our exposure in the prior days was out of concern the Fed’s actions wouldn’t be successful.
On Monday, we found out the answer. The Fed may be fighting a battle it can’t win as markets not only failed to respond to the Fed’s monetary interventions but also broke the “bullish trend line” from the 2009 lows. (While the markets are oversold short-term, the long-term “sell signals” in the bottom panels are just being triggered from fairly high levels. This suggests more difficulty near-term for stocks.
“As you can see in the chart below, this is a massive surge of liquidity, hitting the market at a time the market is testing important long-term trend support.”
It is now, or never, for the markets.
With our portfolios already at very reduced equity levels, the break of this trendline will take our portfolios to our lowest levels of exposure.
What happened today was an event we have been worried about, but didn’t expect to see until after a break of the trendline – “margin calls.” This is why we saw outsized selling in “safe assets” such as REITs, utilities, bonds, and gold.
Cash was the only safe place to hide.
We aren’t anxious to “fight the Fed,” but the markets may have a different view this time.
Use rallies to raise cash, and rebalance portfolio risk accordingly.
We are looking to be heavy buyers of equities when the market forms a bottom, we just aren’t there as of yet.”
On Monday morning, with that important trendline broken, we took some action.
Did we sell everything? No. We still own 10% equity, bonds, and a short S&P 500 hedge.
Did we sell the bottom? Maybe.
We will only know in hindsight for certain, and we are not willing to risk more of our client’s capital currently.
There are too many non-quantifiable risks with a global recession looming, as noted by David Rosenberg:
“The pandemic is a clear ‘black swan’ event. There will be a whole range of knock-on effects. Fully 40 million American workers, or one-third of the private-sector labor force, are directly affected ─ retail, entertainment, events, sports, theme parks, conferences, travel, tourism, restaurants and, of course, energy.
This doesn’t include all the multiplier effects on other industries. It would not surprise me at all if real GDP in Q2 contracts at something close to an 8% annual rate (matching what happened in the fourth quarter of 2008, which was a financial event alone).
The hit to GDP can be expected to be anywhere from $400 billion to $600 billion for the year. But the market was in trouble even before COVID-19 began to spread, with valuations and complacency at cycle highs and equity portfolio managers sitting with record-low cash buffers. Hence the forced selling in other asset classes.
If you haven’t made recession a base-case scenario, you probably should. All four pandemics of the past century coincided with recession. This won’t be any different. It’s tough to generate growth when we’re busy “social distancing.” I am amazed that the latest WSJ poll of economists conducted between March 6-10th showed only 49% seeing a recession coming”.
The importance of his commentary is that from an “investment standpoint,” we can not quantify whether this “economic shock” has been priced into equities as of yet. However, we can do some math based on currently available data:
The chart below is the annual change in nominal GDP, and S&P 500 GAAP earnings.
I am sure you will not be shocked to learn that during “recessions,” corporate “earnings’ tend to fall. Historically, the average drawdown of earnings is about 20%; however, since the 1990’s, those drawdowns have risen to about 30%.
As of March 13th, Standard & Poors has earnings estimates for the first quarter of 2020 at $139.20 / share. This is down just $0.20 from the fourth quarter of 2019 estimates of $139.53.
In other words, Wall Street estimates are still in “fantasy land.”
If our, and Mr. Rosenberg’s, estimates are correct of a 5-8% recessionary drag in the second quarter of 2020, then an average reduction in earnings of 30% is most likely overly optimistic.
However, here is the math:
Current Earnings = 132.90
30% Reduction = $100 (rounding down for easier math)
At various P/E multiples, we can predict where “fair value” for the market is based on historical assumptions:
20x earnings: Historically high but markets have traded at high valuations for the last decade.
18x earnings: Still historically high.
15x earnings: Long-Term Average
13x earnings: Undervalued
10x earnings: Extremely undervalued but aligned with secular bear market bottoms.
You can pick your own level where you think P/E’s will account for the global recession but the chart below prices it into the market.
With the S&P 500 closing yesterday at 2386, this equates to downside risk of:
20x Earnings =-16% (Total decline from peak = – 40%)
NOTE: I am not suggesting the market is about to decline 60-70% from the recent peak. I am simply laying out various multiples based on assumed risk to earnings. However, 15-18x earnings is extremely reasonable and possible.
When Too Little Is Too Much
With our risk limits hit, and in order to protect our clients from both financial and emotional duress, we made the decision that even the reduced risk we were carrying was still too much.
One concern, which weighed heavily into our decision process, was the rising talk of the “closing the markets” entirely for a week or two to allow the panic to pass. We have clients that depend on liquidity from their accounts to sustain their retirement lifestyle. In our view, a closure of the markets would lead to two outcomes which pose a real risk to our clients:
They need access to liquidity, and with markets closed are unable to “sell” and raise cash; and,
When you trap investors in markets, when they do open again, there is a potential “rush” of sellers to get of the market to protect themselves.
That risk, combined with the issue that major moves in markets are happening outside of transaction hours, are outside of our ability to hedge, or control.
This is what we consider to be an unacceptable risk for the time being.
We will likely miss the ultimate “bottom” of the market.
Probably.
But that’s okay, we have done our job of protecting our client’s second most precious asset behind their family, the capital they have to support them.
The good news is that a great “buying” opportunity is coming. Just don’t be in a “rush” to try and buy the bottom.
I can assure you, when we see ultimately see a clear “risk/reward” set up to start taking on equity risk again, we will do so “with both hands.”
And we are sitting on a lot of cash just for that reason.Save
RIA PRO: Risk Limits Hit
For the last several months we have been issuing repeated warnings about the market. While such comments are often mistaken for “being bearish,” we have often stated it is our process of managing “risk” which is most important.
Beginning in mid-January,we began taking profits out of our portfolios and reducing risk. To wit:
“On Friday, we began the orderly process of reducing exposure in our portfolios to take in profits, reduce portfolio risk, and raise cash levels.”
Since then, as you know, we have taken profits, and rebalanced risk several times within the portfolios.
Importantly, we approach portfolio management from a perspective of “risk management,” but not just in terms of “portfolio risk,” but “emotional risk” as well. By reducing our holdings to raise cash to protect capital, we can reduce the risk of our clients hitting that “threshold” where they potentially make very poor decisions.
In investing, the worst decisions are always made at the moment of the most pain. Either at the bottom of the market or near the peaks.
Investing is not always easy. Our portfolios are designed to have longer-term holding periods, but we also understand that things do not always go as planned.
This is why we have limits, and when things go wrong, we sell.
So, why do I tell you this?
On Friday/Monday, our “limits” were breached, which required us to sell more.
Two Things
Two things have now happened which signaled us to reduce risk further in portfolios.
“After an emergency 50-basis-point rate cut on March 3, the Federal Reserve doubled down Sunday evening, lowering its benchmark rate by an additional 100 basis points to a range of 0%-0.25% following another emergency meeting.
After ramping up its $60 billion of monthly Treasury bill purchases to include Treasuries of all maturities and offering $1.5 trillion of liquidity to the market via repurchase agreements on March 3, the Fed doubled down Sunday evening with announced purchases of at least $500 billion of Treasuries and at least $200 billion of agency mortgage-backed securities.
In addition, the Fed reduced reserve requirements to zero, encouraged banks to borrow from its discount window at a rate of 0.25%, and, in coordination with five other central banks, lowered the price of U.S. dollar swap arrangements to facilitate dollar liquidity abroad”
We had been anticipating the Federal Reserve to try and rescue the markets, which is why we didn’t sell even more aggressively previously. The lesson investors have been taught repeatedly over the last decade was “Don’t Fight The Fed.”
One of the reasons we reduced our exposure in the prior days was out of concern we didn’t know if the Fed’s actions would be successful.
On Monday, we found out the answer. The Fed may be fighting a battle it can’t win as markets not only failed to respond to the Fed’s monetary interventions, but also broke the “bullish trend line” from the 2009 lows. (While the markets are oversold short-term, the long-term “sell signals” in the bottom panels are just being triggered from fairly high levels. This suggests more difficulty near-term for stocks.
“As you can see in the chart below, this is a massive surge of liquidity hitting the market at a time the market is hitting important long-term trend support.”
It is now, or never, for the markets.
With our portfolios already at very reduced equity levels, the break of this trendline will take our portfolios to our lowest levels of exposure. However, given the extreme oversold condition, noted above, it is likely we are going to see a bounce, which we will use to reduce risk into.
What happened today was an event we have been worried about, but didn’t expect to see until after a break of the trendline – “margin calls.”
This is why we saw outsized selling in “safe assets” such as REITs, utilities, bonds, and gold.
Cash was the only safe place to hide.
This also explains why the market “failed to rally” when the Fed announced $500 billion today. There is another $500 billion coming tomorrow. We will see what happens.
We aren’t anxious to “fight the Fed,” but the markets may have a different view this time.
Use rallies to raise cash, and rebalance portfolio risk accordingly.
We are looking to be heavy buyers of equities when the market forms a bottom, we just aren’t there as of yet.”
On Monday morning, we took some action.
Did we sell everything? No. We still own 10% equity, bonds, and a short S&P 500 hedge.
Did we sell the bottom? Maybe.
We will only know in hindsight for certain, and we are not willing to risk more of our client’s capital currently.
There are too many non-quantifiable risks with a global recession looming, as noted by David Rosenberg:
“The pandemic is a clear ‘black swan’ event. There will be a whole range of knock-on effects. Fully 40 million American workers, or one-third of the private sector labor force, are directly affected ─ retail, entertainment, events, sports, theme parks, conferences, travel, tourism, restaurants and, of course, energy.
This doesn’t include all the multiplier effects on other industries. It would not surprise me at all if real GDP in Q2 contracts at something close to an 8% annual rate (matching what happened in the fourth quarter of 2008 which was a financial event alone).
The hit to GDP can be expected to be anywhere from $400 billion to $600 billion for the year. But the market was in trouble even before COVID-19 began to spread, with valuations and complacency at cycle highs and equity portfolio managers sitting with record-low cash buffers. Hence the forced selling in other asset classes.
If you haven’t made recession a base-case scenario, you probably should. All four pandemics of the past century coincided with recession. This won’t be any different. It’s tough to generate growth when we’re busy “social distancing.” I am amazed that the latest WSJ poll of economists conducted between March 6-10th showed only 49% seeing a recession coming”.
The importance of his commentary is that from an “investment standpoint,” we can not quantify whether this “economic shock” has been priced into equities as of yet. However, we can do some math based on currently available data:
The chart below is annual nominal GDP, and S&P 500 GAAP earnings.
I am sure you will not be shocked to learn that during “recessions,” corporate “earnings’ tend to fall. Historically, the average drawdown of earnings is about 20%, however, since the 1990’s, those drawdowns have risen to about 30%.
As of March 13th, Standard & Poors has earnings estimates for the first quarter of 2020 at $139.20/share. This is down just $0.20 from the fourth quarter of 2019 estimates of $139.53.
If our, and Mr. Rosenberg’s, estimates are correct of a 5-8% recessionary drag in the second quarter of 2020, then an average reduction in earnings of 30% is most likely overly optimistic.
However, here is the math:
Current Earnings = 132.90
30% Reduction = $100 (rounding down for easier math)
At various P/E multiples we can predict where “fair value” for the market is based on historical assumptions:
20x earnings: Historically high but markets have traded at high valuations for the last decade.
18x earnings: Still historically high.
15x earnings: Long-Term Average
13x earnings: Undervalued
10x earnings: Extremely undervalued but aligned with secular bear market bottoms.
You can pick your own level where you think P/E’s will account for the global recession but the chart below prices it into the market.
With the S&P 500 closing yesterday at 2386, this equates to downside risk of:
20x Earnings =-16% (Total decline from peak = – 40%)
NOTE: I am not suggesting the market is about to decline 60-70% from the recent peak. I am simply laying out various multiples based on assumed risk to earnings. However, 15-18x earnings is extremely reasonable and possible.
When Too Little Is Too Much
With our risk limits hit, and in order to protect our clients from both financial and emotional duress, we made the decision that even the reduced risk we were carrying was still too much.
One concern, which weighed heavily into our decision process, was the rising talk of the “closing the markets” entirely for a week or two to allow the panic to pass. We have clients that depend on liquidity from their accounts to sustain their retirement lifestyle. In our view, a closure of the markets would lead to two outcomes which pose a real risk to our clients:
They need access to liquidity, and with markets closed are unable to “sell” and raise cash; and,
When you trap investors in markets, when they do open again there is a potential “rush” of sellers to get of the market to protect themselves.
That risk, combined with the issue that major moves in markets are happening outside of transaction hours, are outside of our ability to hedge, or control.
This is what we consider to be unacceptable risk for the time being.
We will likely miss the ultimate “bottom” of the market?
Probably.
But that’s okay, we have done our job of protecting our client’s second most precious asset behind their family, the capital they have to support them.
The good news is that a great “buying” opportunity is coming. Just don’t be in a “rush” to try and buy the bottom.
I can assure you that when we see ultimately see a clear “risk/reward” set up to start taking on equity risk again, we will do so “with both hands.”
And we are sitting on a lot of cash just for that reason.Save
Profits & Earnings Suggest The Bear Market Isn’t Over.
Is the bear market over yet?
This is the question that everyone wants to know. Why? So they can “buy the bottom.”
For that reason alone, I would suggest the current “bear market” is not over yet. Historically speaking, at the bottom of bear market cycles, as we saw in 1932, 1974, 2002, and 2008, there are few individuals willing to put capital at risk.
Given the large number of people on social media clamoring to jump back in the market given the rally this past Friday, it suggests that “optimism,” and “recency bias,” are still far too prevalent in the market.
Bear markets have three stages – sharp down, reflexive rebound and a drawn-out fundamental downtrend.”
Bear markets often START with a sharp and swift decline.
After this decline, there is an oversold bounce that retraces a portion of that decline.
The longer-term decline then continues, at a slower and more grinding pace, as the fundamentals deteriorate.
Dow Theory also suggests that bear markets consist of three down legs with reflexive rebounds in between.
While the correction has been sharp in recent weeks, it hasn’t inflicted enough “emotional pain” to deter individuals from jumping back in. As I stated:
“That selloff sets up a ‘reflexive bounce.’ For many individuals, they will ‘feel like’ they are ‘safe.’ This is how ‘bear market rallies’ lure investors back just before they are mauled again in ‘Phase 3.’”
Just like in 2000, and 2008, the media/Wall Street will be telling you to just “hold on.” Unfortunately, by the time “Phase 3” was finished, there was no one wanting to “buy” anything.
That’s how you know a “bear market” is over.
Price To Profits & Earnings
From an investment view, I prefer more data-driven analysis to determine if the current bear market is over.
“If the economy is slowing down, revenue and corporate profit growth will decline also. However, it is this point which the ‘bulls’ should be paying attention to. Many are dismissing currently high valuations under the guise of ‘low interest rates,’ however, the one thing you should not dismiss, and cannot make an excuse for, is the massive deviation between the market and corporate profits after tax. The only other time in history the difference was this great was in 1999.”
It isn’t just the deviation of asset prices from corporate profitability which is skewed, but also reported earnings per share.
“It should come as no surprise that companies manipulate bottom-line earnings to win the quarterly ‘beat the estimate’ game. By utilizing ‘cookie-jar’ reserves, heavy use of accruals, and other accounting instruments they can mold earnings to expectations.
‘The tricks are well-known: A difficult quarter can be made easier by releasing reserves set aside for a rainy day or recognizing revenues before sales are made, while a good quarter is often the time to hide a big ‘restructuring charge’ that would otherwise stand out like a sore thumb.
What is more surprising though is CFOs’ belief that these practices leave a significant mark on companies’ reported profits and losses. When asked about the magnitude of the earnings misrepresentation, the study’s respondents said it was around 10% of earnings per share.’“
“As shown in the table, it is not surprising to see that 93% of the respondents pointed to ‘influence on stock price’ and ‘outside pressure’ as the reason for manipulating earnings figures. For fundamental investors, this manipulation of earnings skews valuation analysis particularly with respect to P/E’s, EV/EBITDA, PEG, etc.”
“I think that every time you see the word EBITDA, you should substitute the word ‘bullshit’ earnings.”
Corporate Profits Weaker Than Advertised
Before the recent market rout, the deviation between reported earnings and corporate profits is one of the largest on record. This is an anomaly that should, in reality, not exist.
However, it is worse than it appears.
There is an interesting company included in the calculation of corporate profits, which is not widely recognized in most analysis. If you are an astute follower of our blog, you may recognize this particular company by the size of their balance sheet as shown below.
Yes, you guessed it (and it’s in the title). It’s the Federal Reserve.
When the Treasury Department pays interest one the debt, an expense to the U.S. Government, the Federal Reserve takes that in as “profits” which is reported on their balance sheet. Then, at the end of the year, the Fed remits a portion of the “revenue” back to the Government (who also count it as revenue).
These“profits,” which are generated by the Federal Reserve’s balance sheet, are included in the corporate profits discussed here. As shown below, actual corporate profitability is weaker if you extract the Fed’s profits from the analysis.
It’s quite amazing, and with the Fed massively increasing their balance sheet, their profitability will expand further.
Nonetheless, since the Fed’s balance sheet is part of the corporate profit calculation, we must include them in our analysis. While the media is focused on record operating profits, reported corporate profits are roughly at the same level as they were in 2011. Yet, the market has been making consistent new highs during that same period.
Estimating The Risk
The detachment of the stock market from underlying profitability guarantees poor future outcomes for investors. But, as has always been the case, the markets can certainly seem to “remain irrational longer than logic would predict,” but it never lasts indefinitely.
“Profit margins are probably the most mean-reverting series in finance, and if profit margins do not mean-revert, then something has gone badly wrong with capitalism. If high profits do not attract competition, there is something wrong with the system, and it is not functioning properly.” – Jeremy Grantham
The impending recession, and consumption freeze, is going to start the mean-reversion process in both corporate profits and earnings. In the following series of charts, I have projected the potential reversion.
The reversion in GAAP earnings is pretty calculable as swings from peaks to troughs have run on a fairly consistent trend. (The last drop off is the estimate to for a recession)
Using that historical context, we can project a recession will reduce earnings to roughly $100/share. The resulting decline asset prices to revert valuations to a level of 18x (still high) trailing earnings would suggest a level of $1800 for the S&P 500 index.
Let me suggest that I am not being “overly dramatic” or “super bearish.” There is a good bit of data to support the thesis. As I noted on Twitter, you can pick your valuation range, and do the math.
S&P Estimates still WAY too high. Using historical drawdowns in earnings, and peak to trough ranges, earnings will drop to $100/share during the #recession2020 – Pick your valuation target for #SPY bottom. 20x = 2000 18x = 1800 15x = 1500 (Long-Term Avg) 13x = 1300 Undervalued pic.twitter.com/v4inJMdAlj
We can support that thesis with corporate profits.
If we look at inflation-adjusted profit margins as a percentage of inflation-adjusted GDP, we see the same process of mean-reverting activity over time. Of course, these mean reverting events are always coupled with recessions, crisis, or bear markets.
More importantly, corporate profit margins have physical constraints. Out of each dollar of revenue created, there are costs such as infrastructure, R&D, wages, etc. Currently, one of the biggest beneficiaries to expanding profit margins has been the suppression of employment, wage growth, and artificially suppressed interest rates, which have significantly lowered borrowing costs. The oncoming recession will cause a rather marked collapse in corporate profitability as consumption declines.
The chart below shows corporate profits overlaid against the S&P 500 index. As with GAAP Earnings in the chart above, I have projected the potential reversion in corporate profitability as well.
When we measure the cumulative change in the S&P 500 index as compared to the level of profits, we find again that when investors pay more than $1 for a $1 worth of profits, there is an reversal of those excesses
The correlation is clearer when looking at the market versus the ratio of corporate profits to GDP. Again,since corporate profits are ultimately a function of economic growth, the correlation is not unexpected. Hence, neither should the impending reversion in both series.
To this point, it has seemed to be a simple formula that as long as the Fed remains active in supporting asset prices, the deviation between fundamentals and fantasy doesn’t matter. It has been a hard point to argue.
However, what has started, and has yet to complete, is the historical “mean reversion” process which has always followed bull markets. This should not be a surprise to anyone, as asset prices eventually reflect the underlying reality of corporate profitability.
Recessions reverse excesses.
Are we at the bottom yet? Probably not, if history is any guide.
Market Crash. Is It Over, Or Is It The “Revenant”
Market Crash: Is It Over, Or Is It The Revenant?
MacroView: Fed Launches A Bazooka To Kill A Virus
Financial Planning Corner: Tips For A Volatile Market
If you haven’t seen the movie “The Revenant” with Leonardo DiCaprio, it is a 2015 American survival drama describing frontiersman Hugh Glass’s experiences in 1823. Early in the movie, Hugh, an expert hunter, and tracker, is mauled by a grizzly bear. (Warning: the scene is very graphic)
In the scene, the attack comes in three distinct waves.
The bear attacks, and brutally mauls Hugh, who plays dead to survive. The attack subsides.
The bear comes back, and Hugh shoots it, provoking the bear to maul him some more.
Finally, Hugh pulls out his knife as the bear attacks for a final fight to the death.(Hugh wins if you don’t want to watch the video.)
Interestingly, this is also how a “bear market” works.
Bear markets have three stages – sharp down, reflexive rebound and a drawn-out fundamental downtrend
Bear markets often START with a sharp and swift decline.
After this decline, there is an oversold bounce that retraces a portion of that decline.
The longer-term decline then continues, at a slower and more grinding pace, as the fundamentals deteriorate.
Dow Theory also suggests that bear markets consist of three down legs with reflexive rebounds in between.
The chart above shows the stages of the last two primary cyclical bear markets versus today (the 2020 scale has been adjusted to match.)
As would be expected, the “Phase 1” selloff has been brutal.
That selloff sets up a “reflexive bounce.” For many individuals, they will “feel like” they are “safe.” This is how “bear market rallies” lure investors back in just before they are mauled again in “Phase 3.”
Just like in 2000, and 2008, the media/Wall Street will be telling you to just “hold on.” Unfortunately, by the time “Phase 3” was finished, there was no one wanting to “buy” anything.
One of the reasons we are fairly certain of a further decline is due to the dual impacts of the “COVID-19” virus, and oil price shock. As noted in our MacroView:
“With the U.S. now shutting down and entrenching itself in response to the virus, the economic impact will be worsened. However, given that economic data is lagging, and we only have numbers that were mostly pre-virus, the reports over the next couple of months will ultimately reveal the extent of the damage.
With oil prices now at $30/bbl and 10-year breakeven rates to 0.9%, the math is significantly worse, and that is what the severity of the recent selloff is telling us. Over the next two quarters, we could see as much as a 3% clip off of current GDP.”
Unfortunately, while asset prices have declined, they have likely not fully accounted for the impact to earnings, permanently lost revenues, and the recessionary impact from falling consumer confidence. Historically, the gap between asset prices and corporate profits gets filled.
“What we know, with almost absolute certainty, is that we will be in an economic recession within the next couple of quarters. We also know that earnings estimates are still way too elevated to account for the disruption coming from the COVID-19.”
“What we DON’T KNOW is where the ultimate bottom for the market is. All we can do is navigate the volatility to the best of our ability and recalibrate portfolios to adjust for downside risk without sacrificing the portfolio’s ability to adjust for a massive ” bazooka-style ” monetary intervention from global Central Banks if needed quickly.
This is why, over the last 6-weeks, we have been getting more “defensive” by increasing our CASH holdings to 15% of the portfolio, with our 40% in bonds doing the majority of the heavy lifting in mitigating the risk in our remaining equity holdings.
Interestingly, the Federal Reserve DID show up on Thursday as expected. In a statement from the New York Fed:
The Federal Reserve said it would inject more than $1.5 trillion of temporary liquidity into Wall Street on Thursday and Friday to prevent ominous trading conditions from creating a sharper economic contraction.
If the transactions are fully subscribed, they would swell the central bank’s $4.2 trillion asset portfolio by more than 35%.” – WSJ
As you can see in the chart below, this is a massive surge of liquidity hitting the market at a time the market is sitting on critical long-term trend support.
Of course, this is what the market has been hoping for.
Rate cuts? Check
Liquidity? Check
On Friday, the market surged, and ALMOST recouped the previous day’s losses. (Sorry, it wasn’t President Trump’s speech that boosted the market.)
However, this rally, and liquidity flush, most likely does not negate the continuation of the bear market. The amount of technical damage combined with a recession, and a potential surge in credit defaults almost ensures another leg of the beg market is yet to come.
A look at the charts can also help us better understand where we currently reside.
Trading The Bounce
In January, when we discussed taking profits out of our portfolios, we noted the markets were trading at 3-standard deviations above their 200-dma, which suggested a pullback, or correction, was likely.
Now, it is the same comment in reverse. The correction over the last couple of weeks has completely reversed the previous bullish exuberance into extreme pessimism. On a daily basis, the market is back to oversold. Historically, this condition has been sufficient for a bounce. Given the oversold condition (top panel) is combined with a very deep “sell signal” in the bottom panel, it suggests a fairly vicious reflexive rally is likely as we saw on Friday.
The question, of course, is where do you sell?
Looking at the chart above, it is possible for a rally to the 38.2%, or 50% retracement levels. However, with the severity of the break below the 200-dma, the 61.8% retracement level, where the 200-dma now resides, will be very formidable resistance. With the Fed’s liquidity push, it is possible for a strong “Phase 2” rally. Our plan will be to reduce equity exposure at each level of resistance and increase our equity hedges before the “Phase 3” mauling ensues.
The following chart is a longer-term analysis of the market and is the format we use for “onboarding” our clients into allocation models. (Vertical black lines are buy periods)
“But Lance, how do you know that Friday wasn’t THE bottom?”
A look at longer-term time-frames gives us some clues.
With all of our longer-term weekly “sell signals” now triggered from fairly high levels, it suggests the current selloff is not over as of yet. In other words, we will see a rally, followed by a secondary failure to lower lows, before the ultimate bottom is put in.
I have mapped out the three most logical secondary bottoms for the market, so you can assess your portfolio risk accordingly.
A retest of current lows that holds is a 27% decline.
A retest of the 2018 lows, most likely, is an average recessionary decline of 32.8%
A retest of the 2016 lows, coincident with a “credit event,” would entail a 50.9% decline.
Given the weekly signals have only recently triggered, we can look at monthly data to confirm we still remain confined to a “bearish market” currently.
On a monthly basis, sell signals have been triggered. However, these signals are NOT VALID until the end of the month. However, given the depth of the decline, it would likely require a rally back to all-time highs to reverse those signals. This is a very high improbability.
Assuming the signals remain, there is an important message being sent, as noted in the top panel. The “negative divergence” of relative strength has only been seen prior to the start of the previous two bear markets, and the 2015-2016 slog. While the current selloff resembles what we saw in late 2015, there is a risk of this developing into a recessionary bear market later this summer. The market is holding the 4-year moving average, which is “make or break” for the bull market trend from the 2009 lows.
However, we suspect those levels will eventually be taken out. Caution is advised.
What We Are Thinking
Since January, we have been regularly discussing taking profits in positions, rebalancing portfolio risks, and, most recently, moving out of areas subject to slower economic growth, supply-chain shutdowns, and the collapse in energy prices. This led us to eliminate all holdings in international, emerging markets, small-cap, mid-cap, financials, transportation, industrials, materials, and energy markets.(RIAPRO Subscribers were notified real-time of changes to our portfolios.)
There is “some truth” to the statement “that no one” could have seen the fallout of the “coronavirus” being escalated by an “oil price” war. However, there have been mounting risks for quite some time from valuations, to price deviations, and a complete disregard of risk by investors. While we have been discussing these issues with you, and making you aware of the risks, it was often deemed as “just being bearish” in the midst of a “bullish rally.”However, it is managing these types of risks, which is ultimately what clients pay advisors for.
It isn’t a perfect science. In times like these, it gets downright messy. But this is where working to preserve capital and limit drawdowns becomes most important. Not just from reducing the recovery time back to breakeven, but in also reducing the “psychological stress,” which leads individuals to make poor investment decisions over time.
As noted last week:
“Given the extreme oversold and deviated measures of current market prices, we are looking for a reflexive rally that we can further reduce risk into, add hedges, and stabilize portfolios for the duration of the correction. When it is clear, the correction, or worse a bear market, is complete, we will reallocate capital back to equities at better risk/reward measures.”
We highly suspect that we have seen the highs for the year. Most likely, we are moving into an environment where portfolio management will be more tactical in nature, versus buying and holding.
Take some action on this rally.
If this is a “Phase 2” relief rally of a bear market, you really don’t want to be around for the “final mauling.”
The MacroView
If you need help or have questions, we are always glad to help. Just email me.
WE ARE UNLOCKING OUR SUBSCRIBER SECTION AGAIN THIS WEEK TO ASSIST YOU IN MANAGING YOUR PORTFOLIO IN THESE CHALLENGING TIMES.
Need to know what specifically to buy and sell in your portfolio? We cover it every week, and every day on RIA PRO along with everything we are doing in our client portfolios.
Try RISK-FREE for 30-days
S&P 500 Tear Sheet
Performance Analysis
Technical Composite
ETF Model Relative Performance Analysis
Sector & Market Analysis:
Be sure and catch our updates on Major Markets (Monday) and Major Sectors (Tuesday) with updated buy/stop/sell levels
Sector-by-Sector
Everything was crushed again this past week, so the difference between leading and lagging sectors is which sector fell faster or slower than the S&P 500 index itself.
Improving – Discretionary (XLY), Real Estate (XLRE), and Staples (XLP)
Last week, we rebalanced our weightings in Real Estate and Staples, as these sectors are now improving in terms of relative performance. After getting very beaten up, we are looking not only for the “risk hedge” of non-virus related sectors but an eventual outperformance of the groups.
We sold our entire stake in Discretionary due to potential earnings impacts from a slowdown in consumption, supply chain problems, and inventory issues. This worked well as Discretionary fell sharply last week.
Current Positions: Target Weight XLU, XLRE
Outperforming – Technology (XLK), Communications (XLC), and Utilities (XLU)
The correction in Technology this past week broke support at the 200-dma but finished the week very close to our entry point, where we had slightly increased our exposure. These have “anti-virus” properties, so we are looking for the “risk hedge” relative to the broader market. Communication and Utilities didn’t perform as well but also held up better during the decline on a relative basis. We are watching Utilities and may reduce exposure if interest rates begin to rise due to the Fed. The same with Real Estate as well.
We did bring our healthcare positioning back to portfolio weight as the sector will ultimately benefit from a “cure” for the “coronavirus.” Also, with Bernie Sanders now lagging Joe Biden on the Democratic ticket, this removes some of the risks of “nationalized healthcare” from the sector.
Lagging – Industrials (XLI), Financials (XLF), Materials (XLB), and Energy (XLE)
We had started to buy a little energy exposure previously but closed out of the positions as we were stopped out of our holdings week before last. We are going to continue to monitor the space due to its extreme oversold condition and relative value and will re-enter our positions when stability starts to take hold.
We also sold Financials due to the financial risk from a recessionary impact on the outstanding corporate debt which currently exists. The Fed’s rate cut also impacts the bank’s Net Interest Margins, which makes them less attractive. Industrials and Materials have too much exposure to the “virus risk” for now.
Current Position: None
Market By Market
Small-Cap (SLY) and Mid Cap (MDY) – Week before last, we sold all small-cap and mid-cap exposure over concerns of the impact of the coronavirus. Remain out of these sectors for now. However, given that Central Banks are going “all in” on stimulus, we may look for a trade in these sectors short-term.
Current Position: None
Emerging, International (EEM) & Total International Markets (EFA)
Same as small-cap and mid-cap. Given the spread of the virus and the impact on the global supply chain. Trading opportunity only.
Current Position: None
Dividends (VYM), Market (IVV), and Equal Weight (RSP) – We have decided to consolidate our long-term “core” holding into IVV only. We sold RSP and VYM and added to IVV. The reason for doing this is the disparity of performance between the 3-holdings. Since we want an “exact hedge” for our portfolio, IVV is the best match for a short-S&P 500 ETF.
Current Position:IVV
Gold (GLD) – This past week, Gold sold off as the Fed introduced liquidity giving the bulls hope and removing the “fear” factor in stocks. There was also a massive “margin call” that led to a liquidation event. Gold is VERY oversold currently. Add positions to portfolios with a stop $140. We sold our GDX position due to the fact mining is people-intensive and is located in countries most susceptible to the virus.
Bonds also broke out to new highs as the correction ensued. Last Friday, we took profits in our 20-year bond position (TLT) to reduce our duration slightly, raise cash, and take in some profits. Bonds are extremely overbought now, so be cautious, we are maintaining the rest of our exposures for now, but we did rebalance our duration by selling 1/2 of IEF and adding to BIL.
Current Positions:DBLTX, SHY, IEF, PTIAX, BIL
Sector / Market Recommendations
The table below shows thoughts on specific actions related to the current market environment.
(These are not recommendations or solicitations to take any action. This is for informational purposes only related to market extremes and contrarian positioning within portfolios. Use at your own risk and peril.)
Portfolio/Client Update:
Thank goodness. The market finally responded to the Fed on Friday.
Please read “Trading The Bounce” above as it details our plan on how we are going to trade this liquidity rally.
As noted last week:
“Staying true to our discipline and strategy is difficult when you have this type of volatility. We question everything, every day. Are we in the right place? Do we have too much risk? Are we missing something?
The ghosts of 2000, and 2008, stalk us both, and we are overly protective of YOUR money. We do not take our jobs lightly.”
We took some further actions to increase cash, further rebalance risks this past week. We are now using this rally to add hedges, and reduce equities until the current “sell signals” reverse. As noted, this is most likely a “bear market” rally that will fail.
However, if it is the beginning of a new “bull market,” then we will simply remove hedges and add to our equity longs.
Be assured we are watching your portfolios very closely. However, if you have ANY questions, comments, or concerns, please don’t hesitate to email me.
Portfolio Actions Taken Last Week
New clients:Only adding new positions as needed.
Dynamic Model: Sold VOOG, and hedged portfolio. Currently unhedged.
Equity Model: Sold IEF and added to BIL to shorten bond portfolio duration. Sold RSP and VYM, and added slightly to IVV to rebalance our CORE holdings for more effective hedges.
ETF Model: Same as Equity Model.
Note for new clients:
It is important to understand that when we add to our equity allocations, ALL purchases are initially “trades” that can, and will, be closed out quickly if they fail to work as anticipated. This is why we “step” into positions initially. Once a “trade” begins to work as anticipated, it is then brought to the appropriate portfolio weight and becomes a long-term investment. We will unwind these actions either by reducing, selling, or hedging if the market environment changes for the worse.
THE REAL 401k PLAN MANAGER
A Conservative Strategy For Long-Term Investors
Model performance is based on a two-asset model of stocks and bonds relative to the weighting changes made each week in the newsletter. This is strictly for informational and educational purposes only and should not be relied upon for any reason. Past performance is not a guarantee of future results. Use at your own risk and peril.
401k Plan Manager Live Model
As an RIA PRO subscriber(You get your first 30-days free) you have access to our live 401k p
The code will give you access to the entire site during the 401k-BETA testing process, so not only will you get to help us work out the bugs on the 401k plan manager, you can submit your comments about the rest of the site as well.
We are building models specific to company plans. So, if you would like to see your company plan included specifically, send me the following:
Name of the company
Plan Sponsor
A print out of your plan choices. (Fund Symbol and Fund Name)
If you would like to offer our service to your employees at a deeply discounted corporate rate, please contact me.
Market Crash. Is It Over, Or Is It The “Revenant”
Market Crash: Is It Over, Or Is It The Revenant?
MacroView: Fed Launches A Bazooka To Kill A Virus
Financial Planning Corner: Tips For A Volatile Market
If you haven’t seen the moving “The Revenant” with Leonardo DiCaprio, it is a 2015 American survival drama describing frontiersman Hugh Glass’s experiences in 1823. Early in the movie, Hugh, an expert hunter, and tracker, is mauled by a grizzly bear. (Warning: the scene is very graphic)
In the scene, the attack comes in three distinct waves.
The bear attacks, and brutally mauls Hugh, who plays dead to survive. The attack subsides.
The bear comes back, and Huge shoots it, provoking the bear to maul him some more.
Finally, Huge pulls out his knife as the bear attacks for a final fight to the death.(Hugh wins if you don’t want to watch the video.)
Interestingly, this is also how a “bear market” works.
Bear markets have three stages – sharp down, reflexive rebound and a drawn-out fundamental downtrend
Bear markets often START with a sharp and swift decline.
After this decline, there is an oversold bounce that retraces a portion of that decline.
The longer-term decline then continues, at a slower and more grinding pace, as the fundamentals deteriorate.
Dow Theory also suggests that bear markets consist of three down legs with reflexive rebounds in between.
The chart above shows the stages of the last two primary cyclical bear markets versus today (the 2020 scale has been adjusted to match.)
As would be expected, the “Phase 1” selloff has been brutal.
That selloff sets up a “reflexive bounce.” For many individuals, they will “feel like” they are “safe.” This is how “bear market rallies” lure investors back in just before they are mauled again in “Phase 3.”
Just like in 2000, and 2008, the media/Wall Street will be telling you to just “hold on.” Unfortunately, by the time “Phase 3” was finished, there was no one wanting to “buy” anything.
One of the reasons we are fairly certain of a further decline is due to the dual impacts of the “COVID-19” virus, and oil price shock. As noted in our MacroView:
“With the U.S. now shutting down and entrenching itself in response to the virus, the economic impact will be worsened. However, given that economic data is lagging, and we only have numbers that were mostly pre-virus, the reports over the next couple of months will ultimately reveal the extent of the damage.
With oil prices now at $30/bbl and 10-year breakeven rates to 0.9%, the math is significantly worse, and that is what the severity of the recent selloff is telling us. Over the next two quarters, we could see as much as a 3% clip off of current GDP.”
Unfortunately, while asset prices have declined, they have likely not fully accounted for the impact to earnings, permanently lost revenues, and the recessionary impact from falling consumer confidence. Historically, the gap between asset prices and corporate profits gets filled.
“What we know, with almost absolute certainty, is that we will be in an economic recession within the next couple of quarters. We also know that earnings estimates are still way too elevated to account for the disruption coming from the COVID-19.”
“What we DON’T KNOW is where the ultimate bottom for the market is. All we can do is navigate the volatility to the best of our ability and recalibrate portfolios to adjust for downside risk without sacrificing the portfolio’s ability to adjust for a massive ” bazooka-style ” monetary intervention from global Central Banks if needed quickly.
This is why, over the last 6-weeks, we have been getting more “defensive” by increasing our CASH holdings to 15% of the portfolio, with our 40% in bonds doing the majority of the heavy lifting in mitigating the risk in our remaining equity holdings.
Interestingly, the Federal Reserve DID show up on Thursday as expected. In a statement from the New York Fed:
The Federal Reserve said it would inject more than $1.5 trillion of temporary liquidity into Wall Street on Thursday and Friday to prevent ominous trading conditions from creating a sharper economic contraction.
If the transactions are fully subscribed, they would swell the central bank’s $4.2 trillion asset portfolio by more than 35%.” – WSJ
As you can see in the chart below, this is a massive surge of liquidity hitting the market at a time the market is sitting on critical long-term trend support.
Of course, this is what the market has been hoping for.
Rate cuts? Check
Liquidity? Check
On Friday, the market surged, and ALMOST recouped the previous days losses. (Sorry, it wasn’t President Trump’s speech that boosted the market.)
However, this rally, and liquidity flush, most likely does not negate the continuation of the bear market. The amount of technical damage combined with a recession, and a potential surge in credit defaults almost ensures another leg of the beg market is yet to come.
A look at the charts can also help us better understand where we currently reside.
Trading The Bounce
In January, when we discussed taking profits out of our portfolios, we noted the markets were trading at 3-standard deviations above their 200-dma, which suggested a pullback, or correction, was likely.
Now, it is the same comment in reverse. The correction over the last couple of weeks has completely reversed the previous bullish exuberance into extreme pessimism. On a daily basis, the market is back to oversold. Historically, this condition has been sufficient for a bounce. Given the oversold condition (top panel) is combined with a very deep “sell signal” in the bottom panel, it suggests a fairly vicious reflexive rally is likely as we saw on Friday.
The question, of course, is where do you sell?
Looking at the chart above, it is possible for a rally to the 38.2%, or 50% retracement levels. However, with the severity of the break below the 200-dma, the 61.8% retracement level, where the 200-dma now resides, will be very formidable resistance. With the Fed’s liquidity push, it is possible for a strong “Phase 2” rally. Our plan will be to reduce equity exposure at each level of resistance and increase our equity hedges before the “Phase 3” mauling ensues.
The following chart is a longer-term analysis of the market and is the format we use for “onboarding” our clients into allocation models. (Vertical black lines are buy periods)
“But Lance, how do you know that Friday wasn’t THE bottom?”
A look at longer-term time-frames gives us some clues.
With all of our longer-term weekly “sell signals” now triggered from fairly high levels, it suggests the current selloff is not over as of yet. In other words, we will see a rally, followed by a secondary failure to lower lows, before the ultimate bottom is put in.
I have mapped out the three most logical secondary bottoms for the market, so you can assess your portfolio risk accordingly.
A retest of current lows that holds is a 27% decline.
A retest of the 2018 lows, most likely, is an average recessionary decline of 32.8%
A retest of the 2016 lows, coincident with a “credit event,” would entail a 50.9% decline.
Given the weekly signals have only recently triggered, we can look at monthly data to confirm we still remain confined to a “bearish market” currently.
On a monthly basis, sell signals have been triggered. However, these signals are NOT VALID until the end of the month. However, given the depth of the decline, it would likely require a rally back to all-time highs to reverse those signals. This is a very high improbability.
Assuming the signals remain, there is an important message being sent, as noted in the top panel. The “negative divergence” of relative strength has only been seen prior to the start of the previous two bear markets, and the 2015-2016 slog. While the current selloff resembles what we saw in late 2015, there is a risk of this developing into a recessionary bear market later this summer. The market is holding the 4-year moving average, which is “make or break” for the bull market trend from the 2009 lows.
However, we suspect those levels will eventually be taken out. Caution is advised.
What We Are Thinking
Since January, we have been regularly discussing taking profits in positions, rebalancing portfolio risks, and, most recently, moving out of areas subject to slower economic growth, supply-chain shutdowns, and the collapse in energy prices. This led us to eliminate all holdings in international, emerging markets, small-cap, mid-cap, financials, transportation, industrials, materials, and energy markets.(RIAPRO Subscribers were notified real-time of changes to our portfolios.)
There is “some truth” to the statement “that no one” could have seen the fallout of the “coronavirus” being escalated by an “oil price” war. However, there have been mounting risks for quite some time from valuations, to price deviations, and a complete disregard of risk by investors. While we have been discussing these issues with you, and making you aware of the risks, it was often deemed as “just being bearish” in the midst of a “bullish rally.”However, it is managing these types of risks, which is ultimately what clients pay advisors for.
It isn’t a perfect science. In times like these, it gets downright messy. But this is where working to preserve capital and limit drawdowns becomes most important. Not just from reducing the recovery time back to breakeven, but in also reducing the “psychological stress,” which leads individuals to make poor investment decisions over time.
As noted last week:
“Given the extreme oversold and deviated measures of current market prices, we are looking for a reflexive rally that we can further reduce risk into, add hedges, and stabilize portfolios for the duration of the correction. When it is clear, the correction, or worse a bear market, is complete, we will reallocate capital back to equities at better risk/reward measures.”
We highly suspect that we have seen the highs for the year. Most likely, we are moving into an environment where portfolio management will be more tactical in nature, versus buying and holding.
Take some action on this rally.
If this is a “Phase 2” relief rally of a bear market, you really don’t want to be around for the “final mauling.”
The MacroView
If you need help or have questions, we are always glad to help. Just email me.
Be sure and catch our updates on Major Markets (Monday) and Major Sectors (Tuesday) with updated buy/stop/sell levels
Sector-by-Sector
Everything was crushed again this past week, so the difference between leading and lagging sectors is which sector fell faster or slower than the S&P 500 index itself.
Improving – Discretionary (XLY), Real Estate (XLRE), and Staples (XLP)
Last week, we rebalanced our weightings in Real Estate and Staples, as these sectors are now improving in terms of relative performance. After getting very beaten up, we are looking not only for the “risk hedge” of non-virus related sectors but an eventual outperformance of the groups.
We sold our entire stake in Discretionary due to potential earnings impacts from a slowdown in consumption, supply chain problems, and inventory issues. This worked well as Discretionary fell sharply last week.
Current Positions: Target Weight XLU, XLRE
Outperforming – Technology (XLK), Communications (XLC), and Utilities (XLU)
The correction in Technology this past week broke support at the 200-dma but finished the week very close to our entry point, where we had slightly increased our exposure. These have “anti-virus” properties, so we are looking for the “risk hedge” relative to the broader market. Communication and Utilities didn’t perform as well but also held up better during the decline on a relative basis. We are watching Utilities and may reduce exposure if interest rates begin to rise due to the Fed. The same with Real Estate as well.
We did bring our healthcare positioning back to portfolio weight as the sector will ultimately benefit from a “cure” for the “coronavirus.” Also, with Bernie Sanders now lagging Joe Biden on the Democratic ticket, this removes some of the risks of “nationalized healthcare” from the sector.
Lagging – Industrials (XLI), Financials (XLF), Materials (XLB), and Energy (XLE)
We had started to buy a little energy exposure previously but closed out of the positions as we were stopped out of our holdings week before last. We are going to continue to monitor the space due to its extreme oversold condition and relative value and will re-enter our positions when stability starts to take hold.
We also sold Financials due to the financial risk from a recessionary impact on the outstanding corporate debt which currently exists. The Fed’s rate cut also impacts the bank’s Net Interest Margins, which makes them less attractive. Industrials and Materials have too much exposure to the “virus risk” for now.
Current Position: None
Market By Market
Small-Cap (SLY) and Mid Cap (MDY) – Week before last, we sold all small-cap and mid-cap exposure over concerns of the impact of the coronavirus. Remain out of these sectors for now. However, given that Central Banks are going “all in” on stimulus, we may look for a trade in these sectors short-term.
Current Position: None
Emerging, International (EEM) & Total International Markets (EFA)
Same as small-cap and mid-cap. Given the spread of the virus and the impact on the global supply chain. Trading opportunity only.
Current Position: None
Dividends (VYM), Market (IVV), and Equal Weight (RSP) – We have decided to consolidate our long-term “core” holding into IVV only. We sold RSP and VYM and added to IVV. The reason for doing this is the disparity of performance between the 3-holdings. Since we want an “exact hedge” for our portfolio, IVV is the best match for a short-S&P 500 ETF.
Current Position:IVV
Gold (GLD) – This past week, Gold sold off as the Fed introduced liquidity giving the bulls hope and removing the “fear” factor in stocks. There was also a massive “margin call” that led to a liquidation event. Gold is VERY oversold currently. Add positions to portfolios with a stop $140. We sold our GDX position due to the fact mining is people-intensive and is located in countries most susceptible to the virus.
Bonds also broke out to new highs as the correction ensued. Last Friday, we took profits in our 20-year bond position (TLT) to reduce our duration slightly, raise cash, and take in some profits. Bonds are extremely overbought now, so be cautious, we are maintaining the rest of our exposures for now, but we did rebalance our duration by selling 1/2 of IEF and adding to BIL.
Current Positions:DBLTX, SHY, IEF, PTIAX, BIL
Sector / Market Recommendations
The table below shows thoughts on specific actions related to the current market environment.
(These are not recommendations or solicitations to take any action. This is for informational purposes only related to market extremes and contrarian positioning within portfolios. Use at your own risk and peril.)
Portfolio/Client Update:
Thank goodness. The market finally responded to the Fed on Friday.
Please read “Trading The Bounce” above as it details our plan on how we are going to trade this liquidity rally.
As noted last week:
“Staying true to our discipline and strategy is difficult when you have this type of volatility. We question everything, every day. Are we in the right place? Do we have too much risk? Are we missing something?
The ghosts of 2000, and 2008, stalk us both, and we are overly protective of YOUR money. We do not take our jobs lightly.”
We took some further actions to increase cash, further rebalance risks this past week. We are now using this rally to add hedges, and reduce equities until the current “sell signals” reverse. As noted, this is most likely a “bear market” rally that will fail.
However, if it is the beginning of a new “bull market,” then we will simply remove hedges and add to our equity longs.
Be assured we are watching your portfolios very closely. However, if you have ANY questions, comments, or concerns, please don’t hesitate to email me.
Portfolio Actions Taken Last Week
New clients:Only adding new positions as needed.
Dynamic Model: Sold VOOG, and hedged portfolio. Currently unhedged.
Equity Model: Sold IEF and added to BIL to shorten bond portfolio duration. Sold RSP and VYM, and added slightly to IVV to rebalance our CORE holdings for more effective hedges.
ETF Model: Same as Equity Model.
Note for new clients:
It is important to understand that when we add to our equity allocations, ALL purchases are initially “trades” that can, and will, be closed out quickly if they fail to work as anticipated. This is why we “step” into positions initially. Once a “trade” begins to work as anticipated, it is then brought to the appropriate portfolio weight and becomes a long-term investment. We will unwind these actions either by reducing, selling, or hedging if the market environment changes for the worse.
THE REAL 401k PLAN MANAGER
A Conservative Strategy For Long-Term Investors
Model performance is based on a two-asset model of stocks and bonds relative to the weighting changes made each week in the newsletter. This is strictly for informational and educational purposes only and should not be relied upon for any reason. Past performance is not a guarantee of future results. Use at your own risk and peril.
401k Plan Manager Live Model
As an RIA PRO subscriber(You get your first 30-days free) you have access to our live 401k p
The code will give you access to the entire site during the 401k-BETA testing process, so not only will you get to help us work out the bugs on the 401k plan manager, you can submit your comments about the rest of the site as well.
We are building models specific to company plans. So, if you would like to see your company plan included specifically, send me the following:
Name of the company
Plan Sponsor
A print out of your plan choices. (Fund Symbol and Fund Name)
If you would like to offer our service to your employees at a deeply discounted corporate rate, please contact me.
#WhatYouMissed On RIA This Week: 03-13-20
We know you get busy and don’t check our website as often as you might like. Plus, with so much content being pushed out every week from the RIA Team, we thought we would send you a weekly synopsis of everything you might have missed.
Danny Ratliff, CFP and Lance Roberts, CIO discuss the importance of having a process during a market decline, and the importance of financial advisor to ensure you don’t make emotionally driven mistakes.
Buy and Hold ain't a process, despite what some cool cats on Twitter may tell you.
— Michael Lebowitz, CFA (@michaellebowitz) March 10, 2020
This is the flaw in the "I bought it for the dividends and dont care about the price" strategy. On Monday you lost 44% of the value and now you lost most of the dividend. This is not an investment strategy. https://t.co/iKhwpkHZii
— Michael Lebowitz, CFA (@michaellebowitz) March 11, 2020
After yesterday's "Black Swan Monday," it is not surprising we are getting a strong "reflexive rally" today. Just don't mistake it for a resumption of the #bullmarket. It could last for a few days, but lows will be retested, or new lows set, before the #bull returns. pic.twitter.com/6expqOZOKM
Don't be fooled by this nonsense. Stocks are NOT CHEAP on a FORWARD operating basis because #earnings have not be revised lower nearly enough yet to compensate for the supply chain impact. pic.twitter.com/F0exudWZJY
March Madness: Having A Process For A Winning Outcome
We are coming upon that time of year when the markets play second fiddle to debates about which twelve seed could be this year’s Cinderella in the NCAA basketball tournament. For college basketball fans, this particular time of year is dubbed March Madness. The widespread popularity of the NCAA tournament is not just about the games, the schools, and the players, but just as importantly, it is about the brackets. Brackets refer to the office pools based upon correctly predicting the 67 tournament games. Having the most points in a pool garners bragging rights and, in many cases, your colleague’s cash.
Interestingly the art, science, and guessing involved in filling out a tournament bracket provides insight into how investors select assets, structure portfolios, and react during volatile market periods. Before we explain answer the following question:
When filling out a tournament bracket, do you:
A) Start by picking the expected national champion and then go backwards and fill out the individual games and rounds to meet that expectation?
B) Analyze each opening round matchup, picking winners, and then repeat the process with your second round matchups until you make your best guess at who the champion will be?
If you chose answer A, you fill out your pool based on a fixed notion for which team is the best in the country. In doing so, you disregard the potential path, no matter how hard, that team must take to become champions.
If you went with the second answer, B, you compare each potential matchup, analyze each team’s respective records, strengths of schedule, demonstrated strengths and weaknesses, record against common opponents and even how travel and geography might affect performance. While we may have exaggerated the amount of research you conduct, such a methodical game by game evaluation is repeated over and over again until a conclusion is reached about which team can win six consecutive games and become the national champion.
Outcome-Based Strategies
Outcome-based investment strategies start with an expected result, typically based on recent trends or historical averages. Investors following this strategy presume that such trends or averages, be they economic, earnings, prices, or a host of other factors, will continue to occur as they have in the past. How many times have you heard Wall Street “gurus” preach that stocks historically return 7%, and therefore a well-diversified portfolio should expect the same return this year? Rarely do they mention corporate and economic fundamentals or valuations. Many investors blindly take the bait and fail to question the assumptions that drive the investment selection process.
Buy and hold and constant dollar cost averaging along with a host of passive strategies, all of which are largely agnostic to valuation, are outcome based strategies. These strategies can appear full proof for years on end as we have been witnessing. However, as seen twice in the last 20 years, when these strategies are followed blindly without appreciating a portfolio’s risk/return profile, dramatic losses will eventually occur. Outcome-based strategies break a cardinal rule of building wealth; avoid as much of the downside as possible in bear markets.
“The past is no guarantee of future results” is a typical investment disclaimer. However, it is this same outcome-based methodology and logic that many investors rely upon to allocate their assets.
Process-Based Strategies
Process-based investment strategies, on the other hand, have methods that establish expectations for the factors that drive asset prices in the future. Such analysis normally includes economic forecasts, technical analysis, and a bottom-up assessment of an asset’s ability to generate cash flow. Process-based investors do not just assume that yesterday’s winners will be tomorrow’s winners, nor do they diversify just for the sake of diversification. These investors have a method that helps them forecast the assets that are likely to provide the best risk/reward prospects and they deploy capital opportunistically.
Well managed process-based strategies, at times, hold significant amounts of cash. To wit, Warren Buffett is currently sitting on $128 billion in cash. This may have cost him over the last few years, but he has a reason for being so risk averse and is sticking to his process.
Buffett and others are certainly not enamored with historically low cash yields on their cash per se, but they have done significant research and cannot find enough assets offering a suitable value/risk proposition in their opinion. These managers are not compelled to buy an asset because it “promises” a historical return.
What Are We?
At RIA Advisors, we follow a process. We use a combination of technical and fundamental analysis, along with a strong assessment of macroeconomic factors to develop an investing framework and investment guidelines. This process allows us to:
Properly choose assets for the short term as well as the longer term (trading vs. investing).
Determine the proper allocations to various asset classes and sub-asset classes.
Measure and monitor risk which helps limit downside by forcing us to exit positions when we are wrong, and take profits to rebalance asset weightings when we are right.
Investing can be easy at times as it was for most of 2019. It can also be very difficult as we are currently witnessing. Having a process and adhering to it does not eliminate risk, but it helps manage risks and limit mistakes. It also helps us sleep at night and avoids letting our emotions dictate our trading activity.
A or B?
Most NCAA basketball pool participants fill out tournament brackets, starting with the opening round games and progress towards the championship match. Sure, they have biases and opinions that favor teams throughout the bracket, but at the end of the day, they have done some analysis to consider each potential matchup. So, why do many investors use a less rigorous process in investing than they do in filling out their NCAA tournament brackets?
Starting at the final game and selecting a national champion is similar to identifying a return goal of 10%, for example, and buying assets that are forecast to achieve that return. How that goal is achieved is subordinated to the pleasant but speculative idea that one will achieve it. In such an outcome-based approach, decision-making is predicated on an expected result.
Considering each matchup in the NCAA tournament to ultimately determine the winner applies a process-oriented approach. Each of the 67 selections is based on the evaluation of the comparative strengths and weaknesses of teams. The expected outcome is a result of the analysis of the many factors required to achieve the outcome.
Summary
Winning a bracket has its benefits, while the costs are minimal. Managing wealth, however, can provide great rewards but is fraught with severe risks at times. Accordingly, wealth management deserves considerably more thoughtfulness than filling out a bracket.
Over the long run, those that follow a well-thought out, time-tested, process-oriented approach will raise the odds of success in compounding wealth by limiting damaging losses during major market setbacks and by being afforded generational opportunities when others are fearfully selling.
Technically Speaking: On The Cusp Of A Bear Market
“Tops are a process, and bottoms are an event”
Over the last couple of years, we have discussed the ongoing litany of issues that plagued the underbelly of the financial markets.
The “corporate credit” markets are at risk of a wave of defaults.
Earnings estimates for 2019 fell sharply, and 2020 estimates are now on the decline.
Stock market targets for 2020 are still too high, along with 2021.
Rising geopolitical tensions between Russia, Saudi Arabia, China, Iran, etc.
The impact of the “coronavirus,” and the shutdown of the global supply chain, will impact exports (which make up 40-50% of corporate profits) and economic growth.
The collapse in oil prices is deflationary and can spark a wave of credit defaults in the energy complex.
European growth, already weak, continues to weaken, and most of the EU will likely be in recession in the next 2-quarters.
Valuations remain at expensive levels.
Long-term technical signals have become negative.
The collapse in equity prices, and coronavirus fears, will weigh on consumer confidence.
Rising loan delinquency rates.
Auto sales are signaling economic stress.
The yield curve is sending a clear message that something is wrong with the economy.
Rising stress on the consumption side of the equation from retail sales and personal consumption.
I could go on, but you get the idea.
In that time, these issues have gone unaddressed, and worse dismissed, because of the ongoing interventions of Central Banks.
However, as we have stated many times in the past, there would eventually be an unexpected, exogenous event, or rather a “Black Swan,” which would “light the fuse” of a bear market reversion.
Over the last few weeks, the market was hit with not one, but two, “black swans” as the “coronavirus” shutdown the global supply chain, and Saudi Arabia pulled the plug on oil price support. Amazingly, we went from “no recessionin sight”, to full-blown “recession fears,” in less than month.
“Given that U.S. exporters have already been under pressure from the impact of the “trade war,” the current outbreak could lead to further deterioration of exports to and from China, South Korea, and Japan. This is not inconsequential as exports make up about 40% of corporate profits in the U.S. With economic growth already struggling to maintain 2% growth currently, the virus could shave between 1-1.5% off that number.
With our Economic Output Composite Indicator (EOCI) already at levels which has previously denoted recessions, the “timing” of the virus could have more serious consequences than currently expected by overzealous market investors.”
On The Cusp Of A Bear Market
Let me start by making a point.
“Bull and bear markets are NOT defined by a 20% move. They are defined by a change of direction in the trend of prices.”
There was a point in history where a 20% move was significant enough to achieve that change in overall price trends. However, today that is no longer the case.
Bull and bear markets today are better defined as:
“During a bull market, prices trade above the long-term moving average. However, when the trend changes to a bear market prices trade below that moving average.”
This is shown in the chart below, which compares the market to the 75-week moving average. During “bullish trends,” the market tends to trade above the long-term moving average and below it during “bearish trends.”
In the last decade, there have been three previous occasions where the long-term moving average was violated but did not lead to a longer-term change in the trend.
The first was in 2011, as the U.S. was dealing with a potential debt-ceiling and threat of a downgrade of the U.S. debt rating. Then Fed Chairman Ben Bernanke came to the rescue with the second round of quantitative easing (QE), which flooded the financial markets with liquidity.
The second came in late-2015 and early-2016 as the market dealt with a Federal Reserve, which had started lifting interest rates combined with the threat of the economic fallout from Britain leaving the European Union (Brexit). Given the U.S. Federal Reserve had already committed to hiking interest rates, and a process to begin unwinding their $4-Trillion balance sheet, the ECB stepped in with their own version of QE to pick up the slack.
The latest event was in December 2018 as the markets fell due to the Fed’s hiking of interest rates and reduction of their balance sheet. Of course, the decline was cut short by the Fed reversal of policy and subsequently, a reduction in interest rates and a re-expansion of their balance sheet.
Had it not been for these artificial influences, it is highly likely the markets would have experienced deeper corrections than what occurred.
On Monday, we have once again violated that long-term moving average. However, Central Banks globally have been mostly quiet. Yes, there have been promises of support, but as of yet, there have not been any substantive actions.
However, the good news is that the bullish trend support of the 3-Year moving average (orange line) remains intact for now. That line is the “last line of defense” of the bull market. The only two periods where that moving average was breached was during the “Dot.com Crash” and the “Financial Crisis.”
(One important note is that the “monthly sell trigger,” (lower panel) was initiated at the end of February which suggested there was more downside risk at the time.)
None of this should have been surprising, as I have written previously, prices can only move so far in one direction before the laws of physics take over. To wit”
“Like a rubber band that has been stretched too far – it must be relaxed before it can be stretched again. This is exactly the same for stock prices that are anchored to their moving averages. Trends that get overextended in one direction, or another, always return to their long-term average. Even during a strong uptrend or strong downtrend, prices often move back (revert) to a long-term moving average.”
With the markets previously more than 20% of their long-term mean, the correction was inevitable, it just lacked the right catalyst.
The difference between a “bull market” and a “bear market” is when the deviations begin to occur BELOW the long-term moving average on a consistent basis. With the market already trading below the 75-week moving average, a failure to recover in a fairly short period, will most likely facilitate a break below the 3-year average.
If that occurs, the “bear market” will be official and will require substantially lower levels of equity risk exposure in portfolios until a reversal occurs.
Currently, it is still too early to know for sure whether this is just a “correction” or a “change in the trend” of the market. As I noted previously, there are substantial differences, which suggest a more cautious outlook. To wit:
Downside Risk Dwarfs Upside Reward.
Global Growth Is Less Synchronized
Market Structure Is One-Sided and Worrisome.
COVID-19 Impacts To The Global Supply Chain Are Intensifying
Any Semblance of Fiscal Responsibility Has Been Thrown Out the Window
Peak Buybacks
China, Europe, and the Emerging Market Economic Data All Signal a Slowdown
The Democrats Control The House Which Effectively Nullifies Fiscal Policy Agenda.
The Leadership Of The Market (FAANG) Has Faltered.
Most importantly, the collapse in interest rates, as well as the annual rate of change in rates, is screaming that something “has broken,” economically speaking.
Here is the important point.
Understanding that a change is occurring, and reacting to it, is what is important. The reason so many investors “get trapped” in bear markets is that by the time they realize what is happening, it has been far too late to do anything about it.
Let me leave you with some important points from the legendary Marty Zweig: (h/t Doug Kass.)
Patience is one of the most valuable attributes in investing.
Big money is made in the stock market by being on the right side of the major moves. The idea is to get in harmony with the market. It’s suicidal to fight trends. They have a higher probability of continuing than not.
Success means making profits and avoiding losses.
Monetary conditions exert an enormous influence on stock prices. Indeed, the monetary climate – primarily the trend in interest rates and Federal Reserve policy – is the dominant factor in determining the stock market’s major decision.
The trend is your friend.
The problem with most people who play the market is that they are not flexible.
Near the top of the market, investors are extraordinarily optimistic because they’ve seen mostly higher prices for a year or two. The sell-offs witnessed during that span were usually brief. Even when they were severe, the market bounced back quickly and always rose to loftier levels. At the top, optimism is king; speculation is running wild, stocks carry high price/earnings ratios, and liquidity has evaporated.
I measure what’s going on, and I adapt to it. I try to get my ego out of the way. The market is smarter than I am, so I bend.
To me, the “tape” is the final arbiter of any investment decision. I have a cardinal rule: Never fight the tape!
The idea is to buy when the probability is greatest that the market is going to advance.
Most importantly, and something that is most applicable to the current market:
“It’s okay to be wrong; it’s just unforgivable to stay wrong.” – Marty Zweig
There action this year is very reminiscent of previous market topping processes. Tops are hard to identify during the process as “change happens slowly.” The mainstream media, economists, and Wall Street will dismiss pickup in volatility as simply a corrective process. But when the topping process completes, it will seem as if the change occurred “all at once.”
The same media which told you “not to worry,” will now tell you, “no one could have seen it coming.”
The market may be telling you something important, if you will only listen.
Save
Shedlock: Supply And Demand Shocks Coming Up
Dual economic shocks are underway simultaneously. There are shortages of some things and lack of demand for others.
The coronavirus is delivering a one-two punch to the world economy, laying it low for months to come and forcing investors to reprice equities and bonds to account for lower company earnings.
From one side, the epidemic is hammering the capacity to produce goods as swathes of Chinese factories remain shuttered and workers housebound. That’s stopping production of goods there and depriving companies elsewhere of the materials they need for their own businesses.
With the virus no longer contained to China, increasingly worried consumers everywhere are reluctant to shop, travel or eat out. As a result, companies are likely not only to send workers home, but to cease hiring or investing — worsening the hit to spending.
How the two shocks will reverberate has sparked some debate among economists, with Harvard University Professor Kenneth Rogoff writing this week that a 1970s style supply-shortage-induced inflation jolt can’t be ruled out. Others contend another round of weakening inflation is pending.
Some economists argue that what’s happened is mostly a supply side shock, others have highlighted the wallop to demand as well, to the degree that the distinction matters.
Slowest Since the Financial Crisis
Inflationary or Deflationary?
In terms of prices, it’s a bit of both, but mostly the latter.
There’s a run on sanitizers, face masks, toilet paper ect. Prices on face masks, if you can find them, have gone up.
But that is dwarfed by the demand shock coming from lack of wages for not working, not traveling, not eating out etc.
The lost wages for 60 million people in China locked in will be a staggering hit alone.
That has also hit Italy. It will soon hit the US.
Next add in the fear from falling markets. People, especially boomers proud of their accounts (and buying cars like mad) will stop doing so.
It will be sudden.
Bad Timing
COVID-19 comes at a tricky time for the global economy. Take Japan. The Oct sales tax hike saw GDP fall 1.6% q/q in Q4, taking year-over-year growth negative (black). That's a weak base even before factoring in Q1 deterioration in the manufacturing (blue) & services (red) PMIs… pic.twitter.com/iUZwQ1U2LA
'The stockpiling crisis that has hit supermarkets across Asia has spread to Europe as consumers start hoarding groceries and hygiene products amid fears of a coronavirus pandemic.' https://t.co/uV5OK1zLJj
Like in many other places, Euro zone is vulnerable to COVID-19 because its starting point is so weak. Growth in Q4 was just 0.1% q/q and it's hard to see how 2020 will be much better than 0.5% overall, far below the ECB forecast of 1.1% (as of Dec). Deflation risk is rising… pic.twitter.com/oLUbIKwHLg
The COVID-19 shock is likely to accelerate the structural shift away from brick & mortar retail in the US. Growth in core retail sales was already weak through Jan, even before virus anxiety built (top lhs). COVID-19 is, unfortunately, another reason to order online (top rhs)… pic.twitter.com/feu30pC4pW
There's a debate if COVID-19 is a supply or demand shock. There's evidence of supply disruption in longer delivery times in manufacturing. But we don't for a second worry that prices will rise, because weak demand swamps all that. Net net: negative demand shock dominates by far. pic.twitter.com/OtyMoJHTDT
Deflation is not really about prices. It’s about the value of debt on the books of banks that cannot be paid back by zombie corporations and individuals.
That is what the Fed fears. It takes lower and lower yields to prevent a debt crash. But it is entirely counterproductive and it does not help the consumer, only the asset holders. Fed (global central bank) policy is to blame.
These are the important point all the inflationistas miss.
We also included a set of “rules to follow,” based on our analysis. (For your review, you will find them posted again at the bottom)
Importantly, while we have adhered to our investment process and discipline, to protect capital while participating in the markets, the volatility over the last couple of weeks has been unnerving to say the least. The chart below shows the daily percentage swings.
With markets swinging wildly by 2-3% daily, it has been more nauseating than the 418-foot drop of the Kingda Ka roller coaster in Jackson, NJ. While it seems like last week was another “horrible” week for the market, it actually ended slightly above where we ended last week.
It’s important to keep some perspective with respect to your portfolio management, particularly when volatility surges. Emotions are the biggest risk to your investments, and capital, over time.
We Really Don’t Know
While we laid out a fairly detailed game plan last week, looking a daily, weekly, and monthly indicators, the reality is that we don’t know with any certainty what happens next, particularly when you have an exogenous situation like “COVID-19.”
However, we agree with Carl Swenlin that you can’t rule out a “bear market” has now started, like we saw in 2018, and the highs of the year are in.
“Even though it is not officially a bear market, I think we should begin to interpret charts and indicators in the context of a bear market template.”
We agree, particularly within the scope of the comments made by my colleague Doug Kass on Friday morning:
“The proximate cause for the precipitous drop in yields is the spread of the coronavirus – which is delivering a body blow to global economic growth (which will come to a standstill in the months ahead).
In all likelihood, world GDP growth will likely be flat over the next few months – to unnaturally low levels of activity. To be sure some segments of the economy (in this reset) will not recoup sales and will have a permanent loss, i.e., hotels, travel, etc.
However, other segments of the economy – like technology – will likely recoup almost all the growth delayed by the coronavirus shock.
The next few months will be challenging from an economic standpoint and volatile from a stock market perspective. Moreover, evolving market structure issues will introduce more uncertainty – and likely deliver a continuation of the extreme volatility seen since mid-February.”
We agree with Doug’s view and have spent the last month moving OUT of areas like Basic Materials (XLB), Industrials (XLI), Discretionary (XLY), Energy (XLE), Transports (XTN), and Financials (XLF).
While financials don’t have as much direct “virus” related risk, the risk to major banks is two-fold:
The collapse in “net interest margins” as the Fed cuts rates; and
Potential for a wave of corporate-debt defaults coming from the economic slowdown/recession, particularly in the Energy sector.
The second point was noted by Mish Shedlockon Friday:
“There is a credit implosion coming up. A lot of leveraged drillers and crude suppliers dependent on prices above $50/bbl are going to facing credit defaults.
This will lead to a deflationary outcome. But you can blame the Fed.
Deflation is not really about prices. It’s about the value of debt on the books of banks that cannot be paid back by zombie corporations and individuals.”
Collapsing yields, oil prices, and “emergency rate cuts,” are signs which suggest something has “broken” in the economy. These ramifications are not inconsequential. My friend Eric Hickman, of Kessler Investment Advisors, sent me an excellent note on Friday:
“Unsurprisingly, I think that the Coronavirus is the catalyst to tip the U.S. into a recession. We all know that recessions are not good for stocks, but by how much, and which ones?
The last two recessions hit all sectors of the S&P 500 significantly. Even so-called “defensive sectors” like consumer staples and healthcare got hit by at least a third of their value (33%). We are just two weeks, and 11% away from an all-time high in the S&P 500. There is plenty of downside left.”
He is right.
What we know, with almost absolute certainty, is that we will be in an economic recession within the next couple of quarters. We also know that earnings estimates are still way too elevated to account for the disruption coming from the COVID-19.
What we DON’T KNOW is where the ultimate bottom for the market is. All we can do is navigate the volatility to the best of our ability and recalibrate portfolio risk to adjust for downside risk without sacrificing the portfolio’s ability to quickly adjust for a massive “bazooka-style” monetary intervention from global Central Banks if needed.
This is why, over the last 6-weeks, we have been getting more “defensive” by increasing our CASH holdings to 15% of the portfolio, with our 40% in bonds doing the majority of the heavy lifting in mitigating the risk in our remaining equity holdings.
Regardless, of the hedges and cash, the portfolio management process over the last two weeks has not been pretty and has frayed our nerves. (Despite our best efforts, we are still subject to human emotions). However, for the year, the Sector Rotation model is down 1.7% versus 9% for the S&P 500.
That is volatility we can live with.
Back To Selling Rallies
“At market extremes you are trading nothing but psychology. So…is it time to sell panic? Or is the hysteria just beginning? What’s your time frame? What’s your pain threshold? Volatility has exploded as liquidity has vanished. Bid/offer spreads are wide but not deep. Credit spreads are widening. Here are some stats from the past week:
The 10 year UST yield has dropped from ~1.6% to ~0.8% in just 12 trading sessions.
Gold is up ~$100,
WTI is down ~$12 (a 4 year low,)
S&P is down ~500 points, and
The US Dollar Index has tumbled from a 2 year high to a 1 year low.
The CNN Fear/Greed barometer is at 5.“ – Victor Adair, Polar Futures Group
I have been in this business for a long-time and have rarely seen moves this extreme in a two-week period. For the average investor, it is nearly impossible to stomach. It is times like these, which we have repeatedly warned about, that “buy and hold” strategies become “How Do I Get Out?”
“With the markets extremely extended to the downside so a reflexive rally is likely. However, SPY will trigger a sell signal in the lower panel suggesting that any initial rally will fail and retest of support is likely.”
That is exactly what happened this past week. While we will likely get another reflexive rally in the next week or so, any advance will be one of your better opportunities to raise cash, and reduce overall equity risk, for the time being.
The “equity exposure” in our portfolio models is driven by a series of “weekly signals” which we use to control risk. Importantly, it requires a “confirmation” of the indicators to adjust risk exposure in portfolios accordingly.
On Friday, the markets confirmed that risk exposure in portfolios should be reduced lower for now. Fortunately, we have been reducing risk over the last 6-weeks, as noted above, but the signals have now confirmed our previous actions were correct. If the market breaks the 2-year moving average, we will need to substantially reduce risk further.
As I said above, I am reprinting our rules from last week to use on any rally into the “sell zone” over the next week.
These are the same rules we use to reduce the risk in our portfolio management process, with the exception of #7.
Move slowly. There is no rush in making dramatic changes. Doing anything in a moment of “panic” tends to be the wrong thing.
If you are over-weight equities, DO NOT try and fully adjust your portfolio to your target allocation in one move. Again, after big declines, individuals feel like they “must” do something. Think logically above where you want to be and use the rally to adjust to that level.
Begin by selling laggards and losers. These positions were dragging on performance as the market rose and they led on the way down.
Add to sectors, or positions, that are performing with, or outperforming the broader market if you need risk exposure.
Move “stop-loss” levels up to recent lows for each position. Managing a portfolio without “stop-loss” levels is like driving with your eyes closed.
Be prepared to sell into the rally and reduce overall portfolio risk. There are a lot of positions you are going to sell at a loss simply because you overpaid for them to begin with. Selling at a loss DOES NOT make you a loser. It just means you made a mistake. Sell it, and move on with managing your portfolio. Not every trade will always be a winner. But keeping a loser will make you a loser of both capital and opportunity.
If none of this makes any sense to you – please consider hiring someone to manage your portfolio for you. It will be worth the additional expense over the long term.
In the short-term, there is no need to take on exceptional risk. It is time to take precautionary measures and tighten up stops, add non-correlated assets, raise cash levels, and hedge risk opportunistically on any rally.
As noted last week, this just our approach to controlling risk.
The only unacceptable method of managing risk at this juncture is not having a method to begin with.
The MacroView
If you need help or have questions, we are always glad to help. Just email me.
Be sure and catch our updates on Major Markets (Monday) and Major Sectors (Tuesday) with updated buy/stop/sell levels
Sector-by-Sector
Everything was crushed again this past week, so the difference between leading and lagging sectors is which sector fell faster or slower than the S&P 500 index itself.
Improving – Discretionary (XLY), Real Estate (XLRE), and Staples (XLP)
Last week, we rebalanced our weightings in Real Estate and Staples, as these sectors are now improving in terms of relative performance. After getting very beaten up, we are looking not only for the “risk hedge” of non-virus related sectors but an eventual outperformance of the groups.
We sold our entire stake in Discretionary due to potential earnings impacts from a slowdown in consumption, to supply chain problems, and inventory issues.
Current Positions: Target Weight XLU, XLRE
Outperforming – Technology (XLK), Communications (XLC), and Utilities (XLU)
The correction this past week found support at the 200-dma and we used that opportunity to bring our weightings in all three sectors back to target weights for now. These have “anti-virus” properties, so we are looking for the “risk hedge” relative to the broader market.
We did bring our healthcare positioning back to portfolio weight as the sector will ultimately benefit from a “cure” for the “coronavirus.” Also, with Bernie Sanders now lagging Joe Biden on the Democratic ticket, this removes some of the risk of “nationalized healthcare” from the sector.
Lagging – Industrials (XLI), Financials (XLF), Materials (XLB), and Energy (XLE)
We had started to buy a little energy exposure previously, but closed out of the positions as we were stopped out of our holdings for now. We are going to continue to monitor the space due to its extreme oversold condition and relative value, and will re-enter our positions when stability starts to take hold.
We also sold Financials due to the financial risk from a recessionary impact on the outstanding corporate debt which currently exists. The Fed’s rate cut also impacts the banks Net Interest Margins which makes them less attractive.
Current Position: None
Market By Market
Small-Cap (SLY) and Mid Cap (MDY) – Early last week we sold all small-cap and mid-cap exposure over concerns of the impact of the coronavirus. Remain out of these sectors for now.
Current Position: None
Emerging, International (EEM) & Total International Markets (EFA)
Same as small-cap and mid-cap. Given the spread of the virus and the impact on the global supply chain.
Current Position: None
Dividends (VYM), Market (IVV), and Equal Weight (RSP) – These positions are our long-term “core” positions for the portfolio given that over the long-term markets do rise with economic growth and inflation. We are currently maintaining our core positions unhedged for now. However, on a rally back to short-term resistance we will add hedges to the core.
Current Position:RSP, VYM, IVV, VOOG
Gold (GLD) – This past week, Gold continued its surge higher as stocks plunged lower. Gold is extremely overbought, so be patient for now and move stops up to the recent breakout levels. We sold our GDX position due to the fact mining is people-intensive and is located in countries most susceptible to the virus.
Bonds also broke out to new highs as the correction ensued. On Friday, we took profits in our 20-year bond position (TLT) to reduce our duration slightly, raise cash, and take in some profits. Bonds are extremely overbought now, so be cautious, we are maintaining the rest of our exposures for now but will look to hedge if we begin to see a reversal in rates.
Current Positions:DBLTX, SHY, IEF, PTIAX
Sector / Market Recommendations
The table below shows thoughts on specific actions related to the current market environment.
(These are not recommendations or solicitations to take any action. This is for informational purposes only related to market extremes and contrarian positioning within portfolios. Use at your own risk and peril.)
Portfolio/Client Update:
It’s been a brutal couple of weeks.
This is when portfolio management gets extremely difficult. It is when we have the biggest urge to give in to our emotions. It is when Mike and I lose the most sleep.
Staying true to our discipline and strategy is difficult in times like these. We question everything, every day. Are we in the right place? Do we have too much risk? Are we missing something?
The ghosts of 2000, and 2008, stalk us both, and we are overly protective of YOUR money. We do not take our jobs lightly.
Again this past week, we made some additional changes to the portfolio composition to reduce risk away from the “COVID-19” virus. This rebalancing of risk lowered overall equity exposure, and continued to shift away from risk.
As noted last week, we use WEEKLY signals in order to manage equity exposures and make portfolio adjustments. Therefore, signals are ONLY VALID after the close of business on Friday. Yesterday, we now have a CONFIRMED sell signal to reduce portfolio exposures to 75% of our target allocations.
Fortunately, we are already there, and the hedges in our portfolios, along with bonds, are doing their jobs. We took some further actions to increase cash, and take some profits, and sell some of our laggards.
Be assured we are watching your portfolios very closely. However, if you have ANY questions, comments, or concerns, please don’t hesitate to email me.
Portfolio Actions Taken Last Week
New clients:Only adding new positions as needed.
Dynamic Model: Sold all energy holdings RDS/A, AMLP.
Equity Model: Sold all energy holdings RDS/A, AMLP, and XOM. We were too early on the trade and got stopped out. We will watch for a bottom to re-enter the positions. Sold DOV, VMC, JPM to reduce exposure to Fed rate cuts and virus areas.
ETF Model: Sold XLB, XLI, AMLP, and XLF
Note for new clients:
It is important to understand that when we add to our equity allocations, ALL purchases are initially “trades” that can, and will, be closed out quickly if they fail to work as anticipated. This is why we “step” into positions initially. Once a “trade” begins to work as anticipated, it is then brought to the appropriate portfolio weight and becomes a long-term investment. We will unwind these actions either by reducing, selling, or hedging if the market environment changes for the worse.
THE REAL 401k PLAN MANAGER
A Conservative Strategy For Long-Term Investors
The 401k plan allocation plan below follows the K.I.S.S. principle. By keeping the allocation simplified, it allows for better control of the allocation, and closer tracking to the benchmark objective over time. (If you want to make it more complicated, you can, however, statistics show simply adding more funds does not increase performance to any significant degree.)
If you need help after reading the alert; do not hesitate to contact me.
Model performance is based on a two-asset model of stocks and bonds relative to the weighting changes made each week in the newsletter. This is strictly for informational and educational purposes only and should not be relied upon for any reason. Past performance is not a guarantee of future results. Use at your own risk and peril.
401k Plan Manager Live Model
As an RIA PRO subscriber(You get your first 30-days free) you have access to our live 401k p
The code will give you access to the entire site during the 401k-BETA testing process, so not only will you get to help us work out the bugs on the 401k plan manager, you can submit your comments about the rest of the site as well.
We are building models specific to company plans. So, if you would like to see your company plan included specifically, send me the following:
Name of the company
Plan Sponsor
A print out of your plan choices. (Fund Symbol and Fund Name)
If you would like to offer our service to your employees at a deeply discounted corporate rate, please contact me.
#WhatYouMissed On RIA This Week: 03-06-20
We know you get busy and don’t check our website as often as you might like. Plus, with so much content being pushed out every week from the RIA Team, we thought we would send you a weekly synopsis of everything you might have missed.
Buy and hold is not a process… Buy and hold is a recipe to give back half or more of what you have earned over the last 5-10 years. Have a process and understand risk. You can make back money but not time.
— Michael Lebowitz, CFA (@michaellebowitz) March 5, 2020
Worst advice ever via @CNBC "Unless you’re selling investments, you’re not actually incurring a loss." NO – you just lost money and by the time you get back to even you lost something even more important – TIME!
The Fed cut 75bps for no reason at all in 2019. Think about that as you consider what they may do in the coming days.
— Michael Lebowitz, CFA (@michaellebowitz) March 2, 2020
From worst to best in one day. This is the "sellable rally" we discussed last week, be sure an use it as such. Rental trades will be sold and portfolios rebalanced to reduce "virus" exposures. pic.twitter.com/cMYP0oc8Ed
“A good person is as rare as a black swan”- Decimus Juvenal
In 2007, Nassim Taleb wrote a bestselling and highly impactful book titled The Black Swan: The Impact of the Highly Improbable. The book uses the analogy of a black swan to describe negative events that appear to be very rare and occur without warning. Since the book was published, the term black swan has been overused to describe all kinds of events that were predictable to some degree.
Last April, we wrote A Fly in the Ointment, which was one of a few articles that pointed out the risk of higher inflation to the markets and economy. Thinking about inflation in the context of the Corona Virus and the Fed’s aggressive monetary policy, might our fly be a black swan.
Corona Virus
The economic impact of the Corona Virus has been negligible thus far in the U.S., but in a growing list of other countries, the impact is high. In China, cities more populated than New York City are being quarantined. Citizens are being told to stay at home, and schools, factories, and shops are closed. Japan just closed all of its schools for at least a month. Airlines have reduced or suspended flights to these troubled regions.
From an inflation perspective, the impact of these actions will be two-fold.
Consumers and businesses will spend less, especially on elastic goods. Elastic goods are products that are easy to forego or replace with another good. Examples are things like movies, coffee at Starbucks, cruises, and other non-necessities. Inelastic goods are indispensable or those with no suitable replacement. Examples are essential medicines, water, and food. Many items fall somewhere between perfectly elastic and perfectly inelastic, and in many cases, the classification is dependent upon the consumer.
On the supply side of the inflation equation, production suspensions are leading to shortages of parts and final goods. Companies must either do without them and slow/suspend production or find new and more expensive sources.
We are purposely leaving out the role that the supply of money plays in inflation for now.
With that as a backdrop, we pose the following questions to help you assess how the virus may impact prices.
Will producers of elastic goods lower prices if demand falters?
If so, will lower prices induce more consumption?
Can producers lower the prices of goods if the cost to produce those goods rise?
How much margin compression can companies tolerate?
Will producers of inelastic goods try to pass on the higher costs of goods, due to supply chain problems, to consumers?
Inflationary or deflationary?
We do not have the answers to the questions but make no mistake; inflation related to hampered supply lines could more than offset weakened demand and pose a real inflation risk.
“One of the most pernicious of these issues in our “modern and sophisticated” intellectual age is that of inflation. Most people, when asked to define inflation, would say “rising prices” with no appreciation for the fact that price movements are an effect, not a cause. They are a symptom of monetary circumstances. Inflation defined is, in fact, a disequilibrium between the amount of currency entering an economic system relative to the productive output of that same system.”
For the past decade, the Fed has consistently sought to generate more inflation. They have kept interest rates lower than normal given the tepid economic growth trends. Further, they employed four rounds of QE. QE provides reserves to banks, which increases their ability to create money. Easy money policies, the type we have grown accustomed to, is designed to increase inflation.
On March 3, 2020, the Fed cut interest rates to try to offset the negative economic impact of the Corona Virus. How lower interest rates will cure a disease is a question for another day. Today’s big question is the Fed fueling the embers of inflation with this sudden rate cut?
Enter the Black Swan
What would the Fed need to do if inflation were to rise due to compromised supply lines and overly aggressive Fed actions? If inflation becomes a problem, they would need to do the opposite of what they have been doing, raise interest rates and reduce the assets on their balance sheet (QT).
Such policy worked well in the 1970s when Fed Chairman Paul Volker increased Fed Funds to 20% and restricted money supply to bring down double-digit inflation. Today, however, such a prudent policy response would be incredibly problematic due to the massive amount of debt the U.S. and its citizens have accumulated. The graph below shows that there is about three and a half times more debt than annual economic activity currently in the U.S.
Unlike the 1970s, when household, corporate, and public debt levels were much lower, higher interest rates and less liquidity today would inevitably result in massive defaults by both consumers and corporations. Further, it would cause a surge in the Federal budget deficit as interest expense on U.S. Treasury debt would rise.
Over the last few decades, we have seen a steady decline in interest rates. At times in this cycle, rates have risen moderately. Each time this occurred, a crisis developed as funding problems arose. What would happen today if mortgage rates rose to 7% and auto loans to 5%? What would happen to corporate profits if borrowing rates doubled from current levels? How would corporations that depend on routine, cheap refinancing of their debt obtain it?
In such an environment, taking on new debt would be much less appealing and servicing existing debt would require a larger portion of the budget. Clearly, an inflationary outbreak accompanied by higher interest rates would result in a severe recession.
Summary
What is a black swan? A black swan is an unforeseen event like the rapid spreading of the Corona Virus that results in inflation. It is not the obvious outcome but rather an obscure second or third-order effect. Our modern economic policy framework is not designed for inflation, nor are many people even thinking about it as a possibility. That is a black swan.
Inflation is the one thing that prevents the Fed and other central banks from supporting the economy and markets in the way they have become accustomed.
As discussed in prior articles, we believe there is ample evidence of problematic inflation data for those who choose to look. At the same time, global central bankers continue to engage in imprudent policies that are inflationary in nature. Lastly, the Corona Virus threatens to hamper supply lines and change consumer spending habits.
Whether or not those factors result in inflation is unknown. Although one cannot predict the future, one can prepare for it. Inflation is not dead, but it has been hibernating for decades. Even if the odds of inflation are relatively low, that does not mean we should ignore them. As the sub-title to Taleb’s book says, “The Impact of the Highly Improbable” can be important. An event that has a 1% chance of occurring but would cause a massive loss of wealth should not be ignored.
We respect your privacy and will only send you email that is related to what you subscribed to and why you subscribed. You can unsubscribe whenever you want with just a click of your mouse. For more information please see... Disclosure & Privacy Policy.