On Jan 3rd, I wrote an article entitled: “Will The Market Repeat The Start Of 2018?” At that time, the Federal Reserve was dumping a tremendous amount of money into the financial markets through their “Repo” operations. To wit:
“Don’t fight the Fed. That is the current mantra of the market as we begin 2020, and it certainly seems to be the right call. Over the last few months, the Federal Reserve has continued its “QE-Not QE” operations, which has dramatically expanded its balance sheet. Many argue, rightly, the current monetary interventions by the Fed are technically “Not QE” because they are purchasing Treasury Bills rather than longer-term Treasury Notes.
However, ‘Mr. Market’ doesn’t see it that way. As the old saying goes, ‘if it looks, walks, and quacks like a duck…it’s a duck.'”
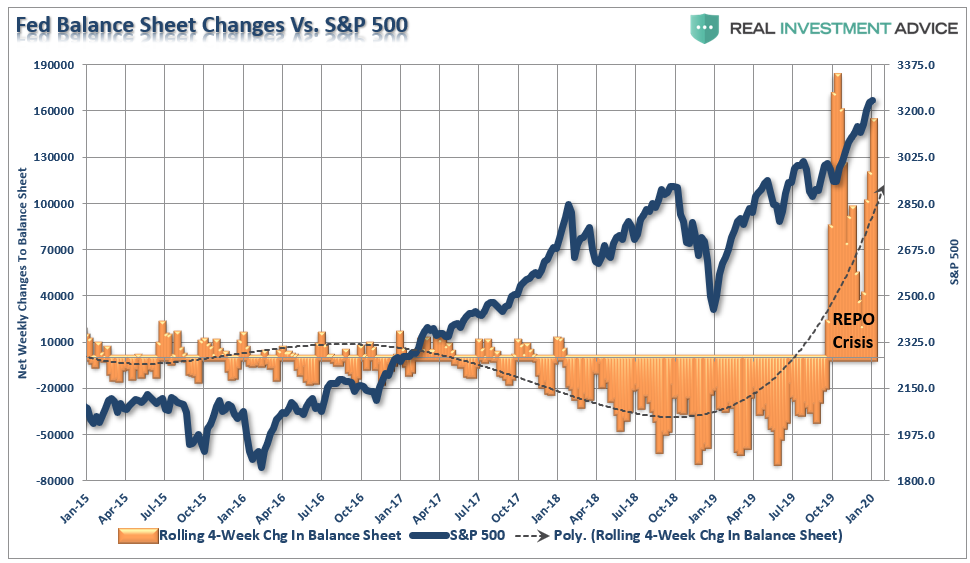
As I noted then, despite commentary to the contrary, there were only two conclusions to draw from the data:
- There is something functionally “broken” in the financial system which is requiring massive injections of liquidity to try and rectify, and;
- The surge in liquidity, whether you want to call it a “duck,” or not, is finding its way into the equity markets.
Let me remind you this was all BEFORE the outbreak of the Coronavirus.

The Ghosts Of 2018
“Well, this past week, the market tripped ‘over its own feet’ after prices had created a massive extension above the 50-dma as shown below. As I have previously warned, since that extension was so large, a correction just back to the moving average at this point will require nearly a -6% decline.”
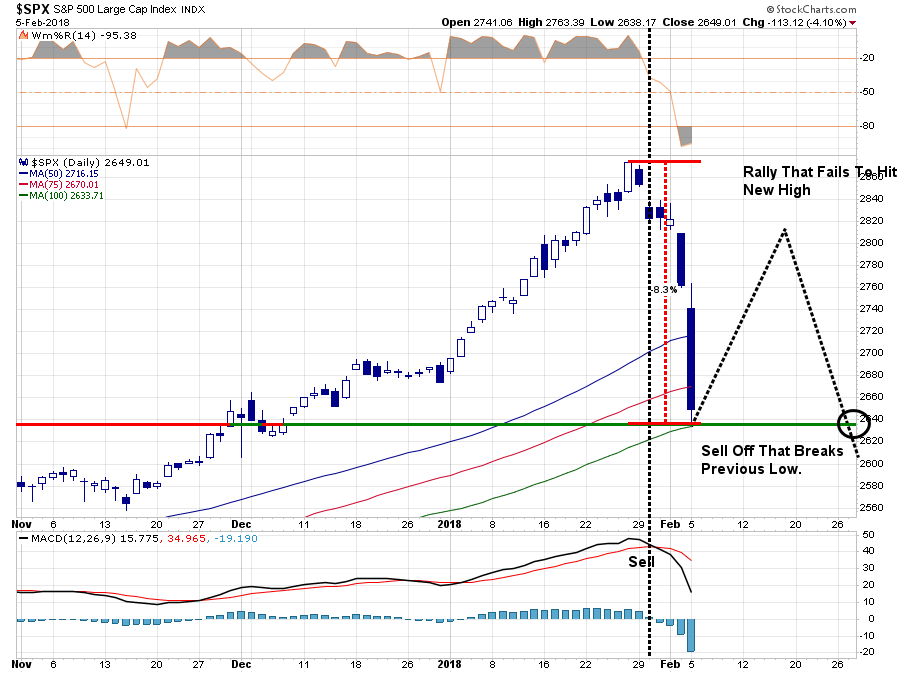
“I have also repeatedly written over the last year:
‘The problem is that it has been so long since investors have even seen a 2-3% correction, a correction of 5%, or more, will ‘feel’ much worse than it actually is, which will lead to ’emotionally driven’ mistakes.’
The question now, of course, is do you “buy the dip” or ‘run for the hills?’”
Yesterday morning, the markets began the day deeply in the red, but by mid-morning were flirting with a push into positive territory. By the end of the day, the Dow had posted its largest one-day point loss in history.”
That was from February 6th, 2018 (Technically Speaking: Tis But A Flesh Wound)
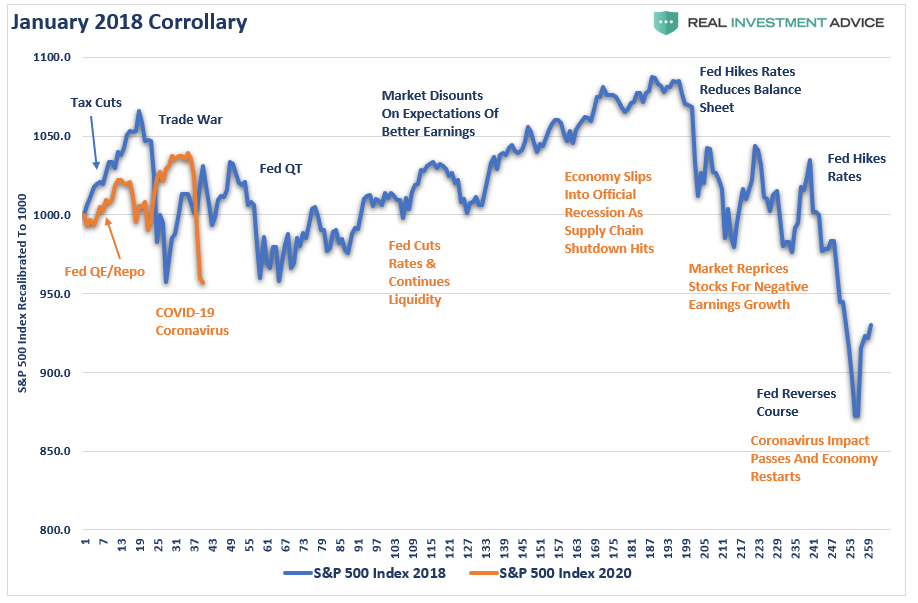
Here is a chart of October 2019 to Present.
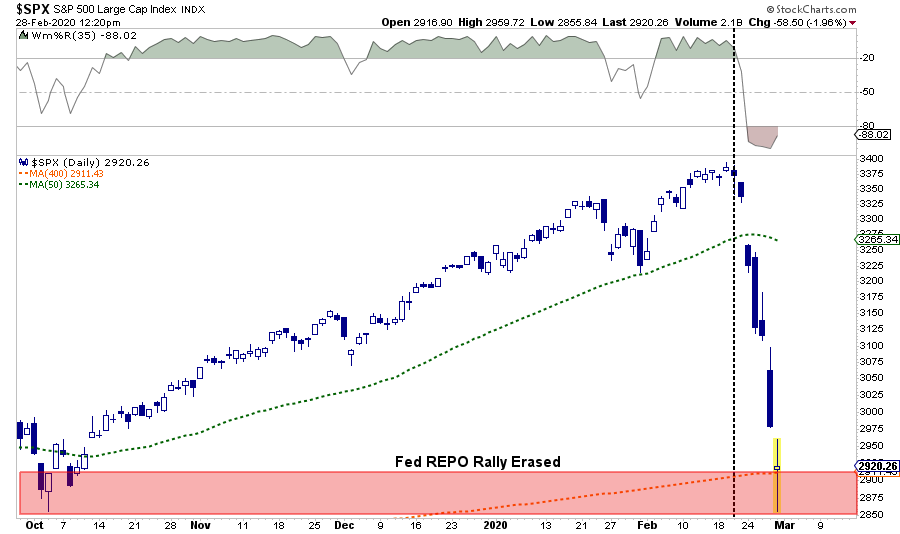
Besides the reality that the only thing that has occurred has been a reversal of the Fed’s “Repo” rally, there is a striking similarity to 2018. That got me to thinking about the corollary between the two periods, and how this might play out over the rest of 2020.
Let’s go back.
Heading in 2018, the markets were ebullient over President Trump’s recently passed tax reform and rate cut package. Expectations were that 2018 would see a massive surge in earnings growth, due to the lower tax rates, and there would be a sharp pickup in economic growth.
However, at the end of January, President Trump shocked the markets with his “Trade War” on China and the imposition of tariffs on a wide variety of products, which potentially impacted American companies. As we said at the time, there was likely to be unintended consequences and would kill the effect of tax reform.)
“While many have believed a ‘trade war’ will be resolved without consequence, there are two very important points that most of the mainstream analysis is overlooking. For investors, a trade war would likely negatively impact earnings and profitability while slowing economic growth through higher costs.”
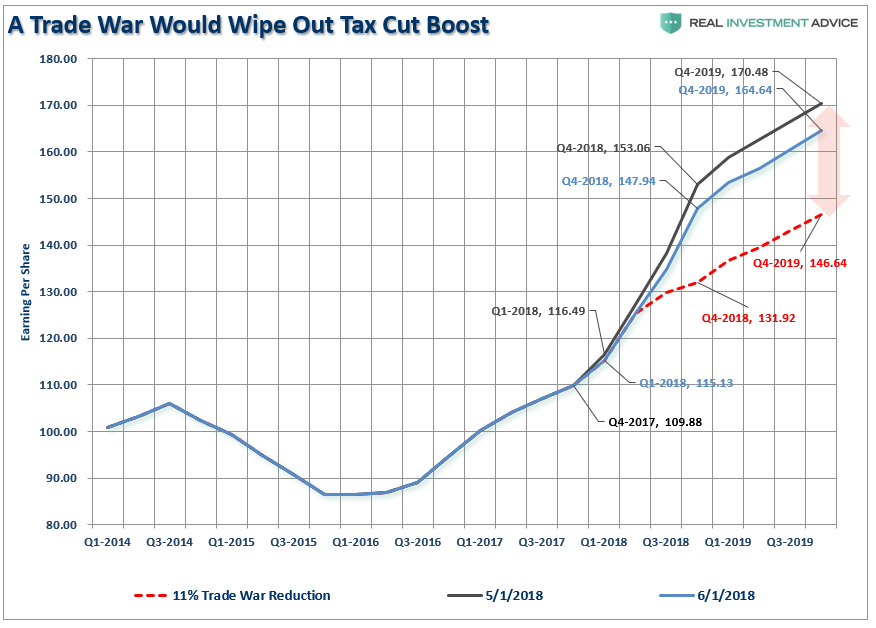
Over the next few months, the market dealt, and came to terms with, the trade war and the Fed’s tightening of the balance sheet. As we discussed in May 2018, the trade war did wind up clipping earnings estimates to a large degree, but massive share repurchases helped buoy asset prices.
Then in September, the Fed did the unthinkable.
After having hiked rates previously, thereby tightening the monetary supply, they stated that monetary policy was not “close to the neutral rate,” suggesting more rate hikes were coming. The realization the Fed was intent on continuing to tighten policy, and further extracting liquidity by reducing their balance sheet, sent asset prices plunging 20% from the peak, to the lows on Christmas Eve.

It was then the Fed acquiesced to pressure from the White House and began to quickly reverse their stance and starting pumping liquidity back into the markets.
And the bull market was back.
Fast forward to 2020.
“The exuberance that surrounded the markets going into the end of last year, as fund managers ramped up allocations for end of the year reporting, spilled over into the start of the new with S&P hitting new record highs.
Of course, this is just a continuation of the advance that has been ongoing since the Trump election. The difference this time is the extreme push into 3-standard deviation territory above the moving average, which is concerning.” – Real Investment Report Jan, 5th 2018
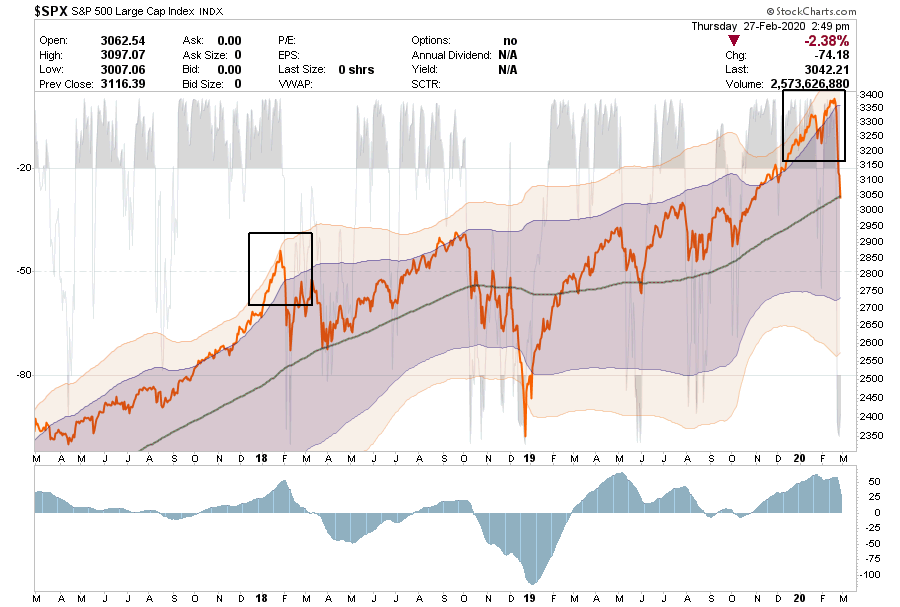
As noted in the chart below, in both instances, the market reached 3-standard deviations above the 200-dma before mean-reverting.
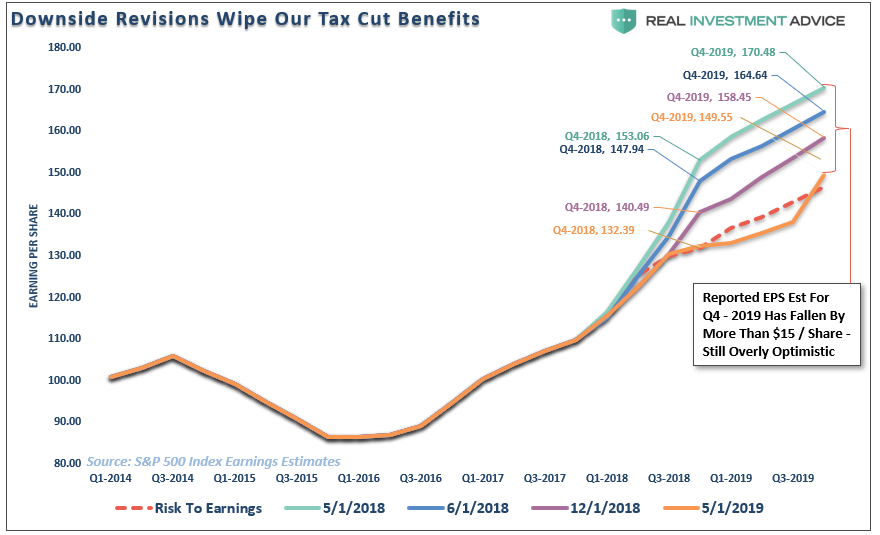
Of course, while everyone was exuberant over the Fed’s injections of monetary support, we were discussing the continuing decline in earnings growth estimates, along with the lack of corporate profit growth. To wit:
With equities now more than 30% higher than they were then, the Fed mostly on hold in terms of rate cuts, and ‘repo’ operations starting to slow, it certainly seems that expectations for substantially higher market values may be a bit optimistic.
Furthermore, as noted above, earnings expectations declined for the entirety of 2019, as shown in the chart below. However, the impact of the ‘coronavirus’ has not been adopted into these reduced estimates as of yet. These estimates WILL fall, and likely markedly so, which, as stated above, is going to make justifying record asset prices more problematic.”
Just as the “Trade War” shocked the markets and caused a repricing of assets in 2018, the “coronavirus” has finally infected the markets enough to cause investors to adjust their expectations for earnings growth. Importantly, as in 2018, earnings estimates have not been revised lower nearly enough to compensate for the global supply chain impact coming from the virus.
While the beginning of 2020 is playing out much like 2018, what about the rest of the year?
There are issues occurring which we believe will have a very similar “feel” to 2018, as the impact of the virus continues to ebb and flow through the economy. The chart below shows the S&P 500 re-scaled to 1000 for comparative purposes.
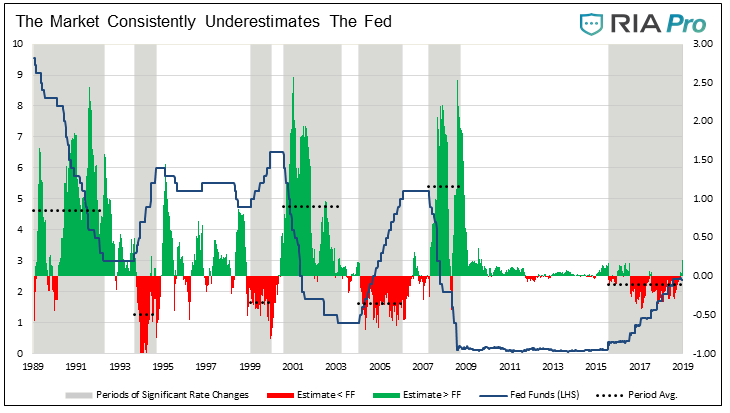
Currently, the expectation has risen to more than a 70% probability the Fed will cut rates 3x in 2020. Historically, the market tends to underestimate just how far the Fed will go as noted by Michael Lebowitz previously:
“The graph below tracks the comparative differentials (Fed Funds vs. Fed Fund futures) using the methodology outlined above. The gray rectangular areas represent periods where the Fed was systematically raising or lowering the Fed funds rate (blue line). The difference between Fed Funds and the futures contracts, colored green or red, calculates how much the market over (green) or under (red) estimated what the Fed Funds rate would ultimately be. In this analysis, the term overestimate means Fed Funds futures thought Fed Funds would be higher than it ultimately was. The term underestimate, means the market expectations were lower than what actually transpired.”
Our guess is that in the next few weeks, the Fed will start using “forward guidance” to try and stabilize the market. Rate cuts, and more “quantitative easing,” will likely follow.
Such actions should stabilize the market in the near-term as investors, who have been pre-conditioned to “buy” Fed liquidity, will once again run back into markets. This could very well lift the markets into second quarter of this year.
But it will likely be a “trap.”
While monetary policy will likely embolden the bulls short-term, it does little to offset an economic shock. As we move further into the year, the impact to the global supply chain will begin to work its way through the system resulting in slower economic growth, reduced corporate profitability, and potentially a recession. (See yesterday’s commentary)
This is a guess. There is a huge array of potential outcomes, and trying to predict the future tends to be a pointless exercise. However, it is the thought process that helps align expectations with potential outcomes to adjust for risk accordingly.

A Sellable Rally
Just as in February 2018, following the sharp decline, the market rallied back to a lower high before failing once again. For several reasons, we suspect we will see the same over the next week or two, as the push into extreme pessimism and oversold conditions will need to be reversed before the correction can continue.
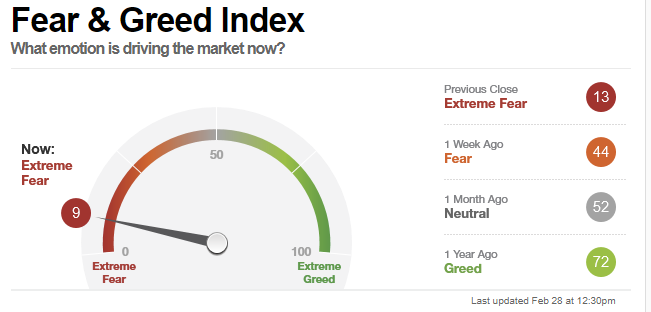
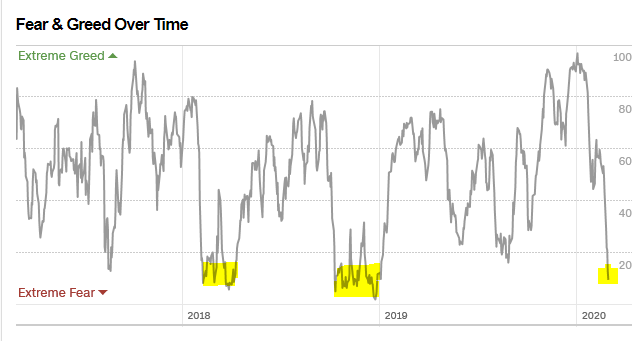
While 2019 ended in an entirely dissimilar manner as compared to 2018, the current negative sentiment, as shown by CNN’s Fear & Greed Index is back to the extreme fear levels seen at the lows of the market in 2018.
On a short-term technical basis, the market is now extremely oversold, which is suggestive of a counter-trend rally over the next few days to a week or so.

It is highly advisable to use ANY reflexive rally to reduce portfolio risk, and rebalance portfolios. Most likely, another wave of selling will likely ensue before a stronger bottom is finally put into place.
Lastly, our composite technical overbought/oversold gauge is also pushing more extreme oversold conditions, which are typical of a short-term oversold condition.
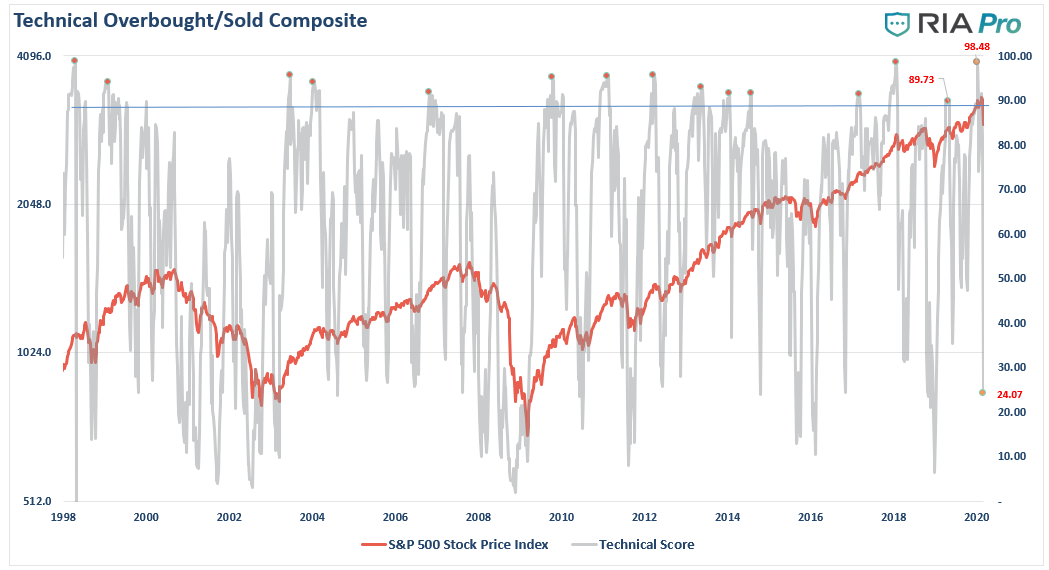
In other words, in 2019 “everyone was in the pool,” in 2020 we just found out “everyone was swimming naked.”

Rules To Follow
One last chart.
I just want you to pay attention to the top panel and the shaded areas. (standard deviations from the 50-dma)

We were not this oversold even during the 2015-2016 decline, much less the two declines in 2018.
Currently, not only is the market extremely oversold on a short-term basis, but is currently 5-standard deviations below the 50-dma.
Let me put that into perspective for you.
- 1-standard deviation = 68.26% of all possible price movement.
- 2-standard deviations = 95.45%
- 3-standard deviations = 99.73%
- 4-standard deviations = 99.993%
- 5-standard deviations = 99.9999%
Mathematically speaking, the bulk of the decline is already priced into the market.
“I get it. We are gonna get a bounce. So, what do I do?”
I am glad you asked.
Step 1) Clean Up Your Portfolio
- Tighten up stop-loss levels to current support levels for each position.
- Take profits in positions that have outperformed during the rally.
- Sell laggards and losers (those that lagged the rally, probably led the decline)
- Raise cash, and rebalance portfolios to reduced risk levels for now.
Step 2) Compare Your Portfolio Allocation To Your Model Allocation.
- Determine areas where exposure needs to be increased, or decreased (bonds, cash, equities)
- Determine how many shares need to be bought or sold to rebalance allocation requirements.
- Determine cash requirements for hedging purposes
- Re-examine the portfolio to ensure allocations are adjusted for FORWARD market risk.
- Determine target price levels for each position.
- Determine “stop loss” levels for each position being maintained.
Step 3) Be Ready To Execute
- Whatever bounce we get will likely be short-lived. So have your game plan together before-hand as the opportunity to rebalance risk will likely not be available for very long.
This is just how we do it.
However, there are many ways to manage risk, and portfolios, which are all fine. What separates success and failure is 1) having a strategy to begin with, and; 2) the discipline to adhere to it.
The recent market spasm certainly reminds of 2018. And, if we are right, it will get better, before it gets worse.

