
“Lenin was certainly right. There is no subtler, no surer means of overturning the existing basis of society than to debauch the currency. The process engages all the hidden forces of economic law on the side of destruction, and does it in a manner which not one man in a million is able to diagnose.”
John Maynard Keynes – The Economic Consequences of Peace 1920
“And when we see that we’ve reached that level we’ll begin to gradually reduce our asset purchases to the level of the underlying trend growth of demand for our liabilities.” –Jerome Powell January 29, 2020.
With that one seemingly innocuous statement, Chairman Powell revealed an alarming admission about the supply of money and your wealth. The current state of monetary policy explains why so many people are falling behind and why wealth inequality is at levels last seen almost 100 years ago.

REALity
“Real” is a very important concept in the field of economics. Real generally refers to an amount of something adjusted for the effects of inflation. This allows economists to measure true organic growth or decline.
Real is equally important for the rest of us. The size of our paycheck or bank account balance is meaningless without an understanding of what money can buy. For instance, an annual income of $25,000 in 1920 was about eight times the national average. Today that puts a family of four below the Federal Poverty Guideline. As your grandfather used to say, a dollar doesn’t go as far as it used to.
Real wealth and real wage growth are important for assessing your economic standing and that of the nation.
Here are two facts:
- Wealth is largely a function of the wages we earn
- The wages we earn are predominately a function of the growth rate of the economy
These facts establish that the prosperity and wealth of all citizens in aggregate is meaningfully tied to economic growth or the output of a nation. It makes perfect sense.
Now, let us consider inflation and the role it plays in determining our real wages and real wealth.
If the rate of inflation is less than the rate of wage growth over time, then our real wages are rising and our wealth is increasing. Conversely, if inflation rises at a pace faster than wages, wealth declines despite a larger paycheck and more money in the bank.
With that understanding of “real,” let’s discuss inflation.
What is Inflation?
Borrowing from an upcoming article, we describe inflation in the following way:
“One of the most pernicious of these issues in our “modern and sophisticated” intellectual age is that of inflation. Most people, when asked to define inflation, would say “rising prices” with no appreciation for the fact that price movements are an effect, not a cause. They are a symptom of monetary circumstances. Inflation defined is, in fact, a disequilibrium between the amount of currency entering an economic system relative to the productive output of that same system.”
The price of cars, cheeseburgers, movie tickets, and all the other goods and services we consume are chiefly based on supply and demand. Demand is a function of both our need and desire to own a good and, equally importantly, how much money we have. The amount of money we have in aggregate, known as money supply, is governed by the Federal Reserve. Therefore, the supply of money is a key component of demand and therefore a significant factor affecting prices.
With the linkage between the supply of money and inflation defined, let us revisit Powell’s recent revelation.
“And when we see that we’ve reached that level we’ll begin to gradually reduce our asset purchases to the level of the underlying trend growth of demand for our liabilities.”
In plain English, Powell states that the supply of money is based on the demand for money and not the economic growth rate. To clarify, one of the Fed’s largest liabilities currently are bank reserves. Banks are required to hold reserves for every loan they make. Therefore, they need reserves to create money to lend. Ergo, “demand for our liabilities,” as Powell states, actually means bank demand for the seed funding to create money and make loans.

The relationship between money supply and the demand for money may, in fact, be aligned with economic growth. If so, then the supply of money should rise with the economy. This occurs when debt is predominately employed to facilitate productive investments.
The problem occurs when money is demanded for consumption or speculation. For example:
- When hedge funds demand billions to leverage their trading activity
- When Apple, which has over $200 billion in cash, borrows money to buy back their stock
- When you borrow money to buy a car, the size of the economy increases but not permanently as you are not likely to buy another car tomorrow and the next day
Now ask, should the supply of money increase because of those instances?
The relationship between the demand for money and economic activity boils down to what percentage of the debt taken on is productive and helps the economy and the populace grow versus what percentage is for speculation and consumption.
While there is no way to quantify how debt is used, we do know that speculative and consumptive debt has risen sharply and takes up a much larger percentage of all debt than in prior eras. The glaring evidence is the sharp rise of debt to GDP.
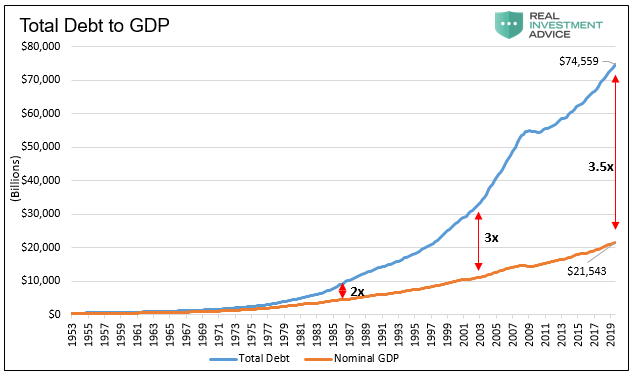
Data Courtesy St. Louis Federal Reserve
If most of the debt were used productively, then the level of debt would drop relative to GDP. In other words, the debt would not only produce more economic growth but would also pay for itself. The exact opposite is occurring as growth languishes despite record levels of debt accumulation.
The speculative markets provide further evidence. Without presenting the long list of asset valuations that stand at or near record levels, consider that since the last time the S&P 500 was fairly valued in 2009, it has grown 375%. Meanwhile, total U.S. Treasury debt outstanding is up by 105% from $11 trillion to $22.5 trillion and corporate debt is up 55% from $6.5 trillion to $10.1 trillion. Over that same period, nominal GDP has only grown 46% and Average Hourly Earnings by 29%.
When the money supply is increased for consumptive and speculative purposes, the Fed creates dissonance between our wages, wealth, and the rate of inflation. In other words, they generate excessive inflation and reduce our real wealth.
If this is the case, why is the stated rate of inflation less than economic growth and wage growth?

The Wealth Scheme
This scheme works like all schemes by keeping the majority of people blind to what is truly occurring. To perpetuate such a scheme, the public must be convinced that inflation is low and their wealth is increasing.
In 2000, a brand new Ford Taurus SE sedan had an original MSRP of $18,935. The 2019 Ford Taurus SE has a starting price of $27,800. Over the last 19 years, the base price of the Ford Taurus has risen by 2.05% a year or a total of 47%. According to the Bureau of Labor Statics (BLS), since the year 2000, the consumer price index for new vehicles has only risen by 0.08% a year and a total of 1.68% over the same period.
For another instance of how inflation is grossly underreported, we highlighted flaws in the reporting of housing prices in MMT Sounds Great in Theory But… To wit:
“Since then, inflation measures have been tortured, mangled, and abused to the point where it scarcely equates to the inflation that consumers deal with in reality. For example, home prices were substituted for “homeowners equivalent rent,” which was falling at the time, and lowered inflationary pressures, despite rising house prices.
Since 1998, homeowners equivalent rent has risen 72% while house prices, as measured by the Shiller U.S. National Home Price Index has almost doubled the rate at 136%. Needless to say, house prices, which currently comprise almost 25% of CPI, have been grossly under-accounted for. In fact, since 1998 CPI has been under-reported by .40% a year on average. Considering that official CPI has run at a 2.20% annual rate since 1998, .40% is a big misrepresentation, especially for just one line item.”
Those two obscene examples highlight that the government reported inflation is not the same inflation experienced by consumers. It is important to note that we are not breaking new ground with the assertion that the government reporting of inflation is low. As we have previously discussed, numerous private assessments quantify that the real inflation rate could easily be well above the average reported 2% rate. For example, Shadow Stats quantifies that inflation is running at 10% when one uses the official BLS formula from 1980.
Despite what we may sense and a multitude of private studies confirming that inflation is running greater than 2%, there are a multitude of other government-sponsored studies that argue inflation is actually over-stated. So, the battle is in the trenches, and the devil is in the details.
As defined earlier, inflation is “a disequilibrium between the amount of currency entering an economic system relative to the productive output of that same system.”
The following graph shows that the supply of money, measured by M2, has grown far more than the rate of economic growth (GDP) over the last 20 years.
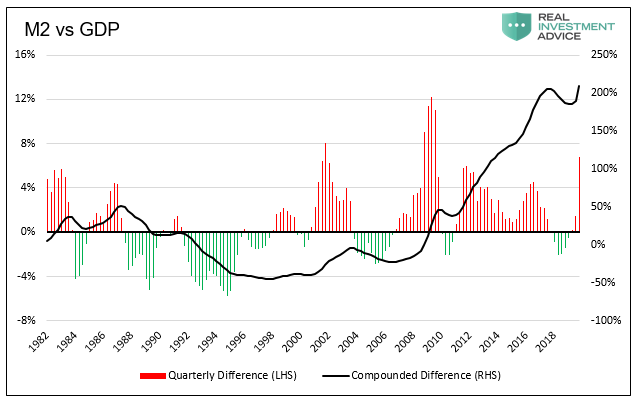
Data St. Louis Federal Reserve
Since 2000, M2 has grown 234% while GDP has grown at half of that rate, 117%. Over the same period, the CPI price index has only grown by 53%. M2 implies an annualized inflation rate over the last 20 years of 6.22% which is three times that of CPI.
Dampening perceived inflation is only part of the cover-up. The scheme is also perpetuated with other help from the government. The government borrows to boost temporary economic growth and help citizens on the margin. This further limits people’s ability to detect a significant decline in their standard of living.
As shown below, when one strips out the change in government debt (the actual increase in U.S. Treasury debt outstanding) from the change in GDP growth, the organic economy has shrunk for the better part of the last 20 years.
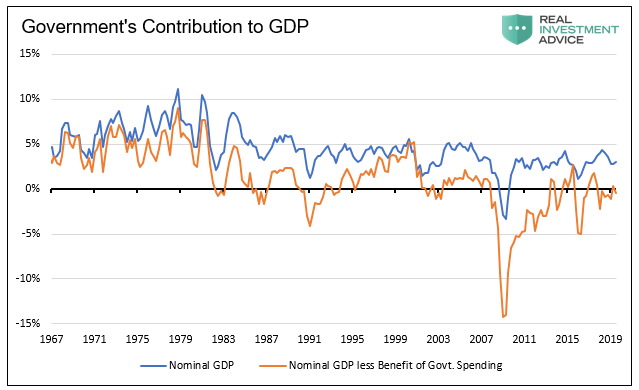
Data St. Louis Federal Reserve
It doesn’t take an economist to know that a 6.22% inflation rate (based on M2) and decade long recession would force changes to our monetary policy and send those responsible to the guillotines. If someone suffering severe headaches is diagnosed with a brain tumor, the problem does not go away because the doctor uses white-out to cover up the tumor on the x-ray film.
Despite crystal clear evidence, the mirages of economic growth and low inflation prevent us from seeing reality.

Summary
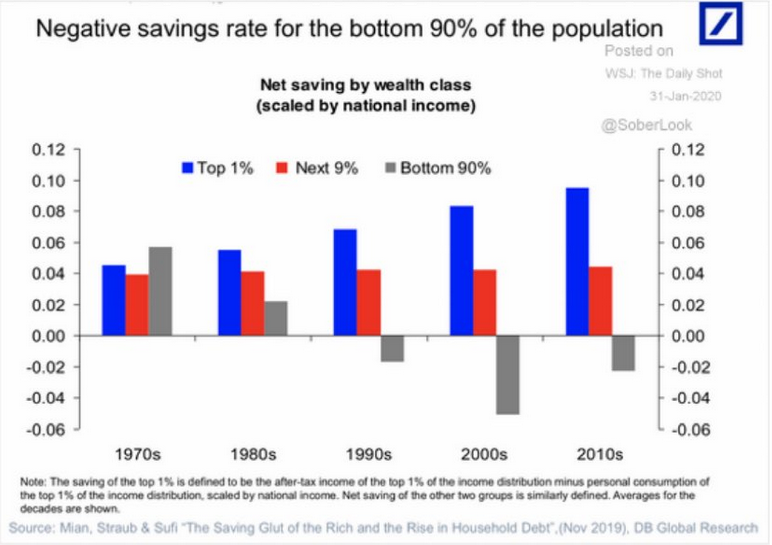
Those engaging in speculative ventures with the benefit of cheap borrowing costs are thriving. Those whose livelihood and wealth are dependent on a paycheck are falling behind. For this large percentage of the population, their paychecks may be growing in line with the stated government inflation rate but not the true inflation rate they pay at the counter. They fall further behind day by day as shown below.
While this may be hard to prove using government inflation data, it is the reality. If you think otherwise, you may want to ask why a political outsider like Donald Trump won the election four years ago and why socialism and populism are surging in popularity. We doubt that it is because everyone thinks their wealth is increasing. To quote Bill Clinton’s 1992 campaign manager James Carville, “It’s the economy, stupid.”
That brings us back to Jerome Powell and the Fed. The U.S. economy is driven by millions of individuals making decisions in their own best interests. Prices are best determined by those millions of people based on supply and demand – that includes the price of money or interest rates. Any governmental interference with that natural mechanism is a recipe for inefficiency and quite often failure.
If monetary policy is to be set by a small number of people in a conference room in the Eccles Building in Washington, D.C. who think they know what is best for us based on flawed data, then they should prepare themselves for even more radical social and political movements than we have already seen.

