- Playing Defense: We Don’t Know What Happens Next
- MacroView: Fed Emergency Cut Exposes “Recession” Risks
- Financial Planning Corner: Tips For A Volatile Market
- Sector & Market Analysis
- 401k Plan Manager
Follow Us On: Twitter, Facebook, Linked-In, Sound Cloud, Seeking Alpha

Catch Up On What You Missed Last Week

Playing Defense: We Don’t Know What Happens Next
Last week, we discussed “Navigating What Happens Next,” and set out to answer 3-important questions:
- Is the correction over?
- Is this a buying opportunity?
- Has the decade long bull market ended?
We also included a set of “rules to follow,” based on our analysis. (For your review, you will find them posted again at the bottom)
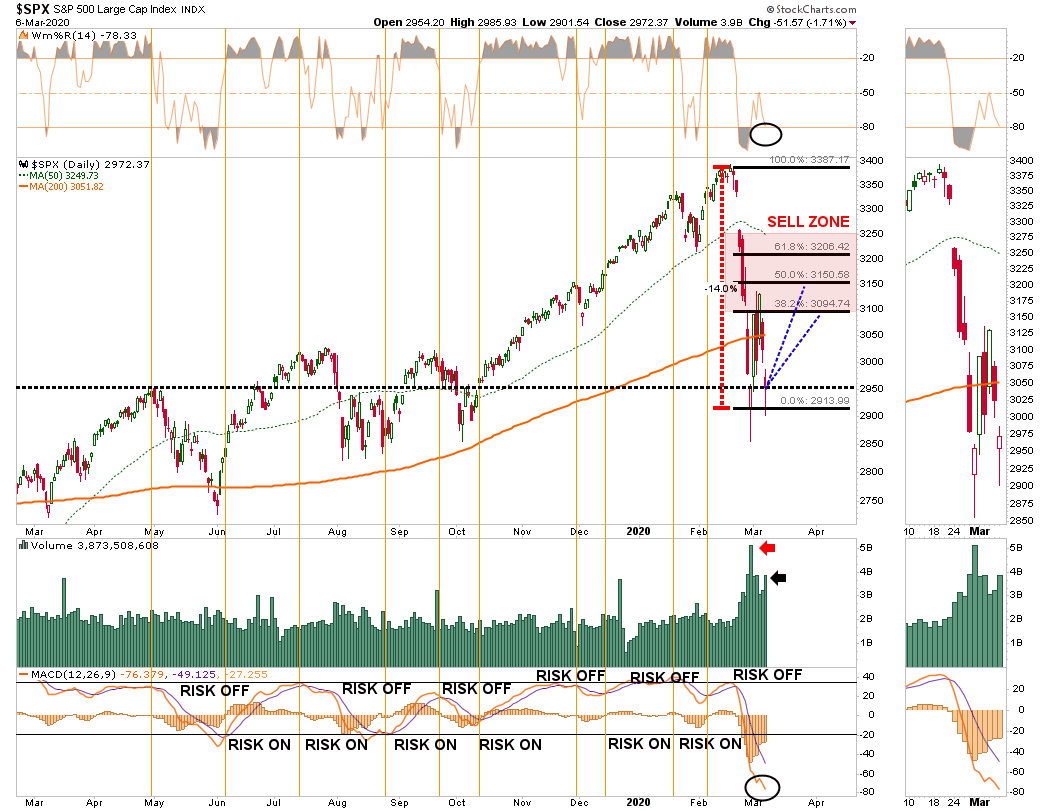
Importantly, while we have adhered to our investment process and discipline, to protect capital while participating in the markets, the volatility over the last couple of weeks has been unnerving to say the least. The chart below shows the daily percentage swings.
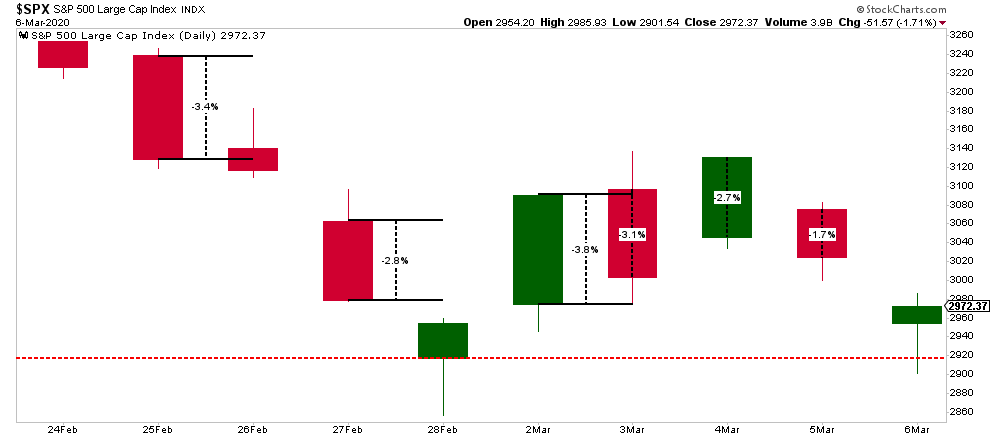
With markets swinging wildly by 2-3% daily, it has been more nauseating than the 418-foot drop of the Kingda Ka roller coaster in Jackson, NJ. While it seems like last week was another “horrible” week for the market, it actually ended slightly above where we ended last week.
It’s important to keep some perspective with respect to your portfolio management, particularly when volatility surges. Emotions are the biggest risk to your investments, and capital, over time.

We Really Don’t Know
While we laid out a fairly detailed game plan last week, looking a daily, weekly, and monthly indicators, the reality is that we don’t know with any certainty what happens next, particularly when you have an exogenous situation like “COVID-19.”
However, we agree with Carl Swenlin that you can’t rule out a “bear market” has now started, like we saw in 2018, and the highs of the year are in.
“Even though it is not officially a bear market, I think we should begin to interpret charts and indicators in the context of a bear market template.”
We agree, particularly within the scope of the comments made by my colleague Doug Kass on Friday morning:
“The proximate cause for the precipitous drop in yields is the spread of the coronavirus – which is delivering a body blow to global economic growth (which will come to a standstill in the months ahead).
In all likelihood, world GDP growth will likely be flat over the next few months – to unnaturally low levels of activity. To be sure some segments of the economy (in this reset) will not recoup sales and will have a permanent loss, i.e., hotels, travel, etc.
However, other segments of the economy – like technology – will likely recoup almost all the growth delayed by the coronavirus shock.
The next few months will be challenging from an economic standpoint and volatile from a stock market perspective. Moreover, evolving market structure issues will introduce more uncertainty – and likely deliver a continuation of the extreme volatility seen since mid-February.”
We agree with Doug’s view and have spent the last month moving OUT of areas like Basic Materials (XLB), Industrials (XLI), Discretionary (XLY), Energy (XLE), Transports (XTN), and Financials (XLF).
While financials don’t have as much direct “virus” related risk, the risk to major banks is two-fold:
- The collapse in “net interest margins” as the Fed cuts rates; and
- Potential for a wave of corporate-debt defaults coming from the economic slowdown/recession, particularly in the Energy sector.
The second point was noted by Mish Shedlock on Friday:
“There is a credit implosion coming up. A lot of leveraged drillers and crude suppliers dependent on prices above $50/bbl are going to facing credit defaults.
This will lead to a deflationary outcome. But you can blame the Fed.
Deflation is not really about prices. It’s about the value of debt on the books of banks that cannot be paid back by zombie corporations and individuals.”
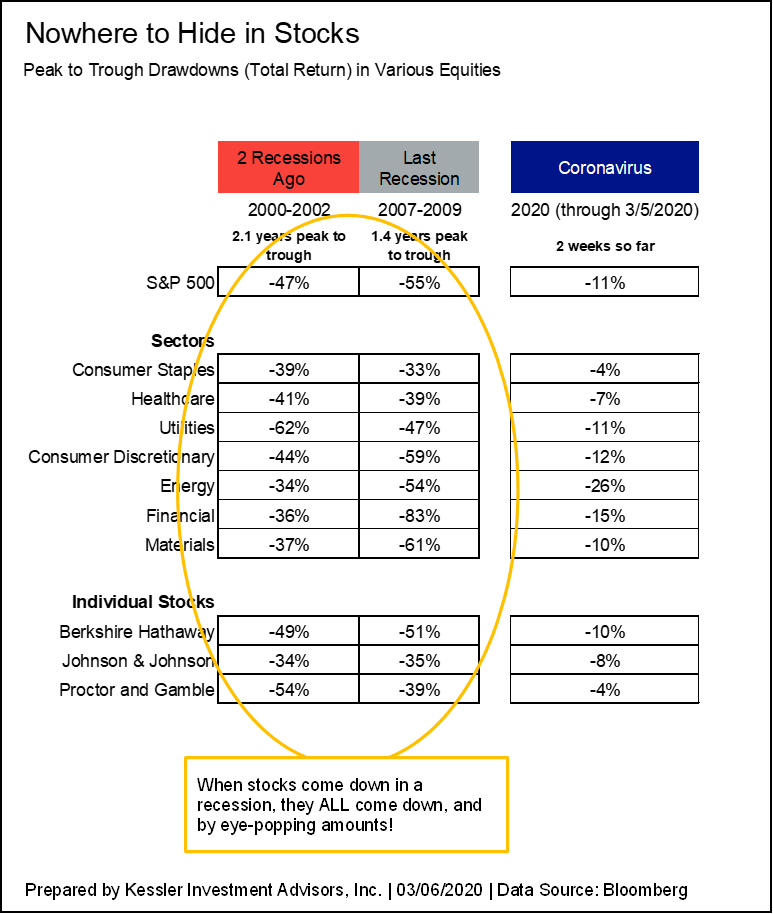
Collapsing yields, oil prices, and “emergency rate cuts,” are signs which suggest something has “broken” in the economy. These ramifications are not inconsequential. My friend Eric Hickman, of Kessler Investment Advisors, sent me an excellent note on Friday:
“Unsurprisingly, I think that the Coronavirus is the catalyst to tip the U.S. into a recession. We all know that recessions are not good for stocks, but by how much, and which ones?
The last two recessions hit all sectors of the S&P 500 significantly. Even so-called “defensive sectors” like consumer staples and healthcare got hit by at least a third of their value (33%). We are just two weeks, and 11% away from an all-time high in the S&P 500. There is plenty of downside left.”
He is right.
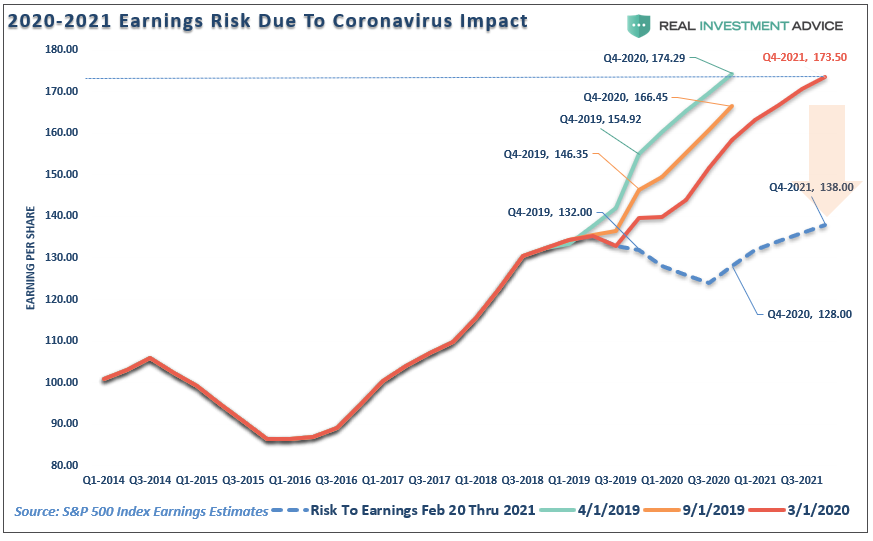
What we know, with almost absolute certainty, is that we will be in an economic recession within the next couple of quarters. We also know that earnings estimates are still way too elevated to account for the disruption coming from the COVID-19.
What we DON’T KNOW is where the ultimate bottom for the market is. All we can do is navigate the volatility to the best of our ability and recalibrate portfolio risk to adjust for downside risk without sacrificing the portfolio’s ability to quickly adjust for a massive “bazooka-style” monetary intervention from global Central Banks if needed.
This is why, over the last 6-weeks, we have been getting more “defensive” by increasing our CASH holdings to 15% of the portfolio, with our 40% in bonds doing the majority of the heavy lifting in mitigating the risk in our remaining equity holdings.
Regardless, of the hedges and cash, the portfolio management process over the last two weeks has not been pretty and has frayed our nerves. (Despite our best efforts, we are still subject to human emotions). However, for the year, the Sector Rotation model is down 1.7% versus 9% for the S&P 500.
That is volatility we can live with.

Back To Selling Rallies
“At market extremes you are trading nothing but psychology. So…is it time to sell panic? Or is the hysteria just beginning? What’s your time frame? What’s your pain threshold? Volatility has exploded as liquidity has vanished. Bid/offer spreads are wide but not deep. Credit spreads are widening. Here are some stats from the past week:
- The 10 year UST yield has dropped from ~1.6% to ~0.8% in just 12 trading sessions.
- Gold is up ~$100,
- WTI is down ~$12 (a 4 year low,)
- S&P is down ~500 points, and
- The US Dollar Index has tumbled from a 2 year high to a 1 year low.
- The CNN Fear/Greed barometer is at 5.“ – Victor Adair, Polar Futures Group
I have been in this business for a long-time and have rarely seen moves this extreme in a two-week period. For the average investor, it is nearly impossible to stomach. It is times like these, which we have repeatedly warned about, that “buy and hold” strategies become “How Do I Get Out?”
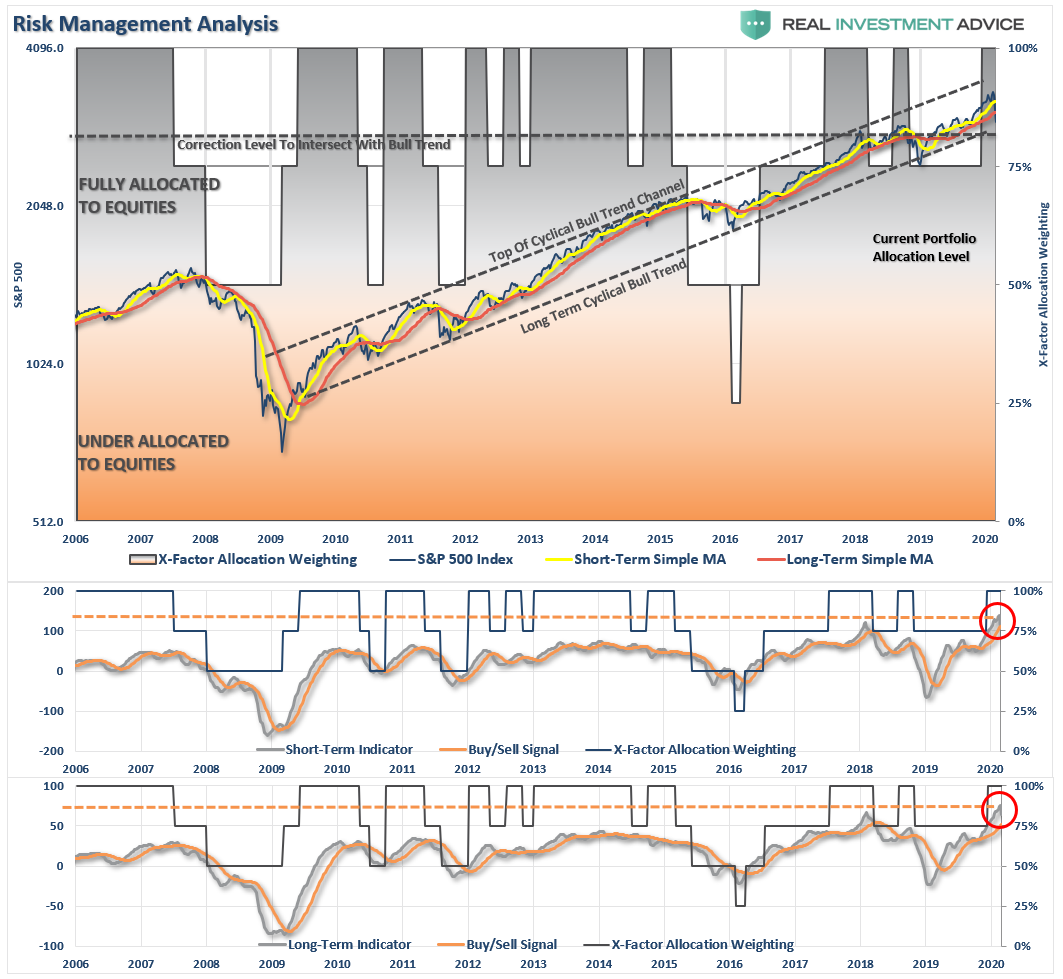
Last week, we discussed the risk with our RIAPro Subscribers (30-Day Risk-Free Trial):
“With the markets extremely extended to the downside so a reflexive rally is likely. However, SPY will trigger a sell signal in the lower panel suggesting that any initial rally will fail and retest of support is likely.”
That is exactly what happened this past week. While we will likely get another reflexive rally in the next week or so, any advance will be one of your better opportunities to raise cash, and reduce overall equity risk, for the time being.

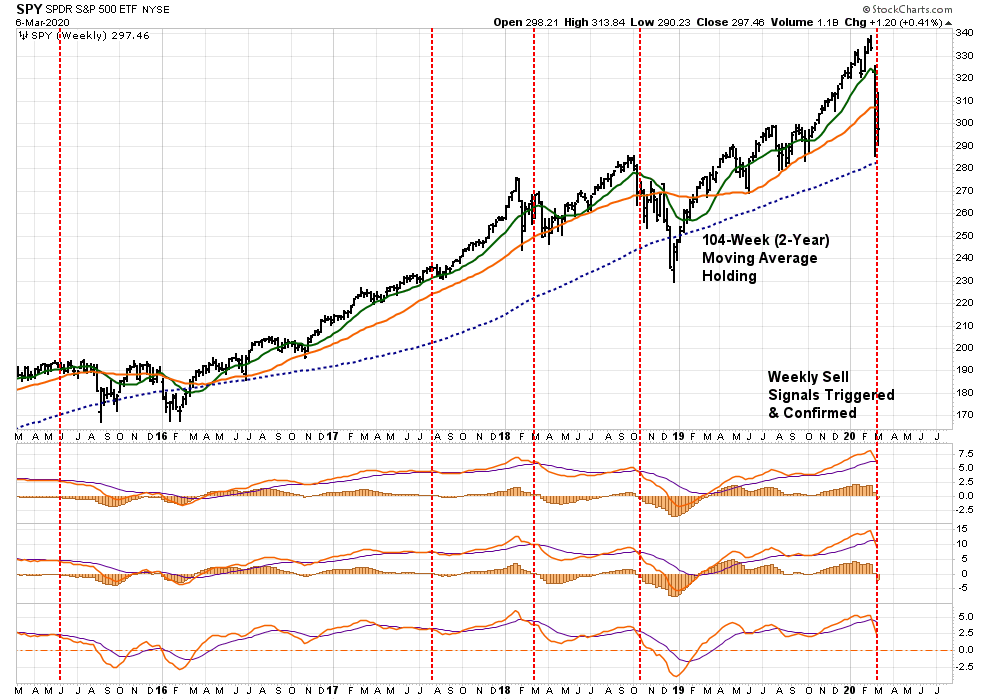
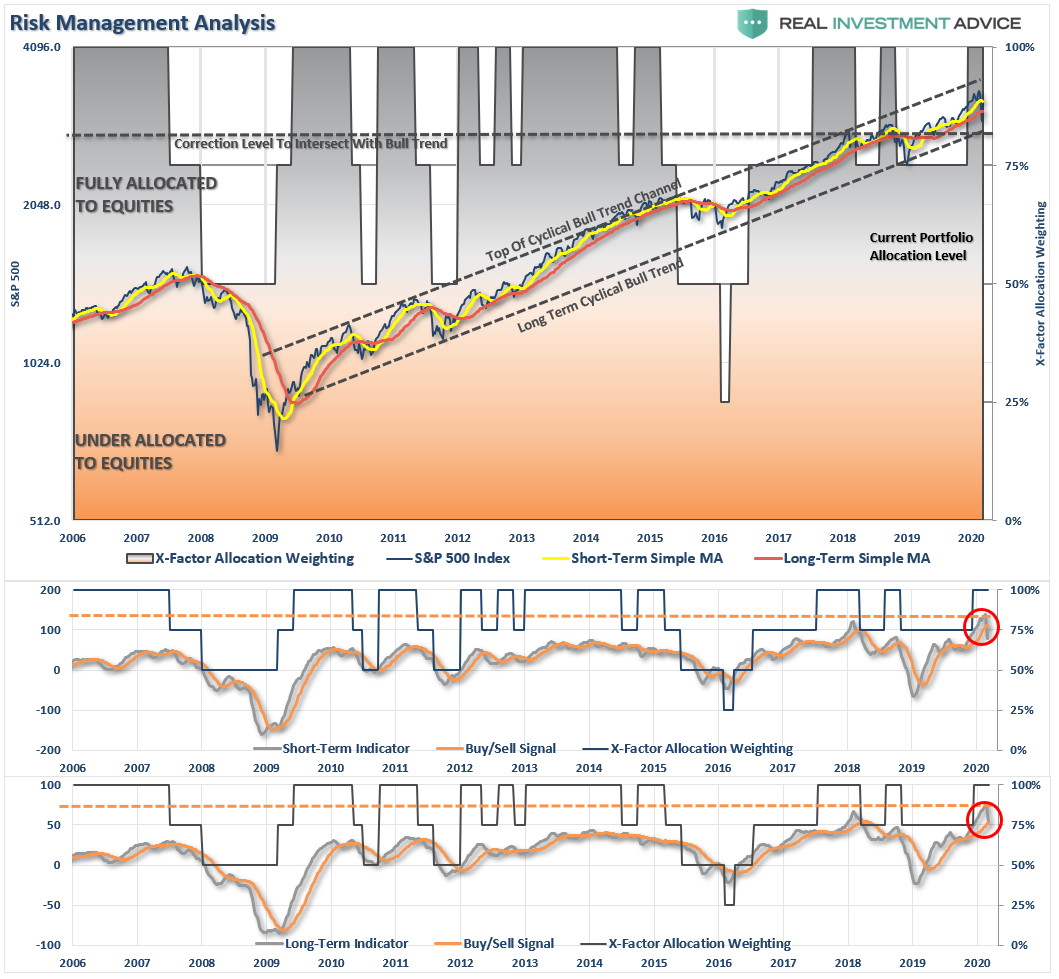
The “equity exposure” in our portfolio models is driven by a series of “weekly signals” which we use to control risk. Importantly, it requires a “confirmation” of the indicators to adjust risk exposure in portfolios accordingly.
On Friday, the markets confirmed that risk exposure in portfolios should be reduced lower for now. Fortunately, we have been reducing risk over the last 6-weeks, as noted above, but the signals have now confirmed our previous actions were correct. If the market breaks the 2-year moving average, we will need to substantially reduce risk further.
As I said above, I am reprinting our rules from last week to use on any rally into the “sell zone” over the next week.
These are the same rules we use to reduce the risk in our portfolio management process, with the exception of #7.
- Move slowly. There is no rush in making dramatic changes. Doing anything in a moment of “panic” tends to be the wrong thing.
- If you are over-weight equities, DO NOT try and fully adjust your portfolio to your target allocation in one move. Again, after big declines, individuals feel like they “must” do something. Think logically above where you want to be and use the rally to adjust to that level.
- Begin by selling laggards and losers. These positions were dragging on performance as the market rose and they led on the way down.
- Add to sectors, or positions, that are performing with, or outperforming the broader market if you need risk exposure.
- Move “stop-loss” levels up to recent lows for each position. Managing a portfolio without “stop-loss” levels is like driving with your eyes closed.
- Be prepared to sell into the rally and reduce overall portfolio risk. There are a lot of positions you are going to sell at a loss simply because you overpaid for them to begin with. Selling at a loss DOES NOT make you a loser. It just means you made a mistake. Sell it, and move on with managing your portfolio. Not every trade will always be a winner. But keeping a loser will make you a loser of both capital and opportunity.
- If none of this makes any sense to you – please consider hiring someone to manage your portfolio for you. It will be worth the additional expense over the long term.
In the short-term, there is no need to take on exceptional risk. It is time to take precautionary measures and tighten up stops, add non-correlated assets, raise cash levels, and hedge risk opportunistically on any rally.
As noted last week, this just our approach to controlling risk.
The only unacceptable method of managing risk at this juncture is not having a method to begin with.

The MacroView
If you need help or have questions, we are always glad to help. Just email me.
See You Next Week
By Lance Roberts, CIO
Financial Planning Corner

You’ll be hearing more about more specific strategies to diversify soon, but don’t hesitate to give me any suggestions or questions.
by Danny Ratliff, CFP®
Market & Sector Analysis
Data Analysis Of The Market & Sectors For Traders
S&P 500 Tear Sheet 
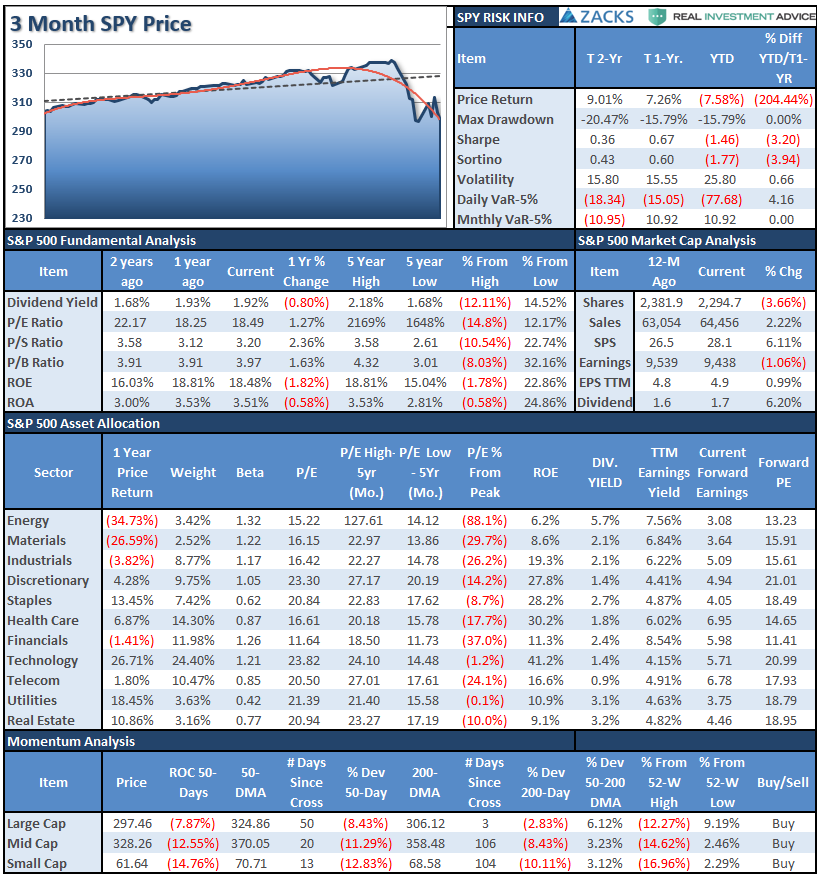
Performance Analysis
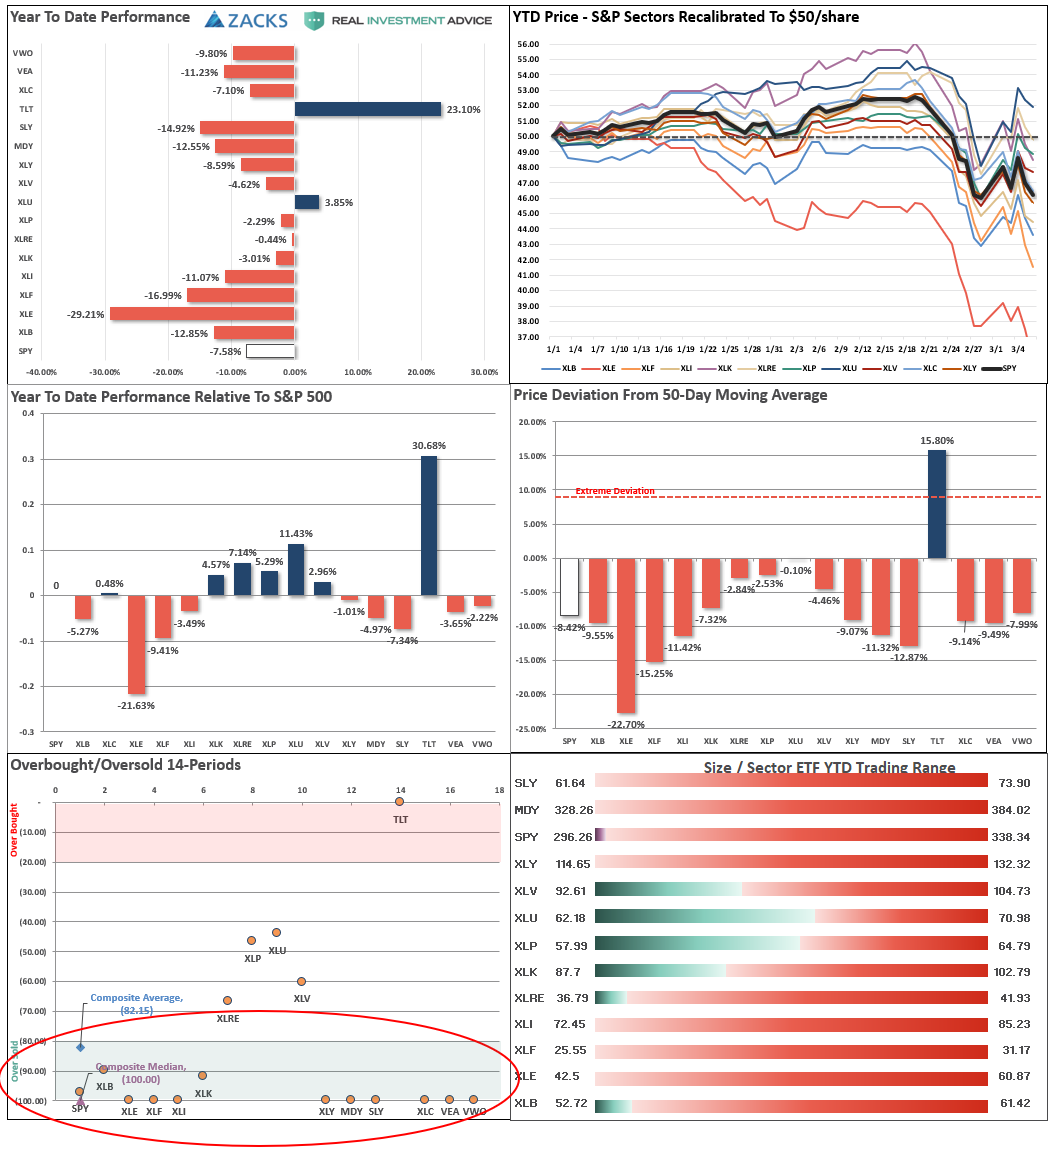
Technical Composite

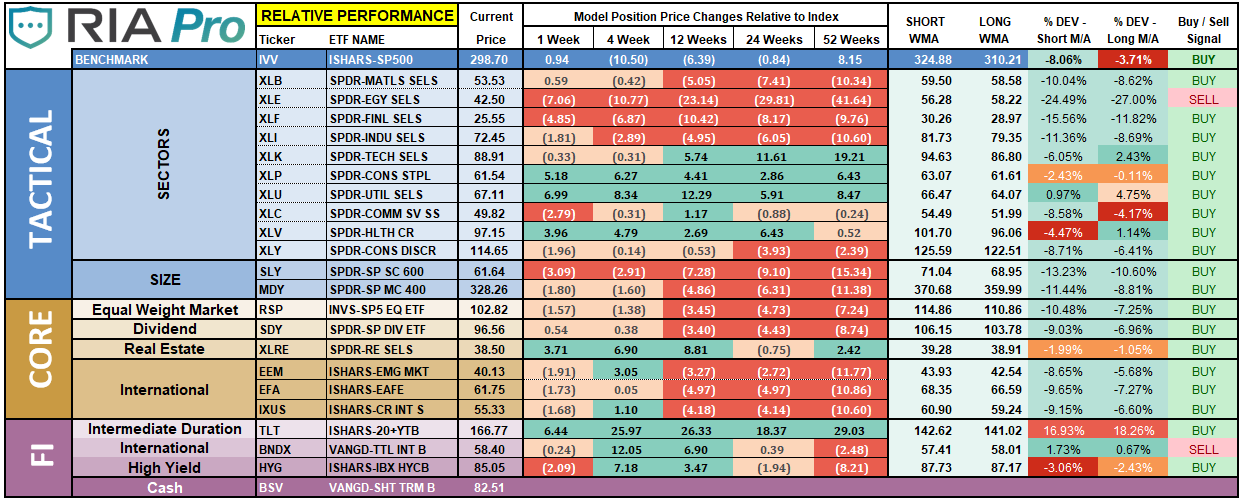
ETF Model Relative Performance Analysis
Sector & Market Analysis:
Be sure and catch our updates on Major Markets (Monday) and Major Sectors (Tuesday) with updated buy/stop/sell levels
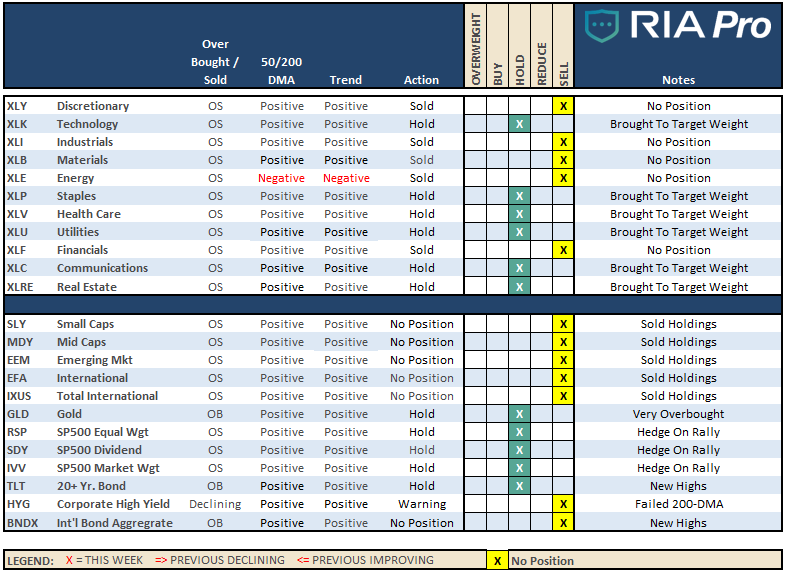
Sector-by-Sector
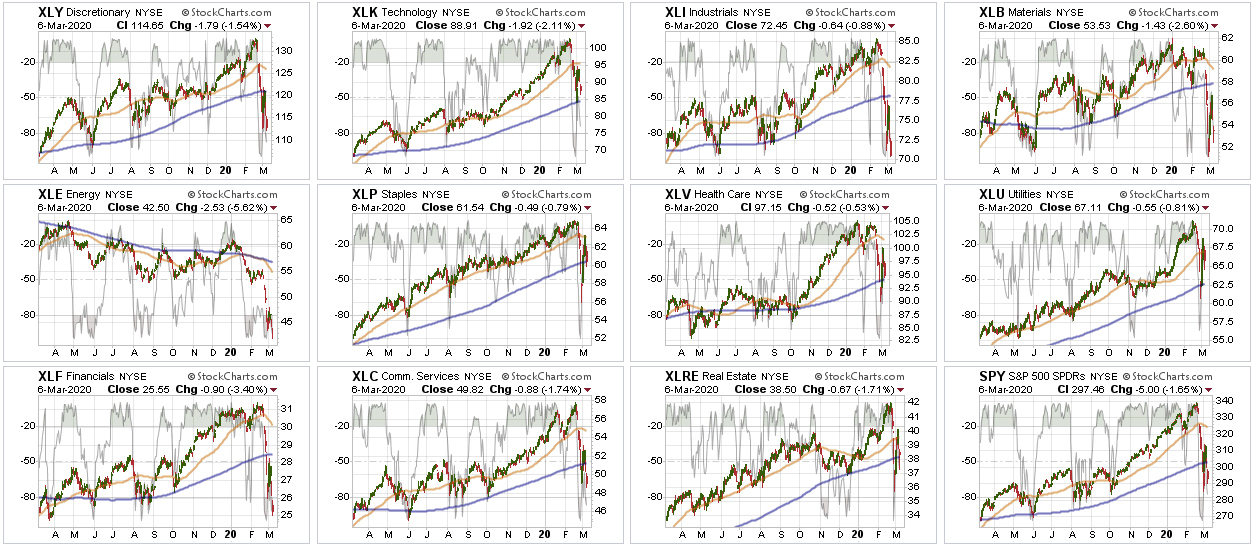
Everything was crushed again this past week, so the difference between leading and lagging sectors is which sector fell faster or slower than the S&P 500 index itself.
Improving – Discretionary (XLY), Real Estate (XLRE), and Staples (XLP)
Last week, we rebalanced our weightings in Real Estate and Staples, as these sectors are now improving in terms of relative performance. After getting very beaten up, we are looking not only for the “risk hedge” of non-virus related sectors but an eventual outperformance of the groups.
We sold our entire stake in Discretionary due to potential earnings impacts from a slowdown in consumption, to supply chain problems, and inventory issues.
Current Positions: Target Weight XLU, XLRE
Outperforming – Technology (XLK), Communications (XLC), and Utilities (XLU)
The correction this past week found support at the 200-dma and we used that opportunity to bring our weightings in all three sectors back to target weights for now. These have “anti-virus” properties, so we are looking for the “risk hedge” relative to the broader market.
Current Positions: Target weight XLK, XLC, XLU
Weakening – Healthcare (XLV)
We did bring our healthcare positioning back to portfolio weight as the sector will ultimately benefit from a “cure” for the “coronavirus.” Also, with Bernie Sanders now lagging Joe Biden on the Democratic ticket, this removes some of the risk of “nationalized healthcare” from the sector.
Current Position: Target weight (XLV)
Lagging – Industrials (XLI), Financials (XLF), Materials (XLB), and Energy (XLE)
We had started to buy a little energy exposure previously, but closed out of the positions as we were stopped out of our holdings for now. We are going to continue to monitor the space due to its extreme oversold condition and relative value, and will re-enter our positions when stability starts to take hold.
We also sold Financials due to the financial risk from a recessionary impact on the outstanding corporate debt which currently exists. The Fed’s rate cut also impacts the banks Net Interest Margins which makes them less attractive.
Current Position: None
Market By Market
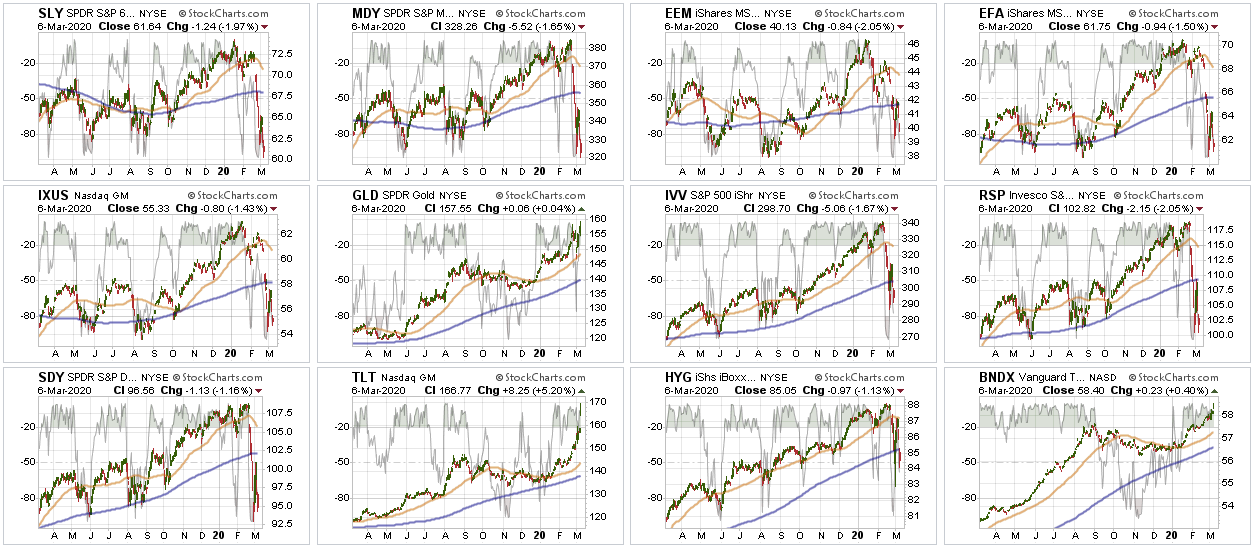
Small-Cap (SLY) and Mid Cap (MDY) – Early last week we sold all small-cap and mid-cap exposure over concerns of the impact of the coronavirus. Remain out of these sectors for now.
Current Position: None
Emerging, International (EEM) & Total International Markets (EFA)
Same as small-cap and mid-cap. Given the spread of the virus and the impact on the global supply chain.
Current Position: None
Dividends (VYM), Market (IVV), and Equal Weight (RSP) – These positions are our long-term “core” positions for the portfolio given that over the long-term markets do rise with economic growth and inflation. We are currently maintaining our core positions unhedged for now. However, on a rally back to short-term resistance we will add hedges to the core.
Current Position: RSP, VYM, IVV, VOOG
Gold (GLD) – This past week, Gold continued its surge higher as stocks plunged lower. Gold is extremely overbought, so be patient for now and move stops up to the recent breakout levels. We sold our GDX position due to the fact mining is people-intensive and is located in countries most susceptible to the virus.
Current Position: IAU (GOLD)
Bonds (TLT) –
Bonds also broke out to new highs as the correction ensued. On Friday, we took profits in our 20-year bond position (TLT) to reduce our duration slightly, raise cash, and take in some profits. Bonds are extremely overbought now, so be cautious, we are maintaining the rest of our exposures for now but will look to hedge if we begin to see a reversal in rates.
Current Positions: DBLTX, SHY, IEF, PTIAX
Sector / Market Recommendations
The table below shows thoughts on specific actions related to the current market environment.
(These are not recommendations or solicitations to take any action. This is for informational purposes only related to market extremes and contrarian positioning within portfolios. Use at your own risk and peril.)
Portfolio/Client Update:
It’s been a brutal couple of weeks.
This is when portfolio management gets extremely difficult. It is when we have the biggest urge to give in to our emotions. It is when Mike and I lose the most sleep.
Staying true to our discipline and strategy is difficult in times like these. We question everything, every day. Are we in the right place? Do we have too much risk? Are we missing something?
The ghosts of 2000, and 2008, stalk us both, and we are overly protective of YOUR money. We do not take our jobs lightly.
Again this past week, we made some additional changes to the portfolio composition to reduce risk away from the “COVID-19” virus. This rebalancing of risk lowered overall equity exposure, and continued to shift away from risk.
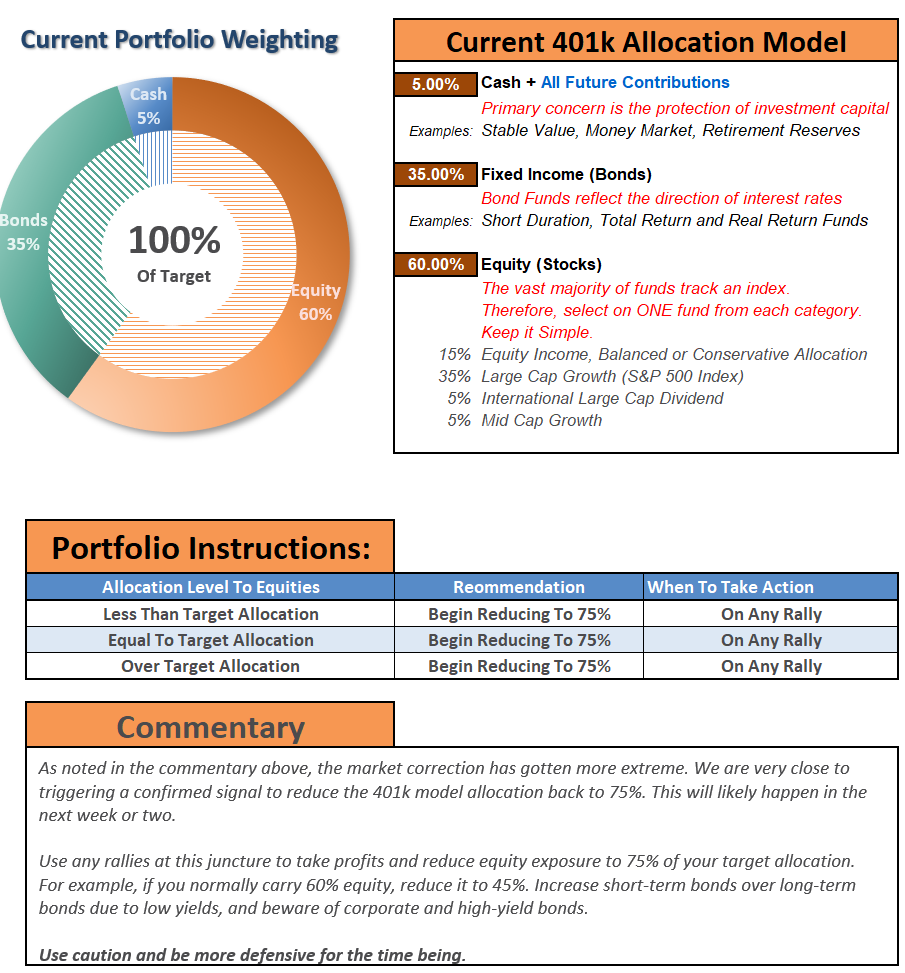
As noted last week, we use WEEKLY signals in order to manage equity exposures and make portfolio adjustments. Therefore, signals are ONLY VALID after the close of business on Friday. Yesterday, we now have a CONFIRMED sell signal to reduce portfolio exposures to 75% of our target allocations.
Fortunately, we are already there, and the hedges in our portfolios, along with bonds, are doing their jobs. We took some further actions to increase cash, and take some profits, and sell some of our laggards.
Be assured we are watching your portfolios very closely. However, if you have ANY questions, comments, or concerns, please don’t hesitate to email me.
Portfolio Actions Taken Last Week
- New clients: Only adding new positions as needed.
- Dynamic Model: Sold all energy holdings RDS/A, AMLP.
- Equity Model: Sold all energy holdings RDS/A, AMLP, and XOM. We were too early on the trade and got stopped out. We will watch for a bottom to re-enter the positions. Sold DOV, VMC, JPM to reduce exposure to Fed rate cuts and virus areas.
- ETF Model: Sold XLB, XLI, AMLP, and XLF
Note for new clients:
It is important to understand that when we add to our equity allocations, ALL purchases are initially “trades” that can, and will, be closed out quickly if they fail to work as anticipated. This is why we “step” into positions initially. Once a “trade” begins to work as anticipated, it is then brought to the appropriate portfolio weight and becomes a long-term investment. We will unwind these actions either by reducing, selling, or hedging if the market environment changes for the worse.
THE REAL 401k PLAN MANAGER
A Conservative Strategy For Long-Term Investors
The 401k plan allocation plan below follows the K.I.S.S. principle. By keeping the allocation simplified, it allows for better control of the allocation, and closer tracking to the benchmark objective over time. (If you want to make it more complicated, you can, however, statistics show simply adding more funds does not increase performance to any significant degree.)
If you need help after reading the alert; do not hesitate to contact me.
Click Here For The “LIVE” Version Of The 401k Plan Manager
See below for an example of a comparative model.
Model performance is based on a two-asset model of stocks and bonds relative to the weighting changes made each week in the newsletter. This is strictly for informational and educational purposes only and should not be relied upon for any reason. Past performance is not a guarantee of future results. Use at your own risk and peril.

 401k Plan Manager Live Model
As an RIA PRO subscriber (You get your first 30-days free) you have access to our live 401k p
The code will give you access to the entire site during the 401k-BETA testing process, so not only will you get to help us work out the bugs on the 401k plan manager, you can submit your comments about the rest of the site as well.
We are building models specific to company plans. So, if you would like to see your company plan included specifically, send me the following:
- Name of the company
- Plan Sponsor
- A print out of your plan choices. (Fund Symbol and Fund Name)
If you would like to offer our service to your employees at a deeply discounted corporate rate, please contact me.


