Last week, we discussed in Fed’s ‘Emergency Rate Cut’ Reveals Recession Risks” that while current economic data may not suggest a possibility of a recession was imminent, other “off the run” data didn’t agree.
“We are likely experiencing more than just a ‘soft patch’ currently despite the mainstream analysts’ rhetoric to the contrary. There is clearly something amiss within the economic landscape, even before the impact of COVID-19, and the ongoing decline of inflationary pressures longer term was already telling us just that.”
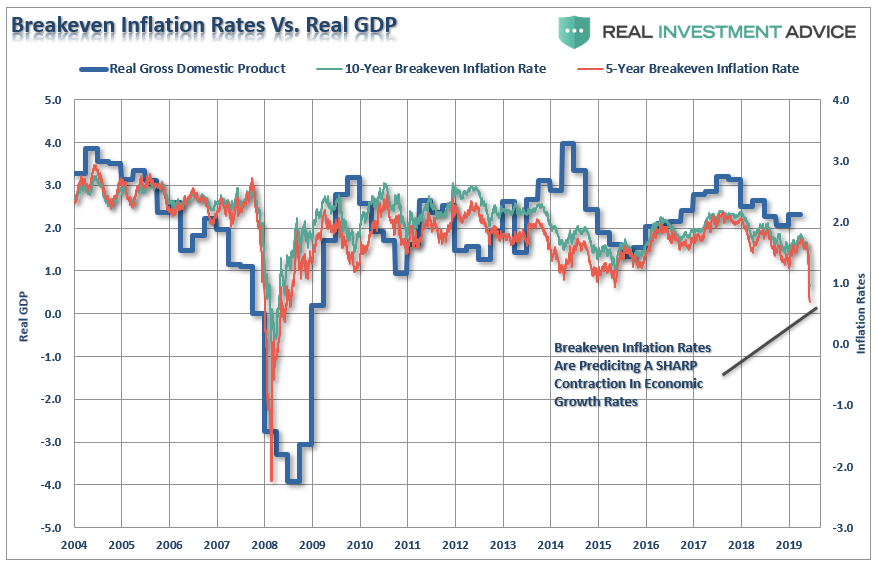
The plunge in both 5- and 10-year “breakeven inflation rates,” are currently suggesting that economic growth over the next couple of quarters will drop markedly. The last time there was such a sharp drop in inflation expectations at the beginning of the “financial crisis.”
In the meantime, the markets have been rocked as concerns over the spread of the“COVID-19” virus in the U.S. have shut down sporting events, travel, consumer activities, and a host of other economically sensitive inputs. As we discussed previously:
“Given that U.S. exporters have already been under pressure from the impact of the ‘trade war,’ the current outbreak could lead to further deterioration of exports to and from China, South Korea, and Japan. This is not inconsequential as exports make up about 40% of corporate profits in the U.S. With economic growth already struggling to maintain 2% growth currently, the virus could shave between 1-1.5% off that number.”
As noted, with the U.S. now shutting down and entrenching itself in response to the virus, the economic impact will be worsened. However, given that economic data is lagging, and we only have numbers that were mostly pre-virus, the reports over the next couple of months will ultimately reveal the extent of the damage.
We suspect that it will be more significant than most analysts currently expect.

With our Economic Output Composite Indicator (EOCI) at levels which have previously warned of recessions, the “timing” of the virus, and the shutdown of activity in response, will push the indications lower.
“Given the current level of the index as compared to the 6-Month rate of change of the Leading Economic Index, there is a risk of a recessionary drag within the next 6-months.”
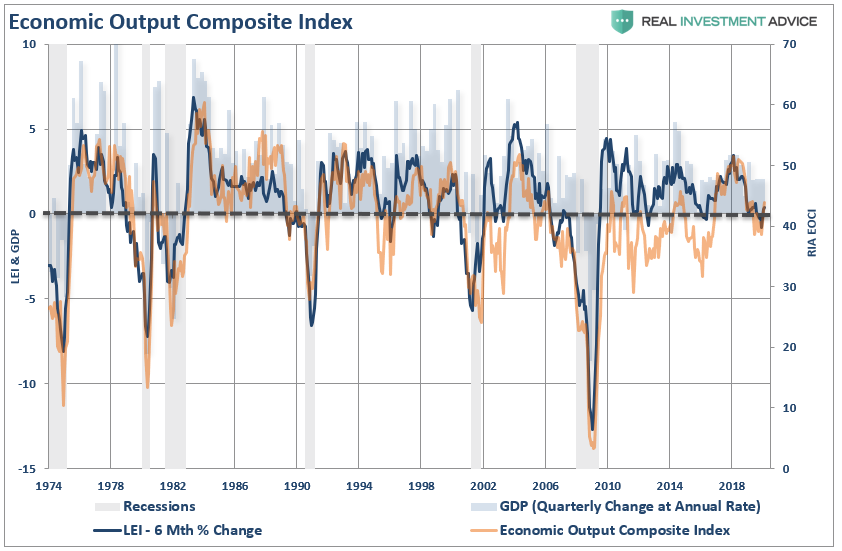
(The EOCI is comprised of the Fed Regional Surveys, CFNAI, Chicago PMI, NFIB, LEI, and ISM Composites. The indicator is a broad measure of hard and soft data of the U.S. economy)”
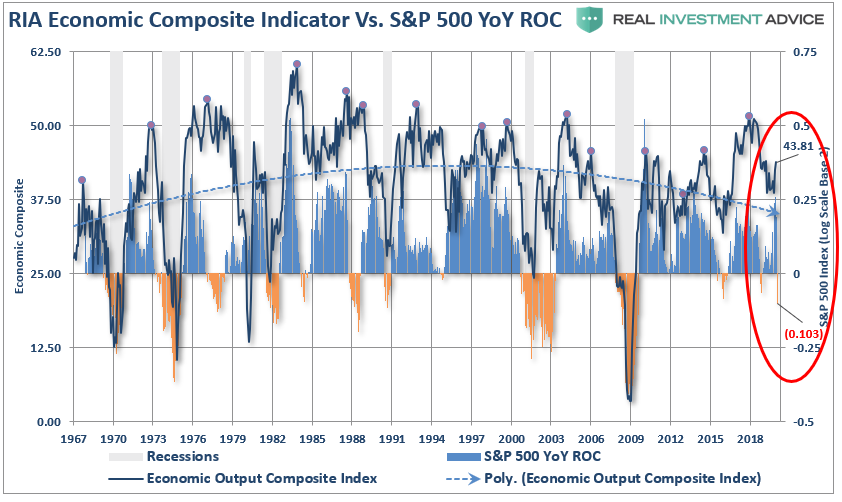
One reason we are confident the economic data will worsen near term is the correlation between the index and the annual rate of change of the S&P 500 index.
The financial markets lead the economy by about 6-months as markets begin to “price in” changes to earnings due to the outlook for economic strength. The recent plunge in the S&P 500 has deviated from the current EOCI index reading suggesting the index will decline towards recessionary levels over the next few months.
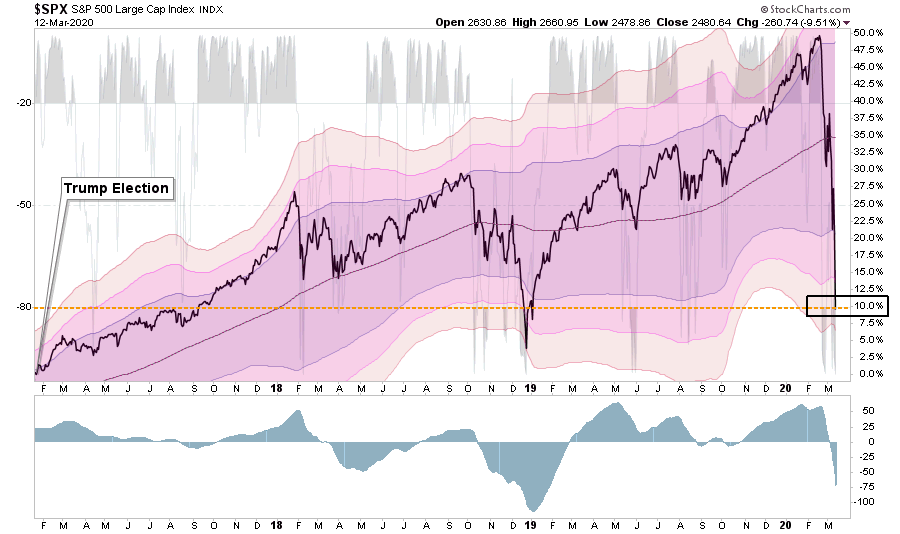
What the chart above obfuscates is the severity of the recent market rout. As shown below, in just three very short weeks, the market has reversed almost the entirety of the “Trump Stock Market” gains since he took office on January 20th.
The estimation of substantially weaker economic growth is not just a random assumption. In a post next week, I am going through the math of our analysis. Here is a snippet.
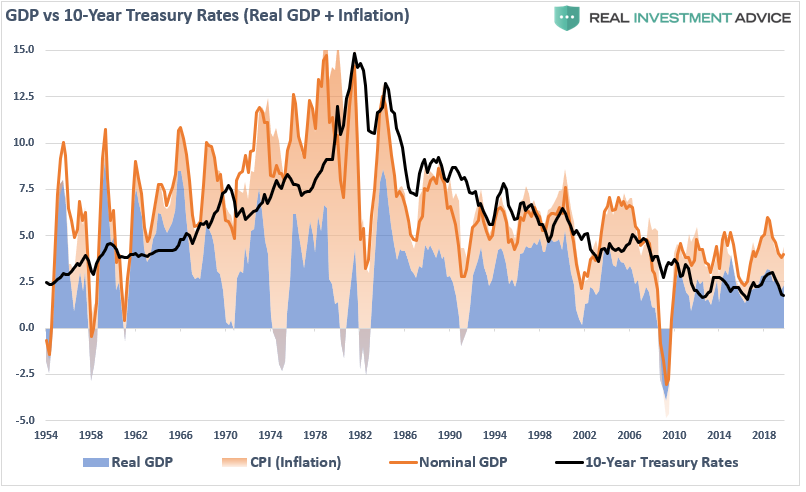
“Over the last sixty years, the yield on the 10-year has approximated real GDP plus inflation (shown in the chart below). Given this historical fact, we can do some basic math to determine what yields are currently predicting for the U.S. economy currently.”
Doug Kass recently did the math:
“Given ZIRP and QE policies around the globe which has pulled an extraordinary amount of sovereign debt into negative territory coupled with secular headwinds to energy prices, I have assumed that the 10 year yield will fall from 1.0x nominal GDP and average about 0.8x nominal GDP.
According to my pal Peter Boockvar, the 10-year inflation breakeven (in the tips market) stands at 1.41% this morning:
So, let’s solve for what the market expects Real GDP to be (over the next 1-2 years) with this formula:
10-Year Yield (0.744% Actual) = 0.8x (Real GDP + 1.41% Actual (inflation))
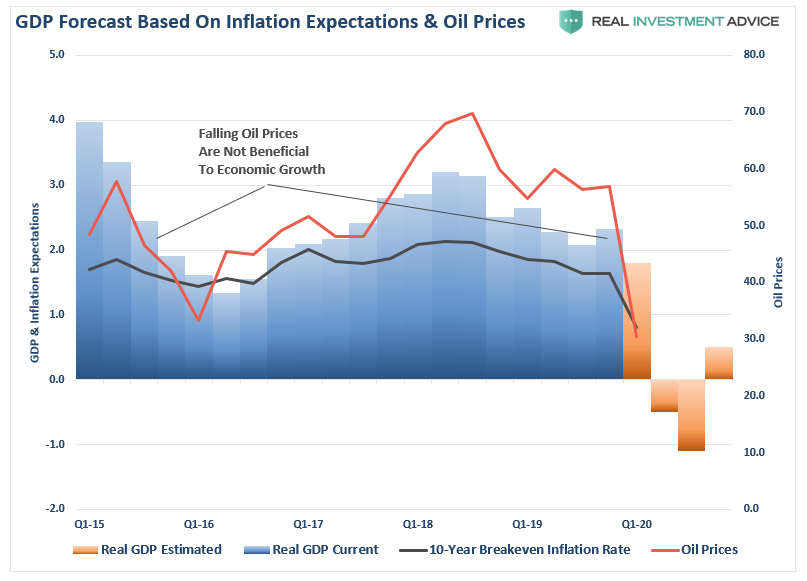
The implied U.S. Real GDP of this equation is now negative — at -0.48%. (This compares to the consensus 2020 Real GDP growth forecast of between +1.75% to +2.00%) It also implies that nominal GDP (Real GDP plus Inflation) will be only about +0.93% – substantially below consensus expectations of slightly above 3%.”
Doug’s estimates were before to the recent collapse in oil prices, and breakeven inflation rates. With oil prices now at $30/bbl and 10-year breakeven rates to 0.9%, the math is significantly worse, and that is what the severity of the recent selloff is telling us. Over the next two quarters, we could see as much as a 3% clip off of current GDP.
This data is not lost on the Federal Reserve and is why they have been taking action over the last two weeks.

The Fed Bazooka
It’s quite amazing that in mid-February, which now seems like a lifetime ago, we were discussing the markets being 3-standard deviations above their 200-dma, which is a rarity. Three short weeks later, the markets are now 4-standard deviations below, which is even a rarer event.
That swing in asset prices has cut the “wealth effect” from the market, and will severely impact consumer confidence over the next few months. The decline in confidence, combined with the impact of the loss of activity from the virus, will sharply reduce consumption, which is 70% of the economy.
This is why the Fed cut rates in an “emergency action” by 0.50% previously. Then on Wednesday, increased “Repo operations” to $175 Billion.
However, like hitting a patient with a defibrillator, the was no response from the market.
Then yesterday, the Fed brought out their “big gun.” In a statement from the New York Fed:
The Federal Reserve said it would inject more than $1.5 trillion of temporary liquidity into Wall Street on Thursday and Friday to prevent ominous trading conditions from creating a sharper economic contraction.
‘These changes are being made to address highly unusual disruptions in Treasury financing markets associated with the coronavirus outbreak.’
The New York Fed said it would conduct three additional repo offerings worth an additional $1.5 trillion this week, with two separate $500 billion offerings that will last for three months and a third that will mature in one month.
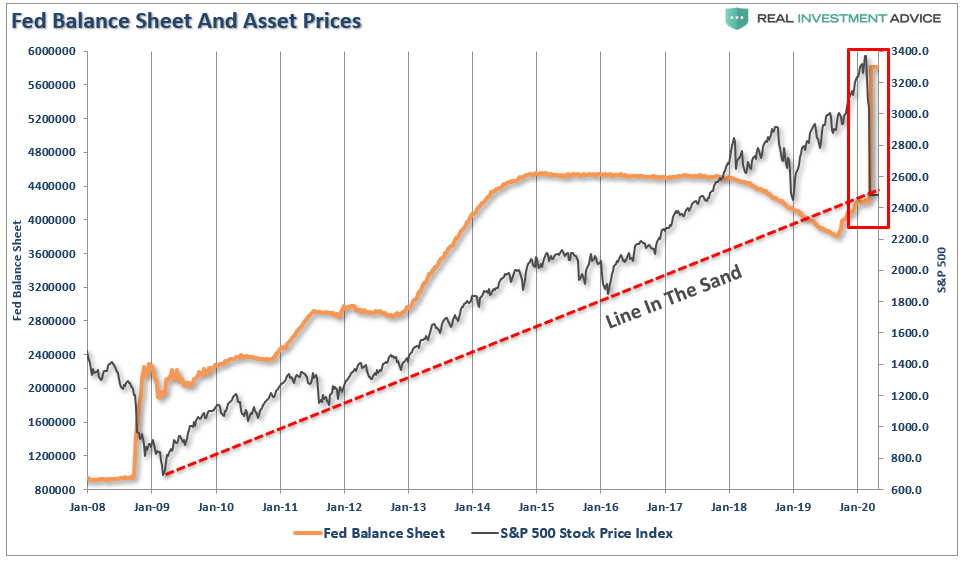
If the transactions are fully subscribed, they would swell the central bank’s $4.2 trillion asset portfolio by more than 35%.” – WSJ
“The Fed can label this however they want, but it’s another round of QE.”
As you can see in the chart below, this is a massive surge of liquidity hitting the market at a time the market is sitting on critical long-term trend support.
Of course, this is what the market has been hoping for:
- Rate cuts? Check
- Liquidity? Check
For about 15-minutes yesterday, stocks responded by surging higher and reversing half of the day’s losses. Unfortunately, the enthusiasm was short-lived as sellers quickly returned to continue their “panic selling.”
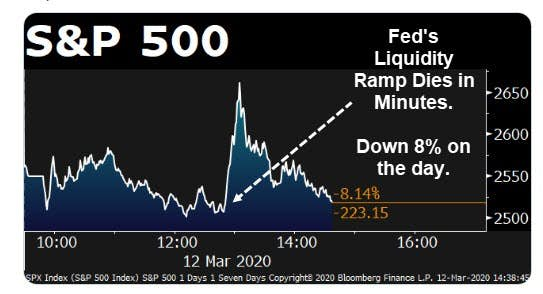
This has been frustrating for investors and portfolio managers, as the ingrained belief over the last decade has been “Don’t worry, the Fed’s got this.”
All of a sudden, it looks like they don’t.

Will It Work This Time?
There is a singular risk that we have worried about for quite some time.
Margin debt.
Here is a snip from an article I wrote in December 2018.
“Margin debt is the ‘gasoline,’ which drives markets higher as the leverage provides for the additional purchasing power of assets. However, that ‘leverage’ also works in reverse as it provides the accelerant for larger declines as lenders ‘force’ the sale of assets to cover credit lines without regard to the borrower’s position.
That last sentence is the most important. The issue with margin debt, in particular, is that the unwinding of leverage is NOT at the investor’s discretion. It is at the discretion of the broker-dealers that extended that leverage in the first place. (In other words, if you don’t sell to cover, the broker-dealer will do it for you.) When lenders fear they may not be able to recoup their credit-lines, they force the borrower to either put in more cash or sell assets to cover the debt. The problem is that “margin calls” generally happen all at once as falling asset prices impact all lenders simultaneously.
Margin debt is NOT an issue – until it is.”
Given the magnitude of the declines in recent days, and the lack of response to the Federal Reserve’s inputs, it certainly has the feel of a margin debt liquidation process. This was also an observation made by David Rosenberg:
“The fact that Treasuries, munis, and gold are getting hit tells me that everything is for sale right now. One giant margin call where even the safe-havens aren’t safe anymore. Except for cash.”
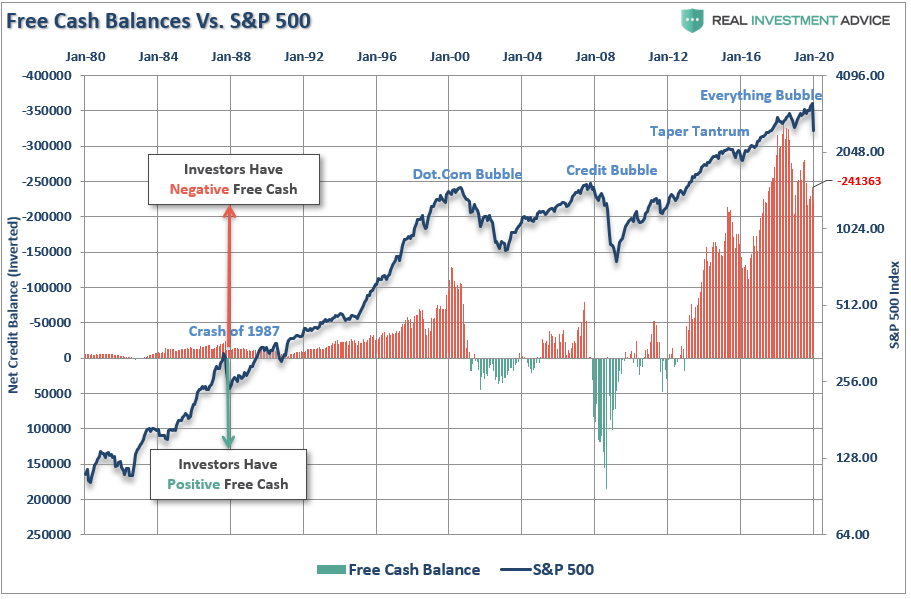
Unfortunately, FINRA only updates margin debt in arrears, so as of this writing, the latest margin debt stats are for January. What we do know is that due to the market decline, negative free cash balances have likely declined markedly. That’s the good news.
Back to my previous discussion for a moment:
“When an event eventually occurs, it creates a rush to liquidate holdings. The subsequent decline in prices eventually reaches a point which triggers an initial round of margin calls. Since margin debt is a function of the value of the underlying ‘collateral,’ the forced sale of assets will reduce the value of the collateral, further triggering further margin calls. Those margin calls will trigger more selling forcing, more margin calls, so forth and so on.
Given the lack of ‘fear’ shown by investors during the recent decline, it is unlikely that the recent drop in margin debt is a function of ‘forced liquidations.’ As I noted above, it will likely take a correction of more than 20%, or a ‘credit related’ event, which sparks broker-dealer concerns about repayment of their credit lines.
The risk to the market is ‘when’ those ‘margin calls’ are made.
It is not the rising level of debt that is the problem; it is the decline which marks peaks in both market and economic expansions.”
That is precisely what we have seen over the last three weeks.

While the Federal Reserve’s influx of liquidity may stem the tide temporarily, it is likely not a “cure” for what ails the market.
However, with that said, the Federal Reserve, and Central Banks globally, are not going to quietly into the night. Expect more stimulus, more liquidity, and more rate cuts. If that doesn’t work, expect more until it does.
We have already reduced a lot of equity risk in portfolios so far, but are going to continue lifting exposures and reducing risk until a bottom is formed in the market. The biggest concern is trying to figure out exactly where that is.
One thing is now certain.
We are in a bear market and a recession. It just hasn’t been announced as of yet.
That is something the Fed can’t fix right away with monetary policy alone, and, unfortunately, there won’t be any help coming from the Government until after the election.

