Normally, “Technically Speaking,” is analysis based on Monday’s market action. However, this week, we are UPDATING the analysis posted in this past weekend’s newsletter, “Market Crash & Navigating What Happens Next.”
Specifically, we broke down the market into three specific time frames looking at the short, intermediate, and long-term technical backdrop of the markets. In that analysis, we laid out the premise for a “reflexive bounce” in the markets, and what to do during the process of that move. To wit:
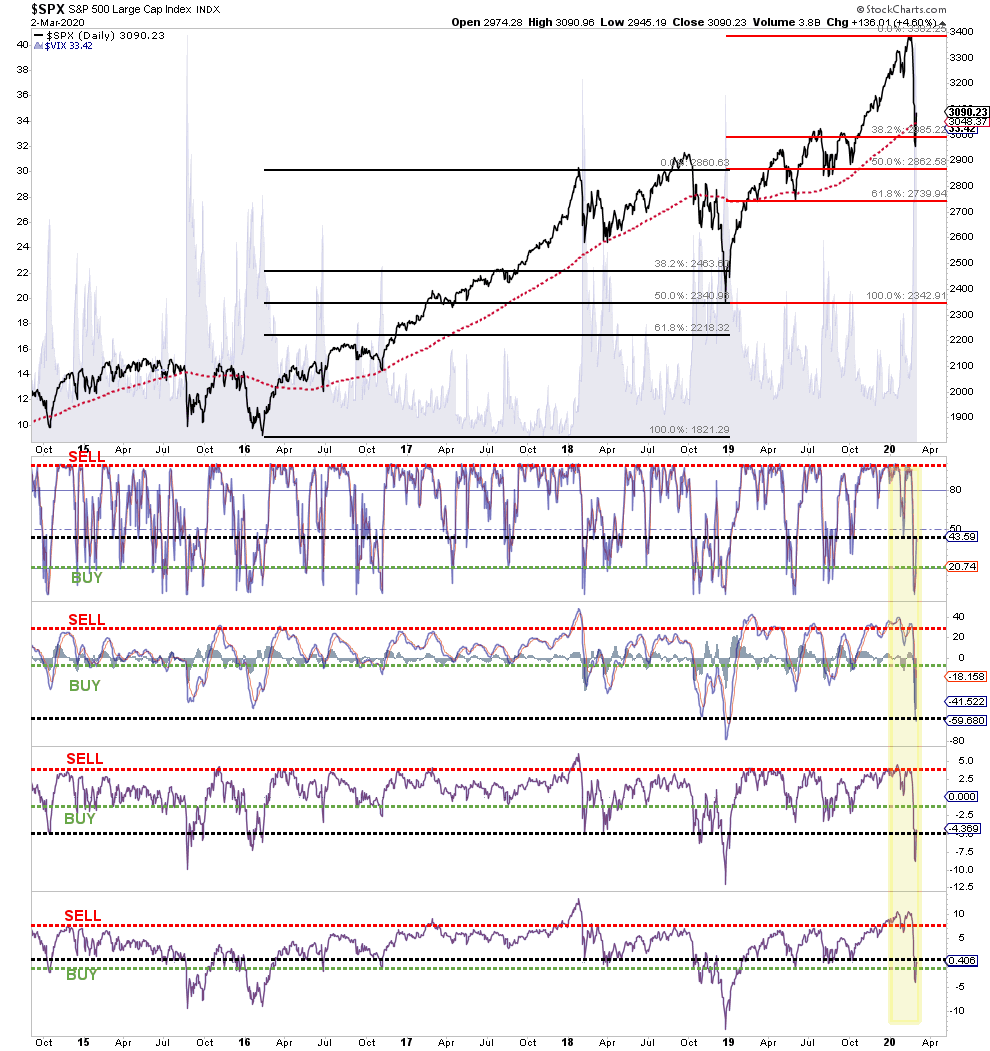
“On a daily basis, the market is back to a level of oversold (top panel) rarely seen from a historical perspective. Furthermore, the rapid decline this week took the markets 5-standard deviations below the 50-dma.”
Chart updated through Monday
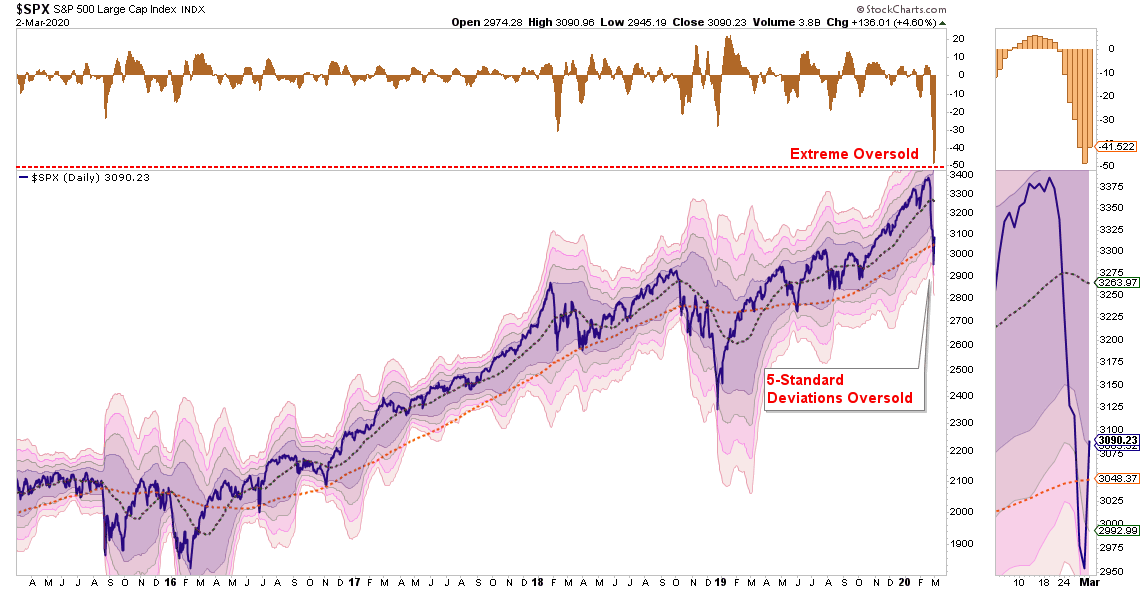
“To put this into some perspective, prices tend to exist within a 2-standard deviation range above and below the 50-dma. The top or bottom of that range constitutes 95.45% of ALL POSSIBLE price movements within a given period.
A 5-standard deviation event equates to 99.9999% of all potential price movement in a given direction.
This is the equivalent of taking a rubber band and stretching it to its absolute maximum.”
Importantly, like a rubber band, this suggests the market “snap back” could be fairly substantial, and should be used to reduce equity risk, raise cash, and add hedges.”

Importantly, read that last sentence again.
The current belief is that the “virus” is limited in scope and once the spread is contained, the markets will immediately bounce back in a “V-shaped” recovery. Much of this analysis is based on assumptions that “COVID-19” is like “SARS” in 2003 which had a very limited impact on the markets.
However, this is likely a mistake as there is one very important difference between COVID-19 and SARS, as I noted previously:
“Currently, the more prominent comparison is how the market performed following the ‘SARS’ outbreak in 2003, as it also was a member of the ‘corona virus’ family. Clearly, if you just remained invested, there was a quick recovery from the market impact, and the bull market resumed. At least it seems that way.”
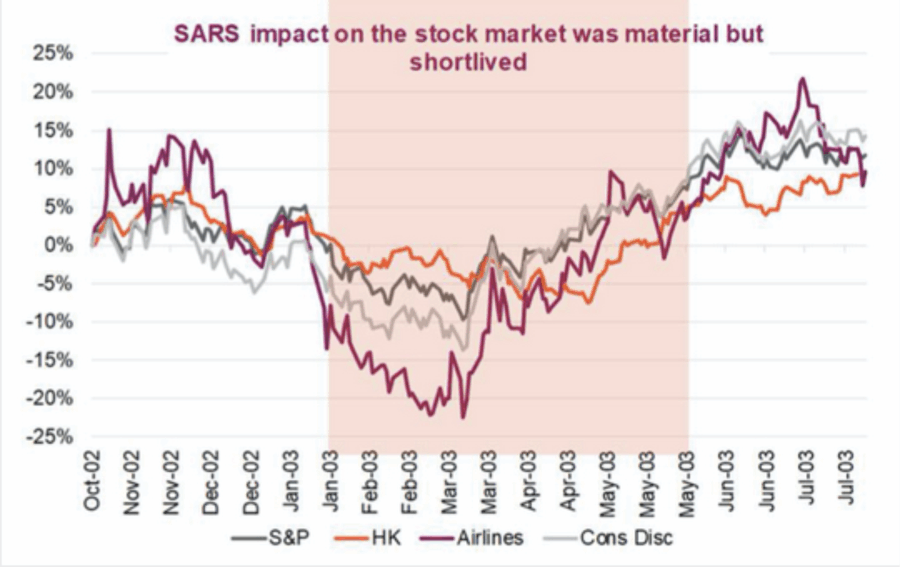
“While the chart is not intentionally deceiving, it hides a very important fact about the market decline and the potential impact of the SARS virus. Let’s expand the time frame of the chart to get a better understanding.”

“Following a nearly 50% decline in asset prices, a mean-reversion in valuations, and an economic recession ending, the impact of the SARS virus was negligible given the bulk of the ‘risk’ was already removed from asset prices and economic growth. Today’s economic environment could not be more opposed.”
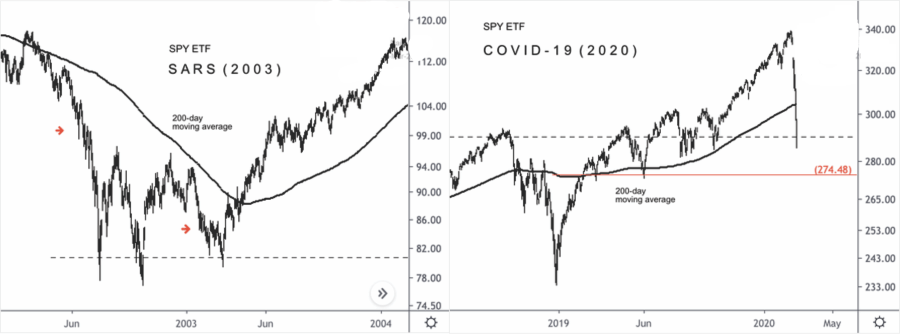
This was also a point noted by the WSJ on Monday:
“Unlike today, the S&P 500 ETF (SPY) spent about a year below its 200-day moving average (dot-com crash) prior to the SARS 2003 outbreak. Price action is much different now. SPY was well above its 200-day moving average before the coronavirus outbreak, leaving plenty of room for profit-taking.”
Importantly, the concern we have in the intermediate-term is not “people getting sick.” We currently have the “flu” in the U.S. which, according to the CDC, has affected 32-45 MILLION people which has already resulted in 18-46,000 deaths.
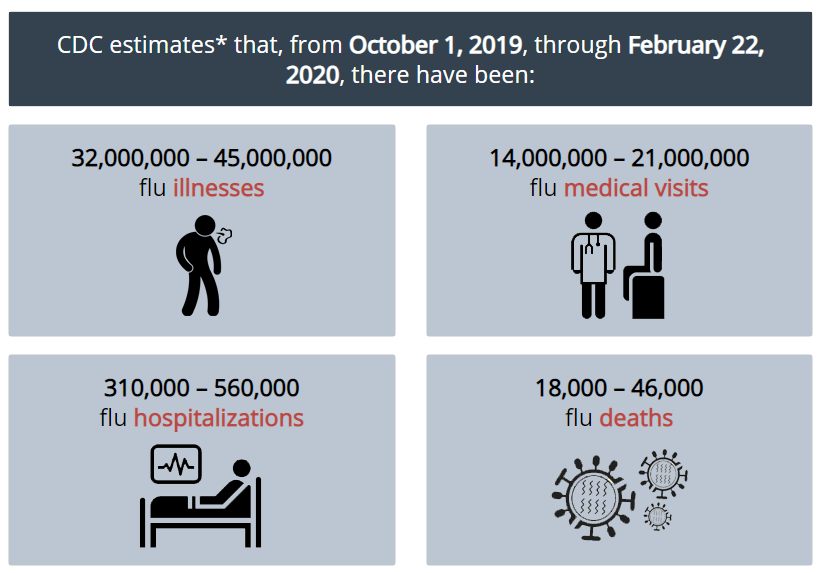
Clearly, the “flu” is a much bigger problem than COVID-19 in terms of the number of people getting sick. The difference, however, is that during “flu season,” we don’t shut down airports, shipping, manufacturing, schools, etc. The negative impact to exports and imports, business investment, and potentially consumer spending, which are all direct inputs into the GDP calculation, is going to be reflected in corporate earnings and profits.
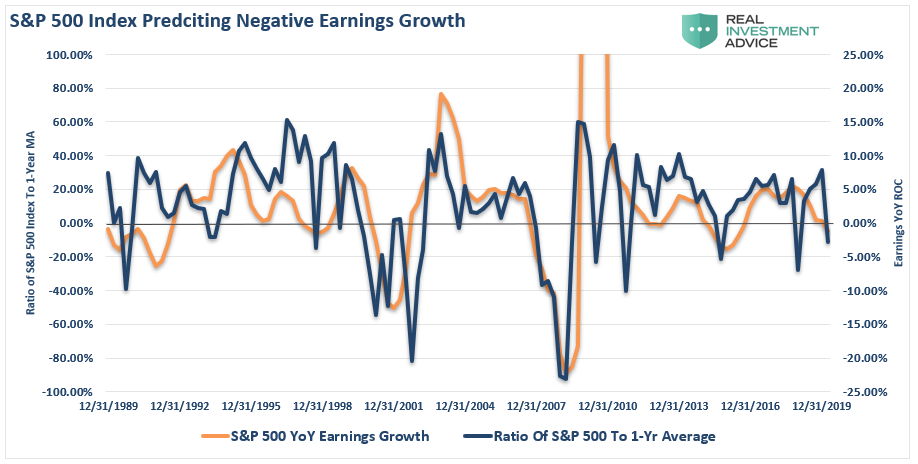
The recent slide, not withstanding the “reflexive bounce” on Monday, was beginning the process of pricing in negative earnings growth through the end of 2020.
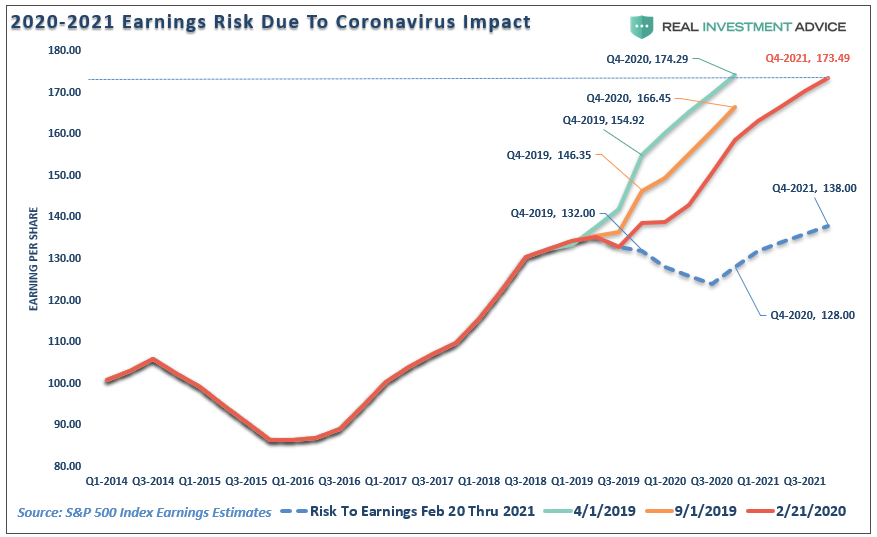
More importantly, the earnings estimates have not be ratcheted down yet to account for the impact of the “shutdown” to the global supply chain. Once we adjust (dotted blue line) for the a negative earnings environment in 2020, with a recovery in 2021, you can see just how far estimates will slide over the coming months. This will put downward pressure on stocks over the course of this year.
Given this backdrop of weaker earnings, which will be derived from weaker economic growth, in the months to come is why we suspect we could well see this year play out much like 2015-2016. In 2015, the Fed was beginning to discuss tapering their balance sheet which initially led to a decline. Given there was still plenty of liquidity, the market rallied back before “Brexit” risk entered the picture. The market plunged on expectations for a negative economic impact, but sprung back after Janet Yellen coordinated with the BOE, and ECB, to launch QE in the Eurozone.
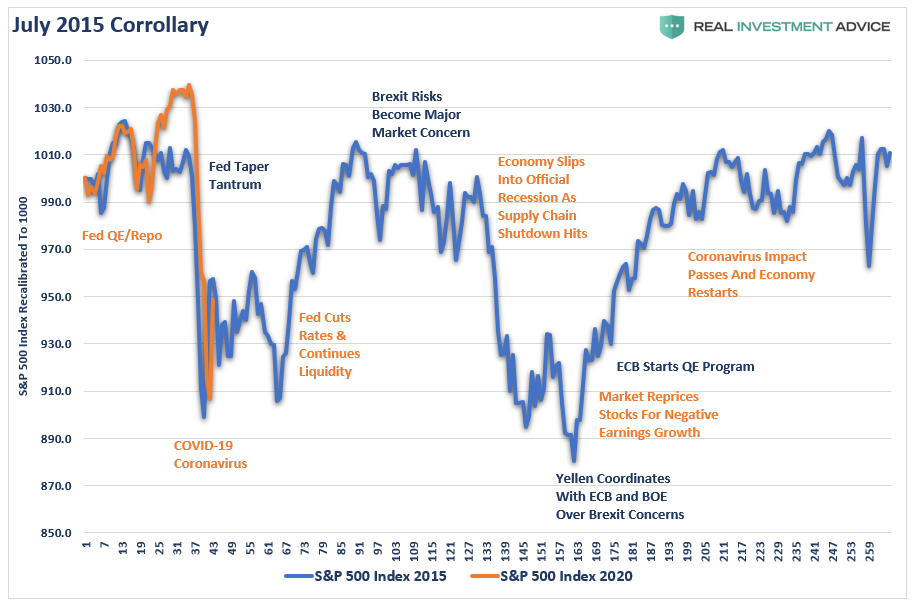
Using that model for a reflexive rally, we will likely see a failed rally, and a retest of last weeks lows, or potentially even set new lows, as economic and earnings risks are factored in.

Rally To Sell
As expected, the market rallied hard on Monday on hopes the Federal Reserve, and Central Banks globally, will intervene with a “shot of liquidity” to cure the market’s “COVID-19” infection.
The good news is the rally yesterday did clear initial resistance at the 200-dma which keeps that important break of support from being confirmed. This clears the way for the market to rally back into the initial “sell zone” we laid out this past weekend.

Importantly, while the volume of the rally on Monday was not as large as Friday’s sell-off, it was a very strong day nonetheless and confirmed the conviction of buyers. With the markets clearing the 200-dma, and still oversold on multiple levels, there is a high probability the market will rally into our “sell zone” before failing.
For now look for rallies to be “sold.”

The End Of The Bull
I want to reprint the last part of this weekend’s newsletter as the any rally that occurs over the next couple of weeks will NOT reverse the current market dynamics.
“The most important WARNING is the negative divergence in relative strength (top panel). This negative divergence was seen at every important market correction event over the last 25-years.”
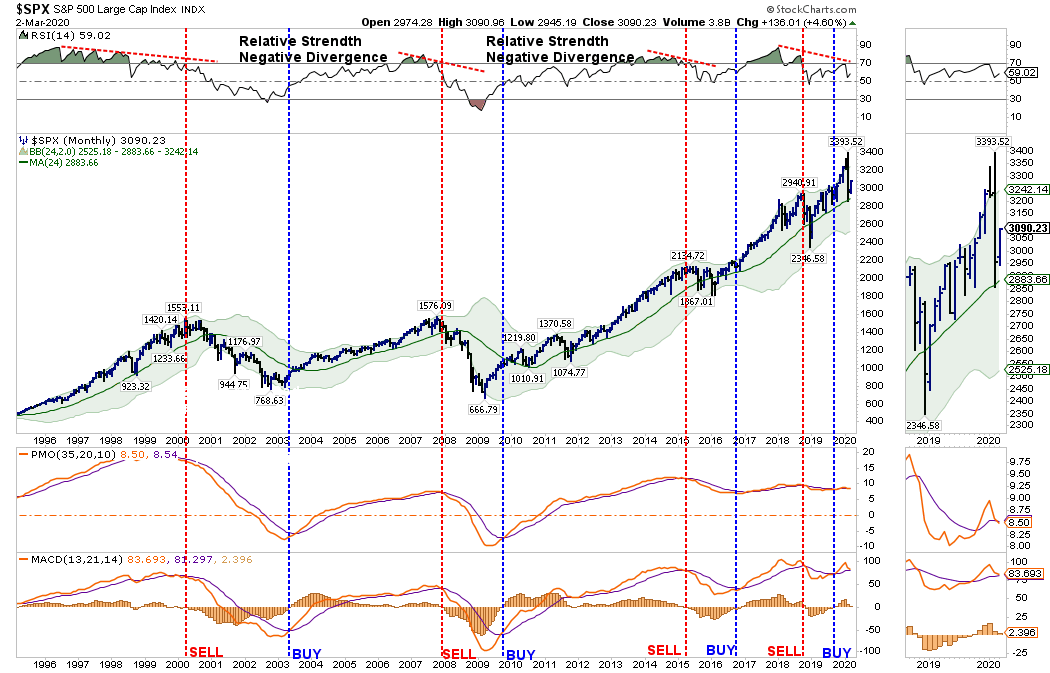
“As shown in the bottom two panels, both of the monthly ‘buy’ signals are very close to reversing. It will take a breakout to ‘all-time highs’ at this point to keep those signals from triggering.
For longer-term investors, people close to, or in, retirement, or for individuals who don’t pay close attention to the markets or their investments, this is NOT a buying opportunity.
Let me be clear.
There is currently EVERY indication given the speed and magnitude of the decline, that any short-term reflexive bounce will likely fail. Such a failure will lead to a retest of the recent lows, or worse, the beginning of a bear market brought on by a recession.
Please read that last sentence again.

Bulls Still In Charge
The purpose of the analysis above is to provide you with the information to make educated guesses about the “probabilities” versus the “possibilities” of what could occur in the markets over the weeks, and months, ahead.
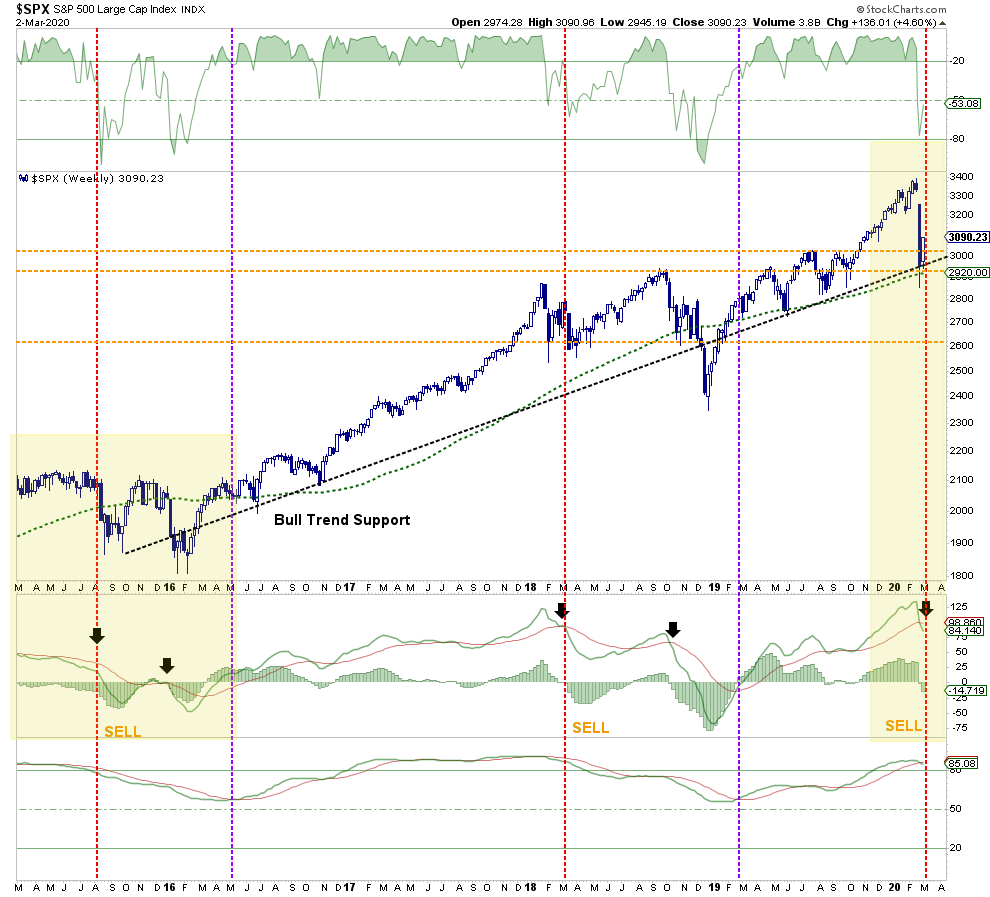
It is absolutely “possible” the markets could find a reason to rally back to all-time highs and continue the bullish trend. (For us, such would be the easiest and best outcome.) Currently, the good news for the bulls, is the bullish trend line from the 2015 lows held. However, weekly “sell signals” are close to triggering, which does increase short-term risks.
With the seasonally strong period of the market coming to its inevitable conclusion, economic and earnings data under pressure, and the virus yet to be contained, it is likely a good idea to use the current rally to rebalance portfolio risk and adjust allocations accordingly.
As I stated in mid-January, and again in early February, we reduced exposure in portfolios by raising cash and rebalancing portfolios back to target weightings. We had also added interest rate sensitive hedges to portfolios, and removed all of our international and emerging market exposures.
We will be using this rally to remove basic materials and industrials, which are susceptible to supply shocks, and financials which will be impacted by an economic slowdown/recession which will likely trigger rising defaults in the credit market.
Here are the guidelines we recommend for adjusting your portfolio risk:
Step 1) Clean Up Your Portfolio
- Tighten up stop-loss levels to current support levels for each position.
- Take profits in positions that have been big winners
- Sell laggards and losers
- Raise cash and rebalance portfolios to target weightings.
Step 2) Compare Your Portfolio Allocation To Your Model Allocation.
- Determine areas requiring new or increased exposure.
- Determine how many shares need to be purchased to fill allocation requirements.
- Determine cash requirements to make purchases.
- Re-examine portfolio to rebalance and raise sufficient cash for requirements.
- Determine entry price levels for each new position.
- Determine “stop loss” levels for each position.
- Determine “sell/profit taking” levels for each position.
(Note: the primary rule of investing that should NEVER be broken is: “Never invest money without knowing where you are going to sell if you are wrong, and if you are right.”)
Step 3) Have positions ready to execute accordingly given the proper market set up. In this case, we are adjusting exposure to areas we like now, and using the rally to reduce/remove the sectors we do not want exposure too.
Stay alert, things are finally getting interesting.

