
“Math of Loss” is chapter 3 of a 5-part series examining the narratives around “investing for the long run.”
Chapter 1: Think Like An Investor
Chapter 2: Investor Psychology
Chapter 3: Why Crashes, Timing & Valuations Matter
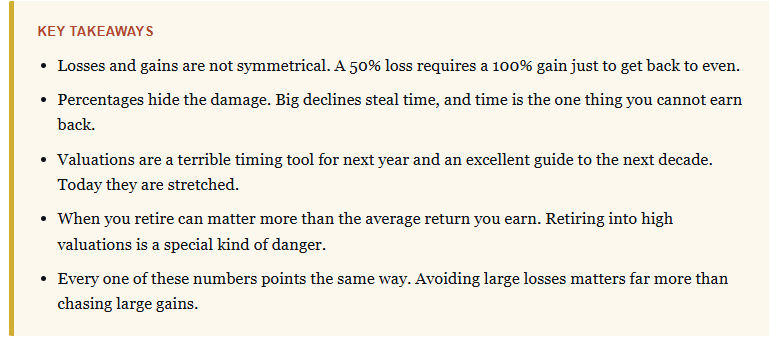
The first two articles in this series were about behavior. How to think like an investor instead of a speculator, and how to keep your own wiring and your own training from robbing you. This one is about arithmetic. Cold, unemotional, undefeated arithmetic. Underneath every good decision and every bad one sits a layer of math that does not care how you feel, and Wall Street would very much prefer you never do it in your head.
There are three numbers that decide most of your investing life. What a loss actually costs you to recover. What the price you pay today does to your future returns. And what happens when a bad stretch arrives at the wrong moment in your life? Let’s do the math Wall Street skips, one number at a time.
The Math Of Loss
At some point, you have probably seen a version of the reassuring chart below of a century of market history in which bull markets tower over bear markets, crashes look like tiny notches on a soaring line, and the caption tells you to relax and stay fully invested because it all works out. It is undoubtedly one of the most popular charts in finance, and it sells an illusion of safety.
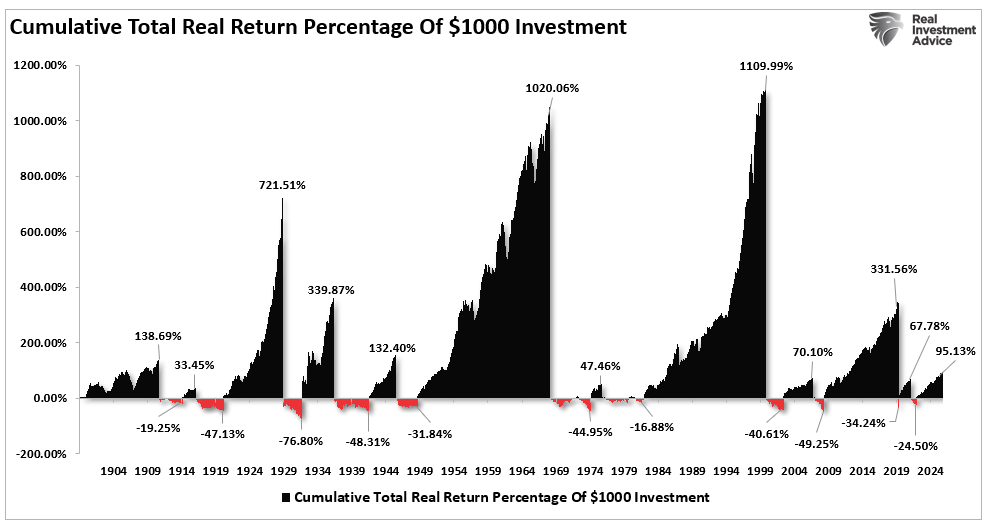
Before you believe the sales pitch that goes along with it, you should ask yourself two simple questions. If staying fully invested through everything is so obviously correct, why does no legendary investor actually do it? Every single great investor of time, from Buffett to Paul Tudor Jones, preaches some version of the same rule. That rule is “buy low, sell high, protect your capital.” Why? Because they know something the comforting chart leaves out.
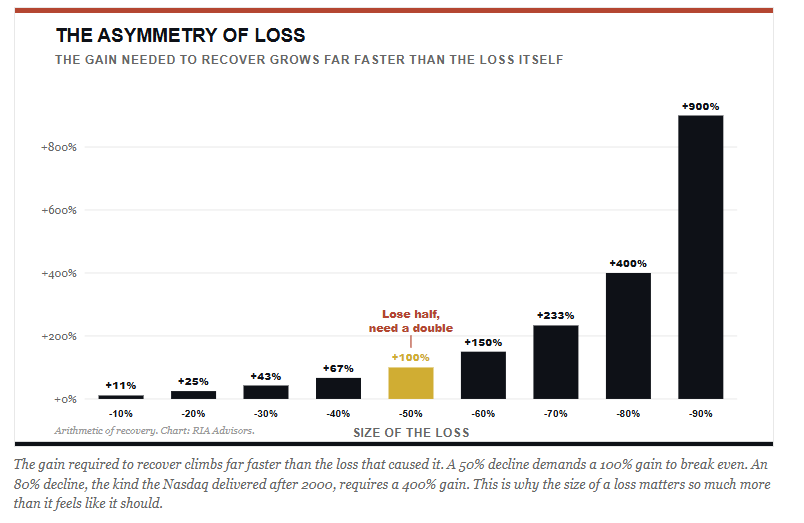
What “if” the chart and the pitch leave out one of the most misunderstood facts in investing? Percentage gains and losses are not mirror images of each other. If a portfolio declines by 10%, it will need about 11% to get back to breakeven. While that may seem tolerable, the math turns vicious quickly after that. As shown, a 20% loss needs a 25% rebound, but a 50% decline requires a 100% increase to recover. Think about that carefully, you need the market to double, just to get back to where you started. Recovering losses is not the same as growing your wealth.
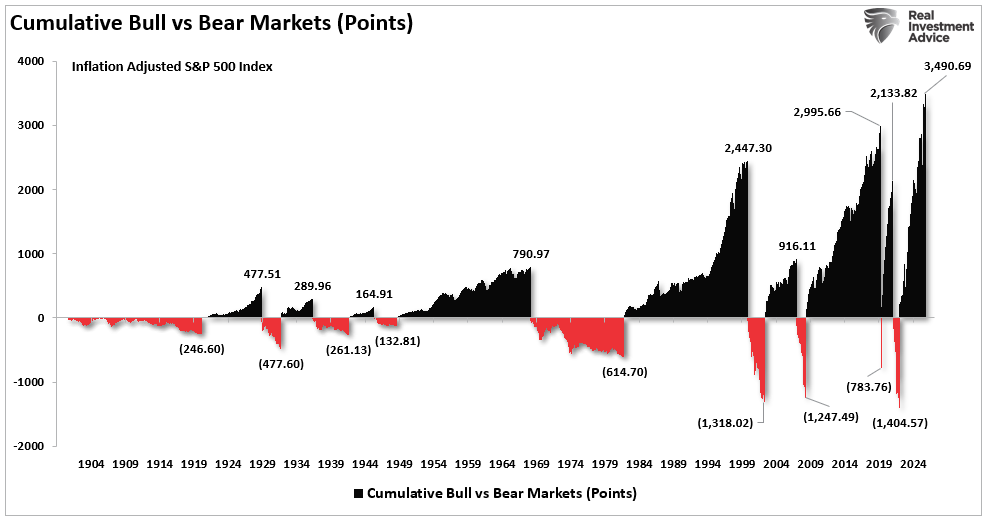
The trick of the chart is how percentages hide the real damage. For example, imagine an index that climbs from 1,000 to 8,000. That is a 700% gain, and you are feeling pretty brilliant. Here is where the percentages begin to trick you. If we assume a 50% correction, your 700% gain doesn’t become a 650% gain, the way subtraction in your head suggests. In reality, it subtracts 4,000 points and drops you back to 4,000, which is only a 300% gain. Half your points, and more than half your profit, gone in one move.
That is why a decline late in a long bull market is never just a blip. As discussed in Bear Market Losses, A Dangerous Illusion, the headlines speak in percentages because it makes the damage sound survivable. The chart below remakes the percentage chart above into actual point losses. Historically, bear markets tend to reverse a majority of the prior move. This is what Buffett and Tudor understand about protecting your investment capital.
There is more to this story, and it gets worse. Equal-sized gains and losses do not cancel out. Start with $100,000, gain 10% to $110,000, then lose 10%, and you are not back to even. You are at $99,000. Do that over and over, and the erosion has a name. “Volatility drag.” It is the reason a wild ride to the same average return leaves you poorer than a smooth one. Volatility works against you silently, year after year.
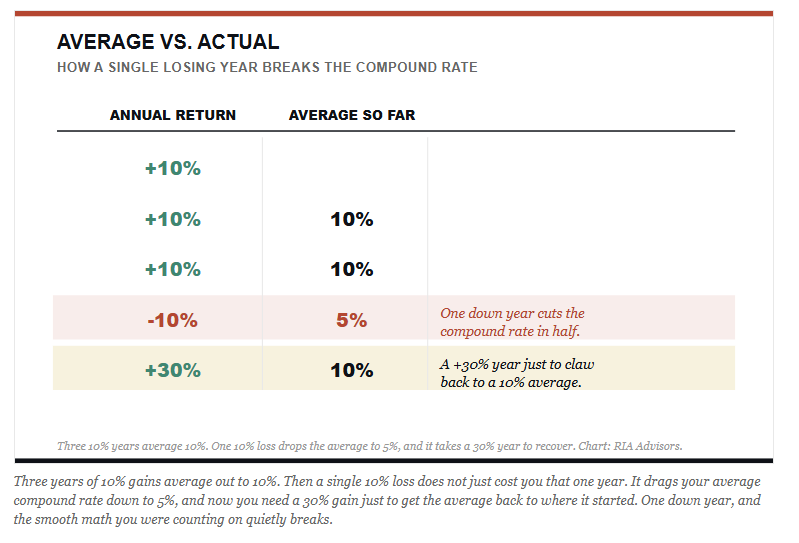
Which brings us to the single most important distinction in this entire series. The difference between the AVERAGE return and the ACTUAL return. A single 10% loss, after three years of 10% gains, cuts your compound growth rate roughly in half. To get back to the average you were promised, you now need a 30% gain. The average on the brochure and the actual money in your account are two very different things. And, most importantly, that gap between them is exactly where losses do their damage. It is the same lesson we started this whole series with. You do not get to spend the average.
And the deepest cost of a big loss is not even the money. It is time. When you take a severe drawdown, you do not just have to earn the money back. You have to earn it back before your goals arrive, and the market sets that schedule, not you. Here is how long the worst declines actually took to recover in real, inflation-adjusted terms, with dividends reinvested.
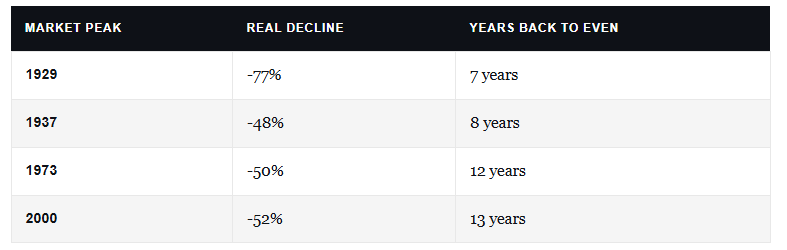
Sure, you can always earn more money. However, the one commodity you can not “buy” more of is “time.” That is the real math of loss, and it is why this instinct matters so much. Remember loss aversion from the last article, the wiring that makes a loss hurt twice as much as a gain feels good? That is the exact instinct that freezes you into holding a small, survivable loss until it becomes a catastrophic one. Benjamin Graham said it best decades ago.
“The investor’s chief problem, and even his worst enemy, is likely to be himself.”

Valuations Are Destiny
So the first job is avoiding the big loss. The second number tells you when the risk of one is highest, and it is the most reliable guide we have. Not a chart pattern, not a headline, but valuation. The price you pay for the market today sets a ceiling on what you can reasonably expect it to return over the next decade.
Let me be precise about what valuations do and do not do, because this is where most people get it wrong in both directions. Valuations are a terrible market-timing tool. They tell you almost nothing about where prices go over the next twelve months, and anyone using them to call next quarter is going to look foolish. But over a decade, they are about the closest thing this business has to gravity. High valuations do not mean every year ahead will be bad. They mean the total return across the whole decade is likely to be low. Those are very different claims, and holding both in your head at once is the mark of an investor who actually understands the tool.
One of the most widely quoted valuation measures is Dr. Robert Shiller’s CAPE ratio. CAPE is the ratio of the “cyclically adjusted price-to-earnings.” The ratio smooths earnings over a 10-year period, so a single boom-or-bust does not distort the picture. Here is where it sits today against 155 years of history.
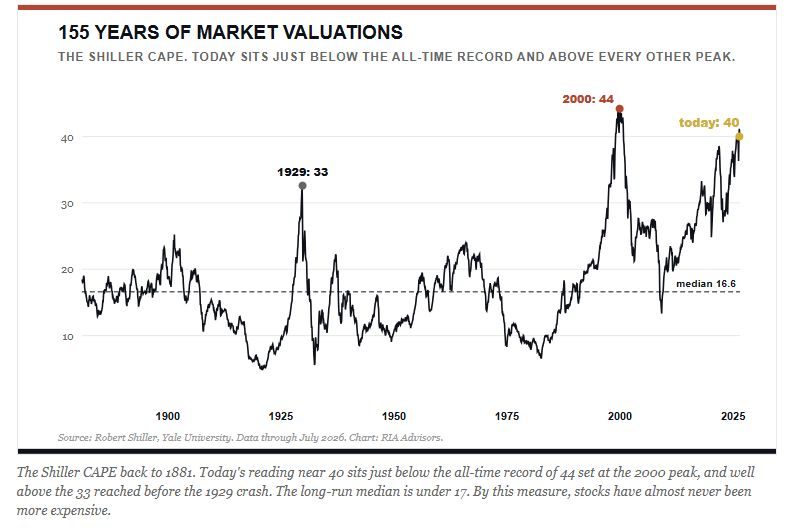
Now, you could argue the CAPE is just one measure, and you would be right. So consider that it has plenty of company. Price-to-sales ratio sits near record highs. Market capitalization relative to the size of the economy, the ratio Warren Buffett once called the best single gauge of valuation, tells the same story. So do the earnings yield and corporate return on equity. I have run through all of them in Lower Forward Returns Are A High Probability Event, and the punchline never changes. No matter which measure you pick, the message is identical. From here, expect less. That is what makes the signal robust. It is not one indicator flashing. It is all of them, at once.
And the historical record behind that signal is about as one-sided as anything in markets. Sort every month in history by its starting CAPE, then measure what the market actually delivered over the following decade.
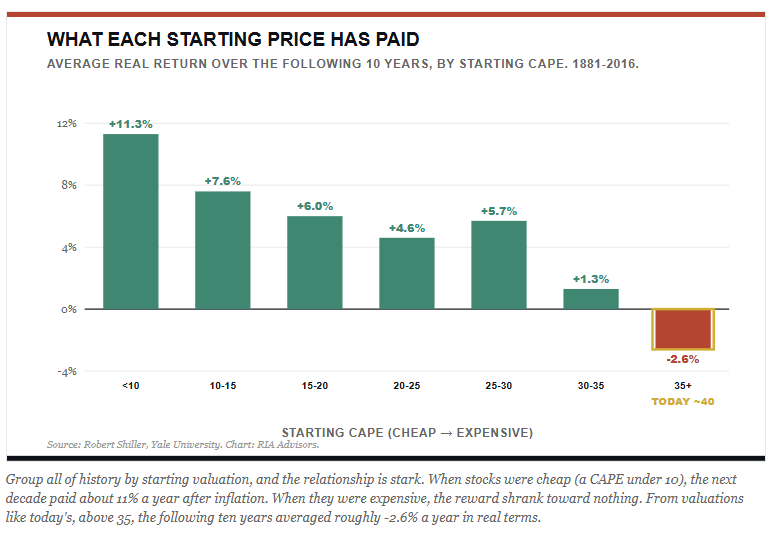
Read the far-right bar carefully, because that is where we live now. Every prior time valuations reached today’s neighborhood, the following decade delivered a NEGATIVE real return on average. The logic is not complicated. If you overpay today for a future stream of earnings, your future return has to be low. You have simply pulled tomorrow’s gains forward into today’s price and left the next decade with the bill.
It also explains a startling fact from market history. Across the last 150 years, only a handful of long secular bull markets produced essentially all of the market’s gains. Buy and hold during any of the long stretches in between, and the result was deeply disappointing. When you start matters, and you almost always start from wherever valuations happen to be. This is Bob Farrell’s first rule in action. Markets return to the mean, and the further they stretch above it, the more the next decade tends to give back. This time is rarely different.
“Valuation tells you almost nothing about next year and almost everything about the next decade. Pay a high price, and you have pre-committed to a low return.” – Real Investment Advice

The Retirement Reckoning
Let’s tie all this together, as this is where the first two numbers collide, and where the math gets personal. Everything above is manageable while you are still working and adding money. A bad decade early in your career is almost a gift, because you are buying cheap the whole way down. But flip the situation. Once you retire and start withdrawing money, the order in which your returns arrive can matter more than the average return itself. Financial planners call it sequence-of-returns risk, and it is the quiet killer of retirements.
The idea behind the “sequence of return” risk is both simple and brutal. In retirement, you start withdrawing income, so a large decline early in your retirement cycle can cause permanent damage. This is because every withdrawal during a downturn forces you to sell shares at depressed prices to cover your living expenses.
Think about it this way. If we assume a $1,000,000 portfolio, with the 4% taken as a fixed dollar amount ($3,333/month, the classic 4%-rule convention) and the market declines by 10%, your portfolio ends down about 13.78%, not 10%.
Go back to the “math” above. That 13.78% loss, assuming the ongoing 4% withdrawal, now requires an 21.14%. recovery. See the problem with the simple math? Even when the market fully recovers, your portfolio does not.
Repeated studies of retirees who withdraw around 4% per year find that a 30% to 40% loss in the first few years sharply increases the odds of running out of money, even if the long-run average return is perfectly fine. The order is the whole game. Watch what that looks like.
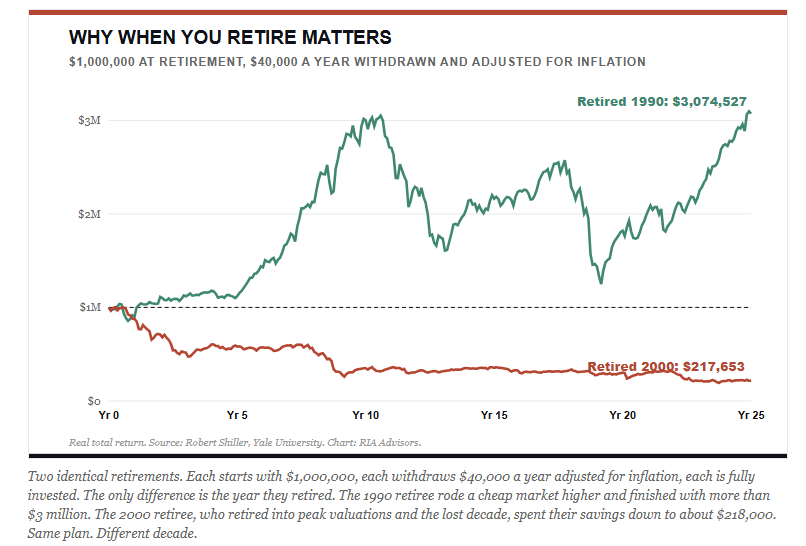
That is the same strategy, same withdrawal, and the same discipline. One retiree ends up with three million dollars, and the other nearly runs out, and neither of them did a single thing differently. The 2000 retiree simply had the misfortune of retiring into high valuations right before a lost decade, drawing income while the portfolio was underwater. That is sequence risk, and here is the part that should get your attention. The 2000 retiree started at a CAPE of 44. Today we sit near 40.
That does not mean anyone retiring now is doomed. It means the margin for error is thin, and the standard advice to simply buy, hold, and withdraw a fixed percentage was built on a much cheaper market than the one in front of us. If you are within a few years of retirement, this is the number that matters most, and it is the one that almost never makes it into the glossy brochure.
What The Math Tells You To Do
Okay, it’s time to tie this all together, and there are three numbers and one conclusion.
- Losses are asymmetric, so avoiding a big one is worth more than catching a big rally.
- Valuations set the odds, and today they are stacked toward lean returns.
- And timing, especially near retirement, can overwhelm everything else.
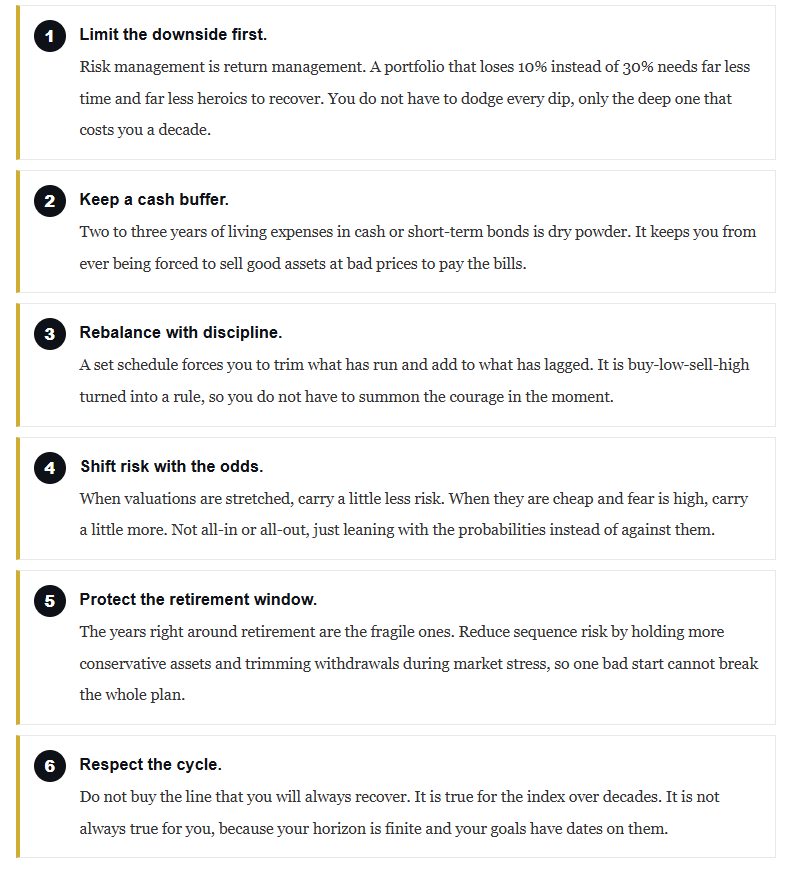
Put together, they do not say sell everything and hide in a bunker. They say to manage risk deliberately. Here is the framework I come back to, drawn from years of writing on portfolio risk management.
The Bottom Line
None of this math is complicated. That is what makes it so striking that so few people ever do it. A loss needs an outsized gain to recover. A high price today means a low return tomorrow. And a bad decade at the wrong moment can undo a lifetime of saving. The market has been teaching these three lessons for 155 years, in the same numbers, over and over, and they have never once gone out of style. Savvy investors stop thinking in percentages and days, and start thinking in dollars, years, and goals.
The math is pretty simple, and its message is clear:
- Avoid big losses
- Respect valuations, and
- Mind your timing.
If that is the case, then why does so much of the industry insist on the opposite? Why are we told to always stay fully invested, that you cannot beat the index, that the great investors are impossible to imitate, and that costs are the only thing that matters? In the next article, we take on the myths themselves, the comfortable stories the industry tells to keep you passive, and we run each one through the same unforgiving math we just used here.
Sources & Notes
- Real total return, CAPE valuation, and inflation data: Robert Shiller, Yale University. econ.yale.edu/~shiller/data.htm. All four charts are built directly from this series, data through July 2026.
- Lance Roberts, “Bear Market Losses, A Dangerous Illusion,” RIA Advisors. realinvestmentadvice.com
- Lance Roberts, “Lower Forward Returns Are A High Probability Event,” RIA Advisors. realinvestmentadvice.com
- Lance Roberts, “The Best Measure Of Future Stock Market Returns,” RIA Advisors. realinvestmentadvice.com
- Lance Roberts, “Portfolio Risk Management: Accepting The Hard Truth,” RIA Advisors. realinvestmentadvice.com
- The math of loss is arithmetic: the gain required to recover a loss of x% equals x / (100 – x). Drawdown and recovery figures are real (inflation-adjusted) total return, dividends reinvested. Forward-return-by-valuation figures group every month since 1881 by starting CAPE and measuring the subsequent 10-year annualized real total return. Retirement illustration: $1,000,000 initial balance, $40,000 first-year withdrawal, grown with inflation, invested at the market’s real total return from each start date.
- Benjamin Graham, “The Intelligent Investor.” Bob Farrell, “10 Market Rules to Remember,” Merrill Lynch.