
Many measures of future stock market returns are derived from economic and financial variables. You are likely familiar with most of them, from Dr. Robert Shillers’ Cyclically Adjusted PE (CAPE) to Warren Buffett’s Market Capitalization to GDP ratio.
As we have discussed many times, the problem is that valuation measures are just that – a measure of current valuation. More importantly, when valuations are excessive, it is a better measure of “investor psychology” and the manifestation of the “greater fool theory.”
Notably, valuation models are not, and were never meant to be, “market timing indicators.” There are many articles penned suggesting that if a measure of valuation (P/E, P/S, P/B, etc.) reaches some specific level, it means that:
- The market is about to crash, and;
- Investors should be in 100% cash.
Such is incorrect.
What valuations do provide is a reasonable estimate of long-term investment returns. It is logical that if you overpay for a stream of future cash flows today, your future return will be low. We can see that evidence by looking at the 10-year total return of a $1000 investment into the stock market as compared to Shiller’s CAPE ratio, as noted above.

Another way to look at valuations and forward returns is with a scatterplot. As you will notice, real total returns over the next decade are near zero at current valuations.
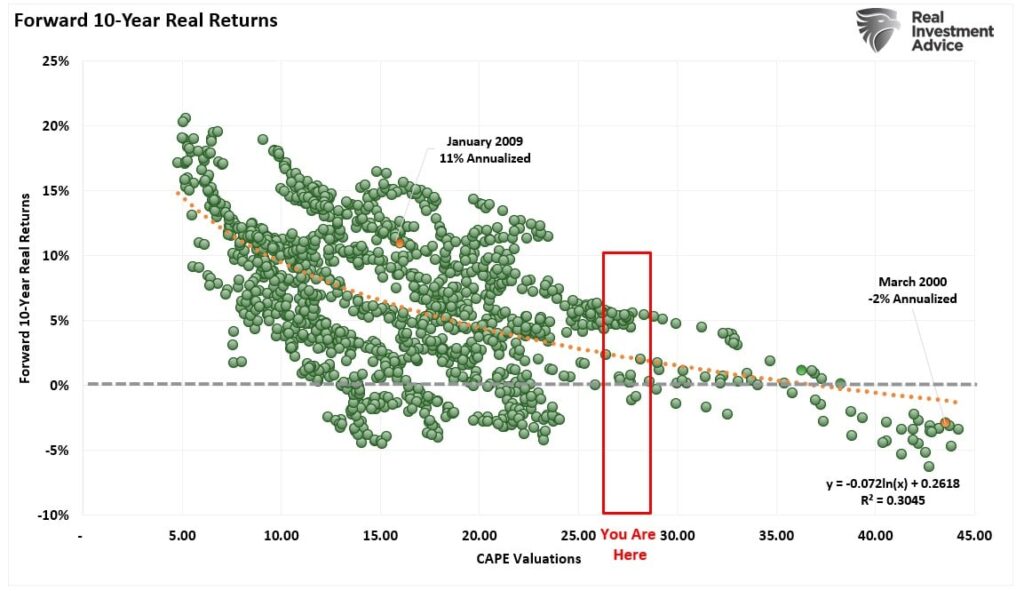
While none of this is news, it is a good reminder of where we are currently in the financial cycle. While many hope the last decade’s bull market will continue for another, history suggests such may be a challenge.

Investor Psychology And Stock Market Returns
As noted, valuations are a reflection of investor psychology. As such, it is unsurprising that investor allocations to equities hit a record level at the end of 2021 as the stock market surged. However, that surge in equity ownership resulted from more than $5 Trillion in stimulus sent directly to households along with the largest “Q.E.” program by the Federal Reserve in history. The reversal is unsurprising, as history would suggest.
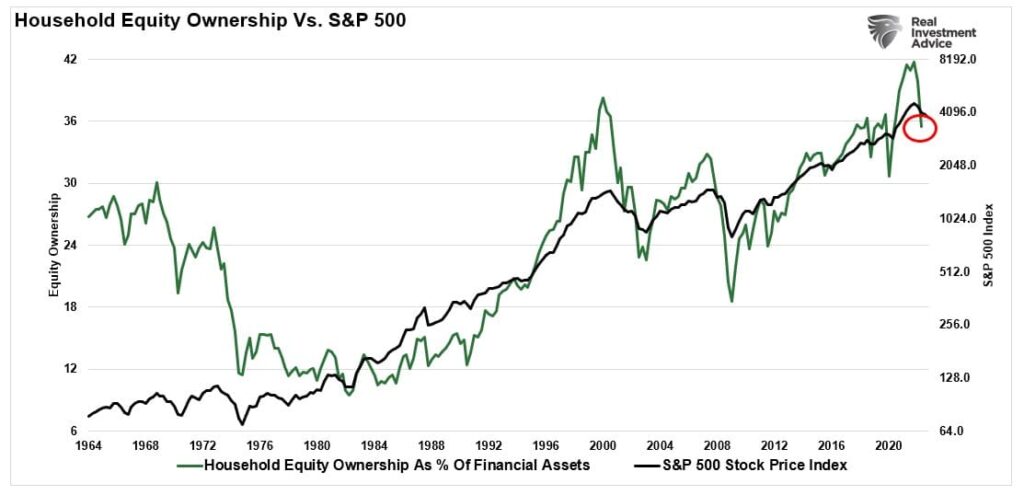
Since asset bubbles are a function of investors’ “buy high and sell low” syndrome, allocations also tell us much about future returns.
In 2021, my friend and colleague, Jim Colquitt of Armor ETFs, made a salient point. The chart below shows the standard deviation between investor allocations and future 10-year returns. Per Jim:
“Note that the most recent data point (51.8% as of 12/31/21) is now the highest value in the history of this index. Using this data, I created a regression model to forecast the 10 Year Forward Annualized Price Return for the S&P 500. The result is that from 12/31/21 forward, we should expect a return of -3.85% over the next 10 years for the S&P 500.”
His analysis and warnings were timely, and we now know that our previous warnings of overvaluation weren’t in error.

Given the current reversion in prices and subsequent decline in valuations, 10-year forward returns have crept back toward zero currently. However, given that the economy and earnings will face a recession next year, we suspect that we will see forward returns continue to moderate around the zero line for quite some time.

It is worth noting that there are no guarantees when looking 10 years into the future. Many things can and will change that will alter forecasts and returns. The Federal Reserve can, and likely will, revert back to zero rates and another QE program which will likely inflate another asset bubble. The economy will experience a recession but then recover, lifting earnings growth rates in the future.
However, if history is any guide, current valuations, which reflect investor psychology, suggest that markets are currently overvalued. If that is true, we can construct a “fair value” market model per Jim’s hypothesis. To wit:
“The chart below plots the S&P 500 and the model’s estimated fair value price. The Z-score gets based on the difference between the actual and model estimates (histogram).”

As Jim notes, this allows for an interesting observation that “most major market corrections do not end until either:”
- The market reverts to, or violates, the model estimate and/or
- The Z-score declines to somewhere between -3.0 & -4.0.

Weekly Market Insight
Get the Bull Bear Report in your inbox.
Lance Roberts’ weekly read on markets, positioning, and risk. Free. No fluff. Lands in your inbox every Saturday morning.
Subscribe FreeThis Time Wasn’t Different
As stated at the outset, valuations are a terrible market timing metric. However, they tell us much about asset bubbles, investor psychology, and future returns.
In 2021, we stated:
“While the Federal Reserve notes valuations are elevated, the crucial message to investors gets obfuscated. From current valuation levels, the expected rate of return for investors over the next decade will be low.“
That statement does not mean that markets will produce single-digit rates of return each year for the next decade. There will be some great years to invest during that period. Unfortunately, the bulk of those years will get spent making up for the losses from the coming recession and market correction.
That is the nature of investing in the markets. There will be fantastic bull market runs, as we have witnessed over the last decade, but to experience the up, you will have to deal with the eventual down. It is part of the full-market cycles that make up every economic and business cycle.
Despite the hopes of many, no one can repeal the cycles of the market and the economy. While artificial interventions can delay and extend the cycles, the reversion will eventually come.
As we now know, “this time was not different,” and investors were once again reminded of the most basic of investment truisms:
“The price you pay today for any investment determines the value you will receive tomorrow.”
Unfortunately, those reminders always come in the most brutal of manners.
The good news is that forward returns for investors will begin to improve.
Work With RIA Advisors
Have a Conversation About Your Portfolio.
If anything in this article raised a question about your own situation, talk to our team. A 30-minute conversation costs nothing, and it will tell you whether what you’ve built is actually positioned for what’s ahead.
Schedule a Consultation30+
Years Guiding Investors Through Real Cycles
1987. 2000. 2008. 2020. Been there, done that.

