
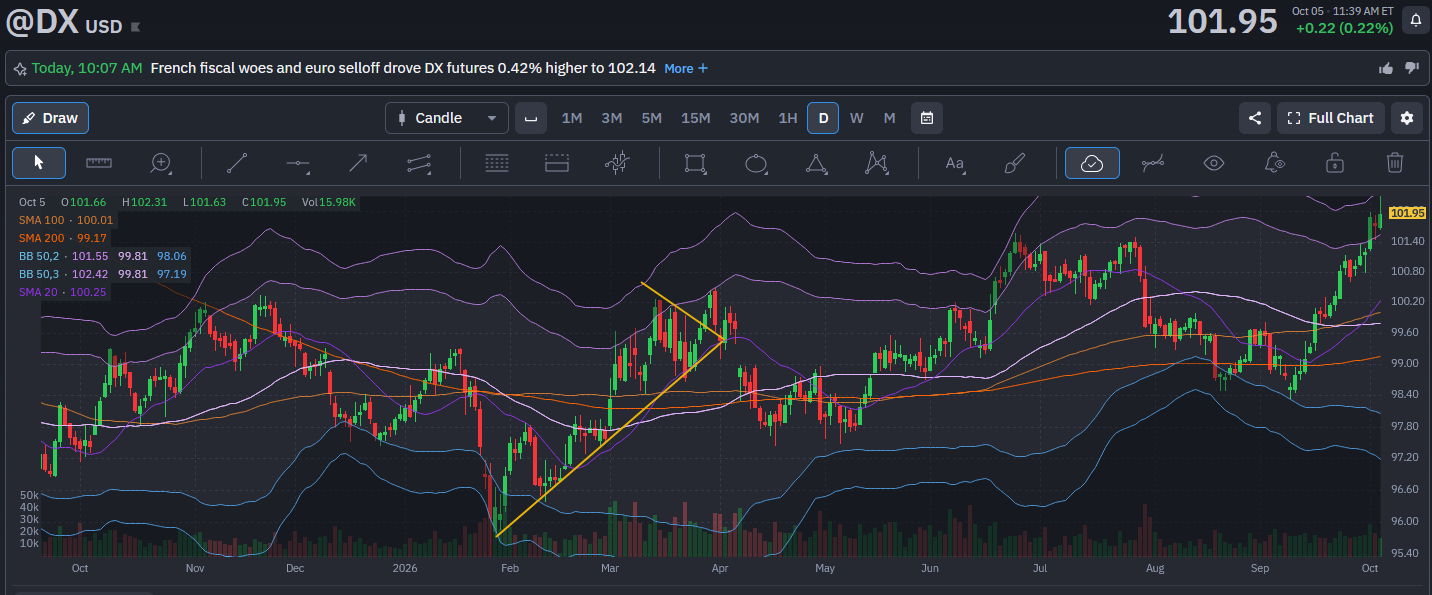
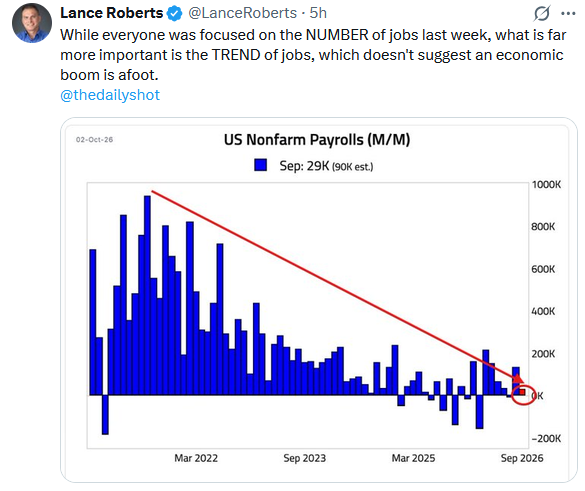
Since early September, the dollar Index has risen nearly 4%, reaching its highest level in over a year. The continued rally over the last few days is strange, since October rate-hike odds collapsed from above 60% to roughly 25% on a weak payroll number and less-than-expected PCE price data. Softer policy expectations normally weaken a currency.
Dollar strength has been a reliable headwind across asset classes. Over the past ten years of monthly returns, every major category has moved inversely to the dollar as the table below shows.
| Index | Correlation with dollar | Avg month, dollar up | Avg month, dollar down |
|---|---|---|---|
| S&P 500 | -0.32 | -0.14% | +2.74% |
| Developed foreign (EFA) | -0.57 | -1.47% | +3.01% |
| Emerging markets (EEM) | -0.53 | -1.45% | +3.10% |
| Long Treasuries (TLT) | -0.35 | -1.18% | +0.59% |
Across the last ten years, the S&P 500 averaged a slight loss in months the dollar rose and gained 2.74% in months it fell. Bear in mind roughly 40% of S&P 500 revenue comes from abroad, and a stronger dollar shrinks the revenues on translation regardless of changes to demand. Foreign equities show much more sensitivity to the dollar, which makes sense, as dollar-based investors in foreign ETFs like EFA or EEM absorb the currency gains or losses.
Long bonds (TLT) give us pause. TLT averaged a 1.18% monthly loss when the dollar strengthened. Often, a strong dollar reflects safe-haven demand and therefore supports Treasuries. While it doesn’t hold in this sample, it is largely because of the large 2022 moves when the dollar surged and bond prices collapsed.
What To Watch Today
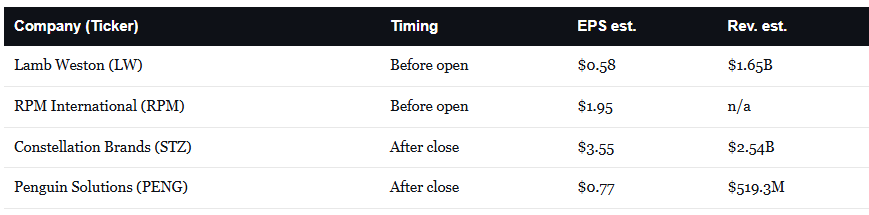
Earnings
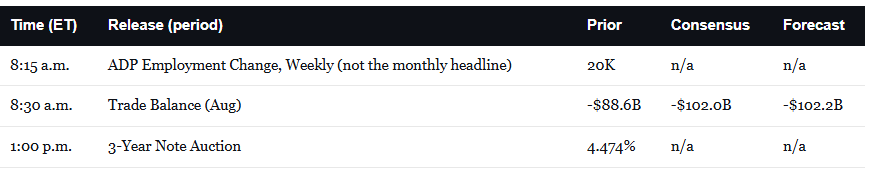
Economy
Market Trading Update
Yesterday, we walked through the technical backdrop, with the S&P 500 stuck between 7,560 and the record zone at 7,800. Today, let’s discuss the “upside pain trade.” Everyone is asking what breaks next. The better question is what happens if nothing breaks at all.
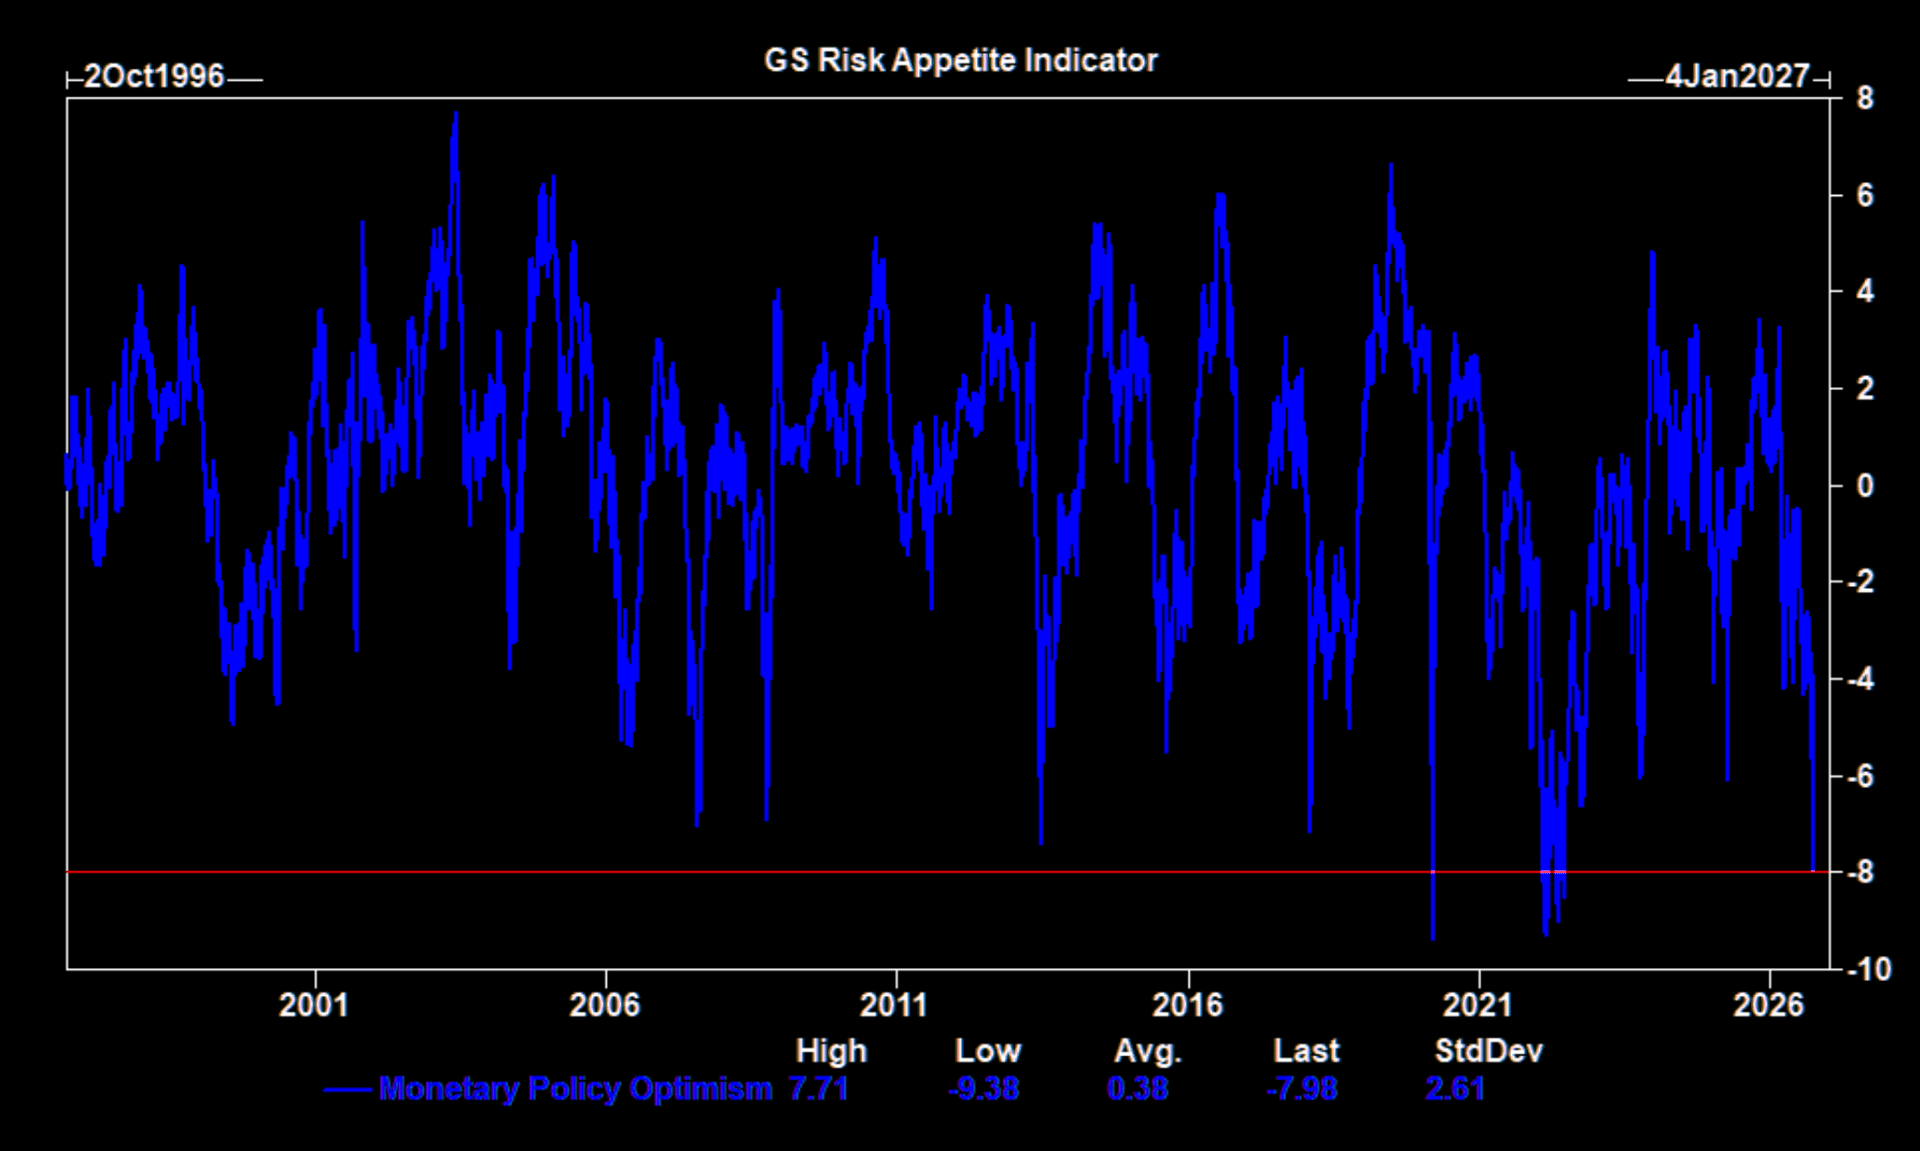
Start with how investors view policy. Goldman’s Monetary Policy Optimism gauge sits near negative 8, close to the bottom of its 30-year range. Hedge fund net US equity positioning ranks in the 0th percentile. Investors aren’t bracing for bad news. They’ve already priced it.
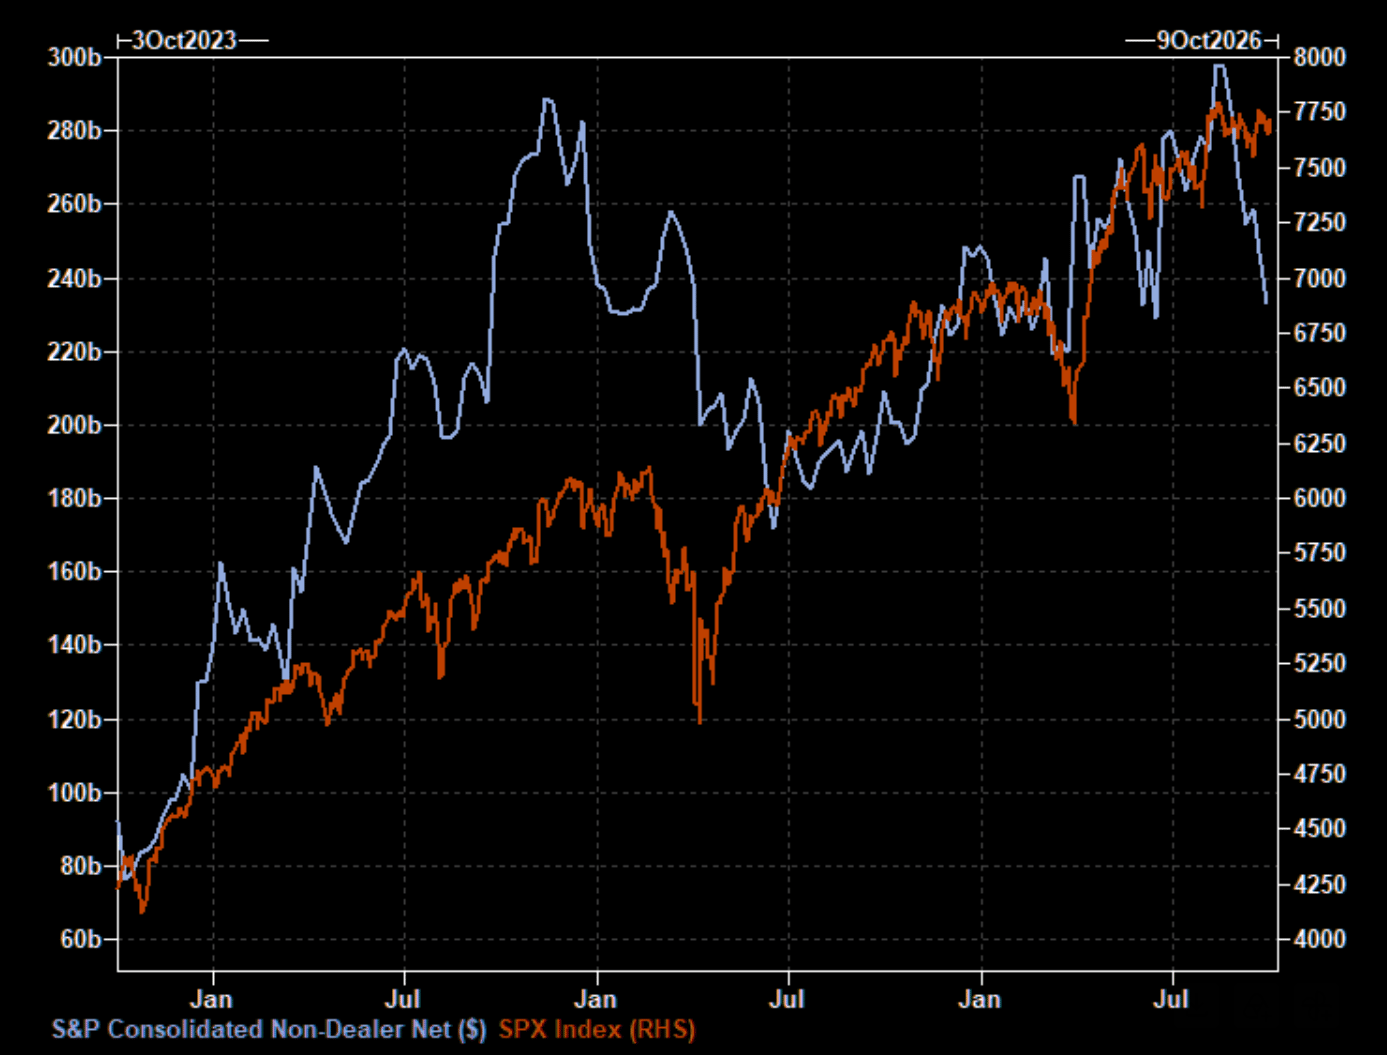
The selling has been real, too. Non-dealers dumped $63.7 billion of S&P futures over six weeks, selling in five of them. Asset managers alone sold $11.7 billion last week. Here’s the detail that matters. More than 70% of that move came from long liquidation, not new shorts. Add Citadel’s estimate that CTA positioning swung from +2.35 to -0.80 standard deviations in a month. The sellers have mostly sold, yet the index still closed Friday at 7,722.72.
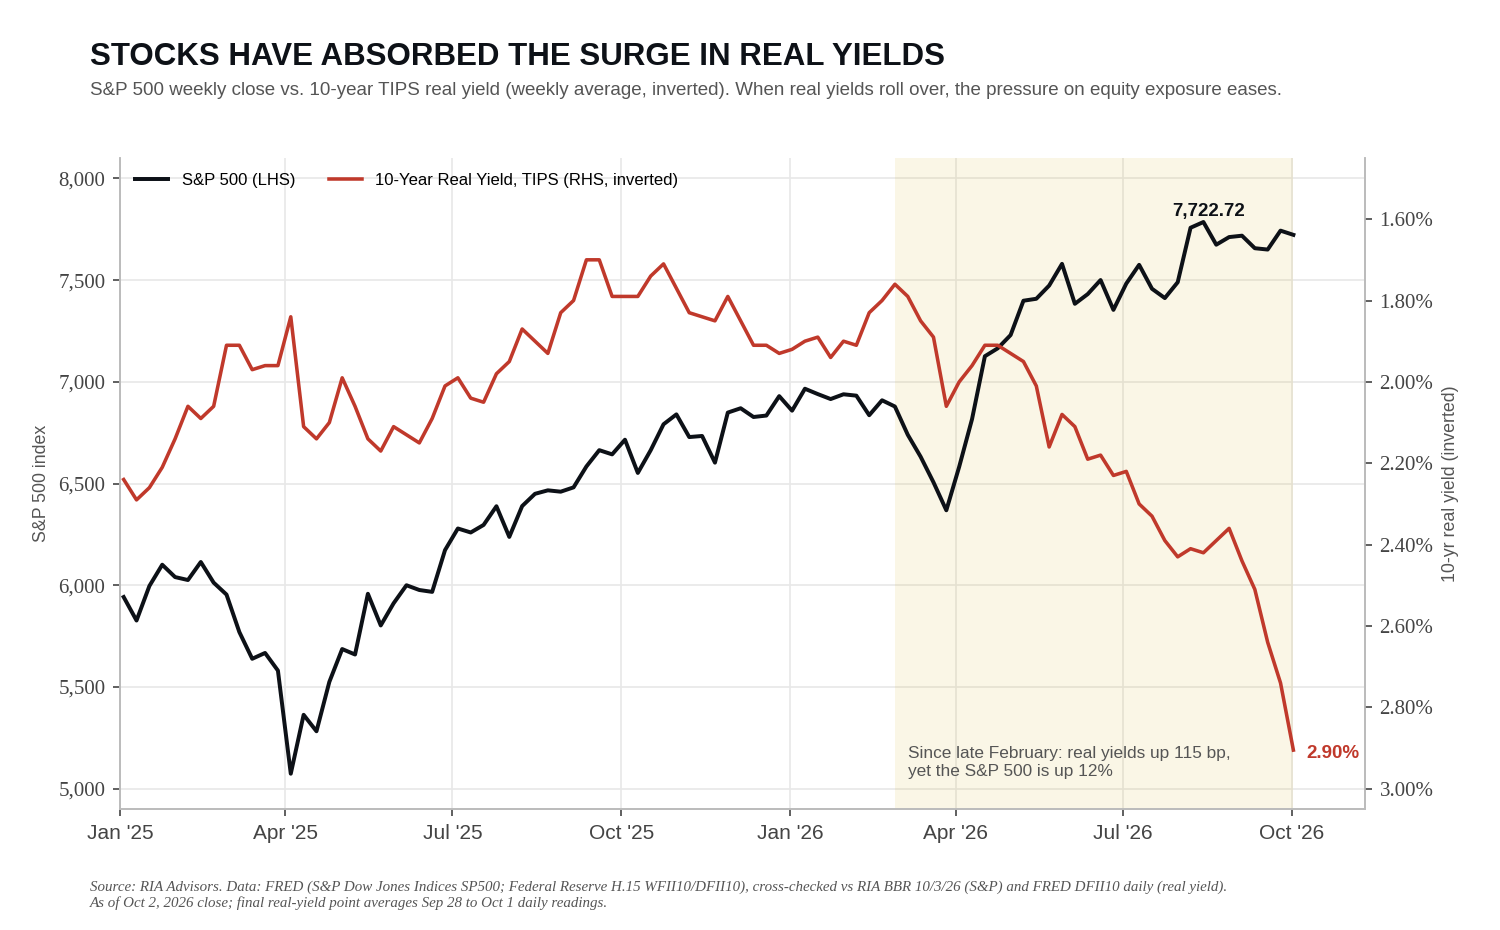
So what flips it? Rates. Goldman notes that asset-manager longs have closely tracked 10-year real yields, and the latest 25-basis-point jump was accompanied by another $5.5 billion in liquidation. Notice in the chart below that real yields have climbed roughly 115 basis points since late February, to about 2.91%. Yet the S&P 500 is still up 12% over that stretch. Now the MOVE index, at 107.29, shows early signs of stabilizing. If bond volatility cools, the main reason to cut equity exposure starts running in reverse. Then layer in buyback windows reopening in mid-October, with Citadel counting a record $1.3 trillion in authorizations.
A doubter in the back row will say bulls always talk this way near the top. Fair enough. But the pain isn’t evenly spread. Tech allocations still sit in the 96th percentile of the past five years, even after last week’s selling. Russell 2000 systematic exposure is at the 7th percentile, and leveraged funds hold record shorts. Such is the asymmetry. A squeeze would be more likely to run through small caps and rate-sensitive laggards than through crowded mega-caps.
That shapes our positioning. In the ETF Sector Rotation Model, we’re rebalancing the weightings more towards the value side and taking profits in the growth factors. We are positioning for a potential squeeze before rates confirm it. Wednesday’s 10-year auction and FOMC minutes are the test, and the 7,560 floor remains our stop.
Markets rarely punish the crowd that has already run for the exits. They punish the ones who never came back.

Time To Rotate? First, Connect The Dots
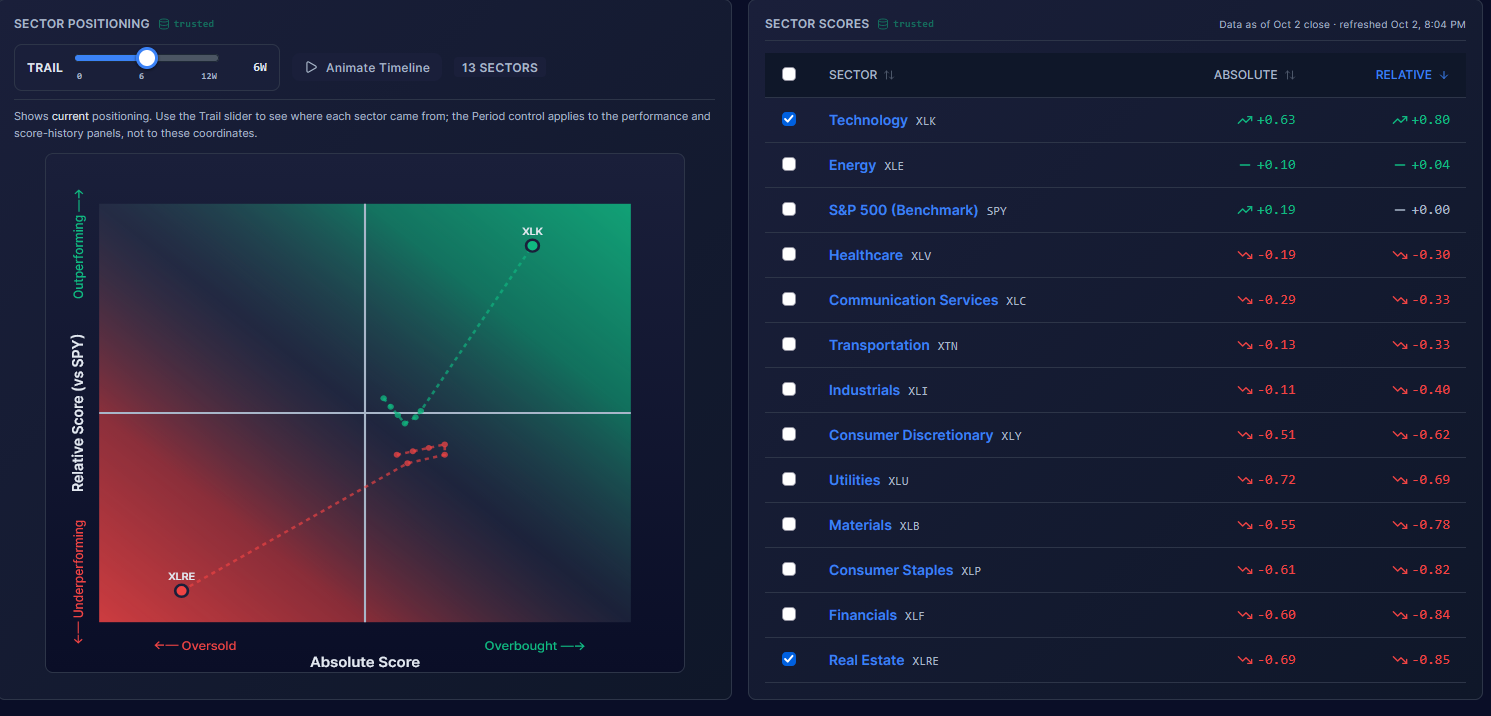
The table on the right side below shows that technology is very overbought, energy is at fair value, and every other sector is either moderately or very oversold. The interest-rate-sensitive sectors appear most oversold, while the more economically sensitive sectors tend to be a little less oversold. The graph on the left side of the screenshot plots how the technology and REIT sectors have diverged over the last 6 weeks. As it shows, they are nearly mirror images of each other.
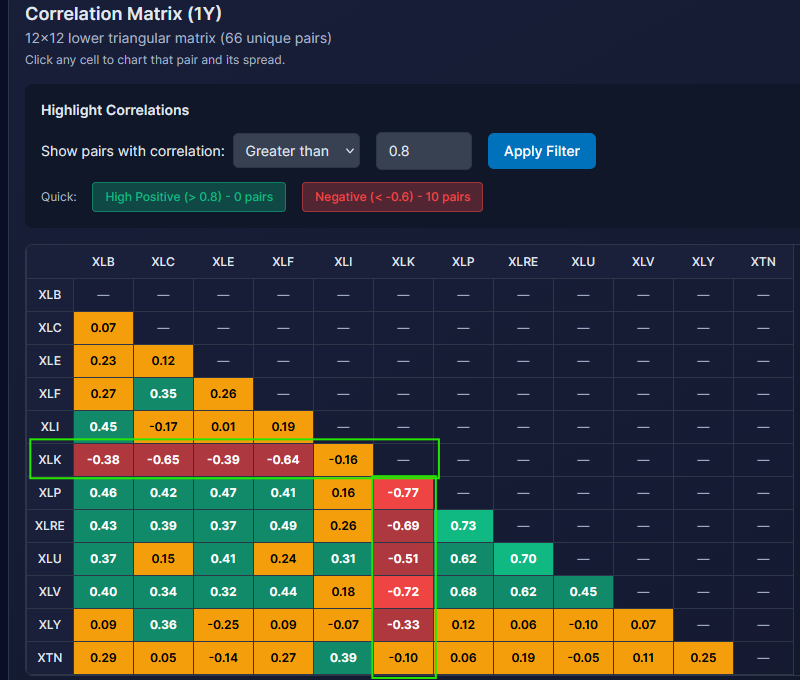
The second graphic shows the mirror image is not a mirage. It compares the correlations between the excess returns of every sector. As we highlight in green, negative correlations are extremely high for most sectors versus the technology sector. As we have noted, this extreme negative correlation and dispersion will not last; however, it may take lower yields to force a rotation in the stock market.
It’s time to connect the dots. Essentially, active traders’ returns over the next few months may depend heavily on the bond market. Furthermore, given the record-high correlations between bond yields and oil, oil prices and events in Iran will drive yields, and in turn, impact relative sector returns.
Sequence Of Returns Risk: The Math That Breaks Retirements
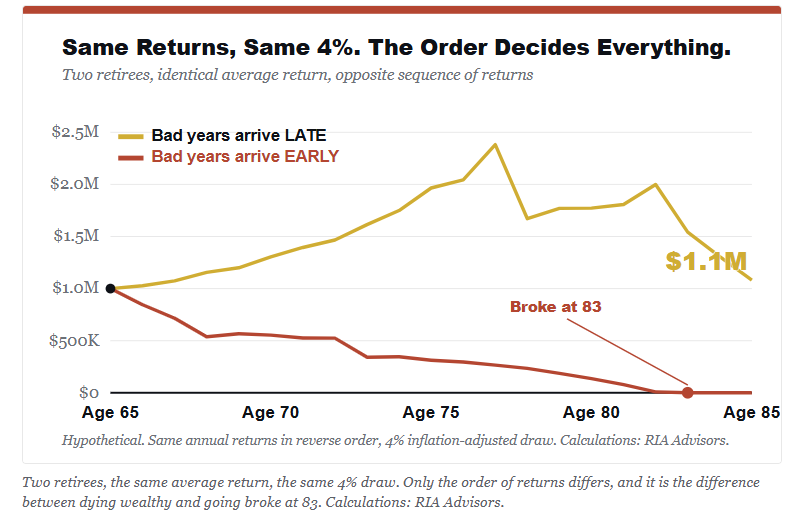
Let’s start with an easy example. Two people retire on the same day with the same million dollars. They have the same portfolio and the same 30-year average return. They should both live comfortably, right? However, while one does die comfortably, the other runs out of money.
Nothing separates them except the ORDER in which their returns arrived. That is the “sequence of return risk,” and probably the single most underappreciated threat to anyone who has stopped saving and started spending. While you were accumulating, the order of your returns barely mattered. Once you are withdrawing, it becomes the entire ball game.

Tweet of the Day
Trading Rules With Desktop Printout
“Want to achieve better long-term success in managing your portfolio? Here are our 15-trading rules for managing market risks.”
Please subscribe to the daily commentary to receive these updates every morning before the opening bell.
If you found this blog useful, please send it to someone else, share it on social media, or contact us to set up a meeting.