
The sequence of return risk is the quiet reason two retirees with identical average returns can end up in very different places.
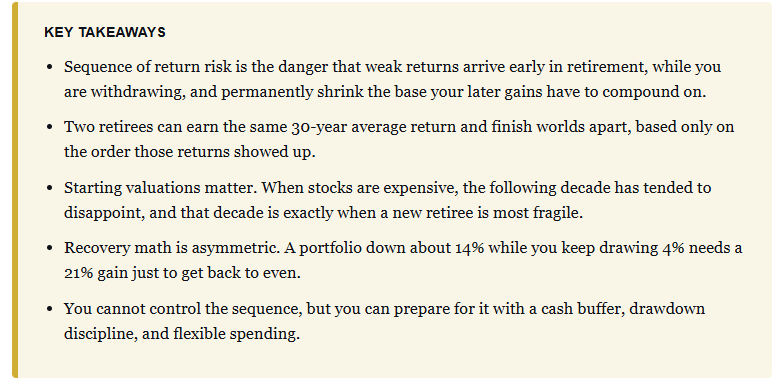
Let’s start with an easy example. Two people retire on the same day with the same million dollars. They have the same portfolio and the same 30-year average return. They should both live comfortably, right? However, while one does die comfortably, the other runs out of money.
Nothing separates them except the ORDER in which their returns arrived. That is the “sequence of return risk,” and probably the single most underappreciated threat to anyone who has stopped saving and started spending. While you were accumulating, the order of your returns barely mattered. Once you are withdrawing, it becomes the entire ball game.
What Sequence Of Return Risk Actually Is
The 4% rule originated with financial advisor William Bengen in 1994 and was later stress-tested by three professors in what became known as the Trinity Study. Notably, Bengen wasn’t hunting for an average; rather, he wanted the worst starting year in history that a retiree could still have survived. The answer had little to do with typical market returns. What it came down to was the retiree unlucky enough to begin in 1966, right before a long grind of bear markets and inflation that hollowed out the first half of retirement.
Before we go further, it is important to understand the problem with averages. When it comes to market returns, a portfolio that no one touches can absorb a bad decade and allow a good decade to balance the books. However, a portfolio in which withdrawals are taken cannot wait. When you sell shares during a decline, those shares are gone, and they never join the recovery. Wade Pfau estimated that roughly 77% of a retiree’s final outcome is set by the first ten years alone. In other words, the average across 30 years can look perfectly “fine” while the sequence quietly destroys you.
This is the cruel arithmetic of the withdrawal phase for retirees. When you are a 35-year-old saving for retirement, market volatility is a boon. However, that same volatility becomes a genuine hazard for a 68-year-old. One is “buying the dip” with every paycheck, while the other is being a “forced seller” to survive. Same market, opposite outcomes.
Why Starting Valuations Load The Dice
If sequence is the risk, valuation is your best early read on it, and this is the part of the retirement conversation that usually gets skipped. The 4% rule was calibrated across all of history, cheap starting points and expensive ones blended into one number. The market, though, doesn’t offer every retiree the same deal on their first day. Your exposure to sequence-of-returns risk is partly a function of the price you pay to walk in the door.
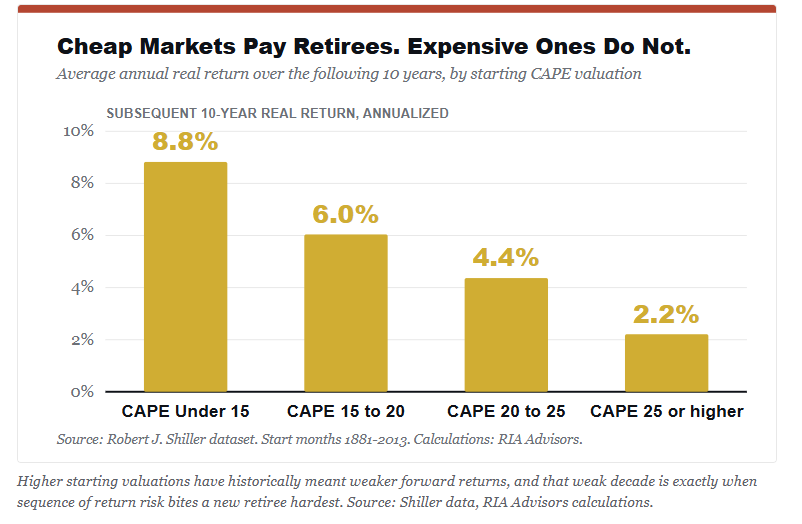
Research by both Wade Pfau and Michael Kitces showed that the “safe” withdrawal rate moves with valuation at the moment you retire. An individual who retires when valuations are cheap has had history be generous. Retire when they are “expensive” and the first decade, the one that decides most of your outcome, tends to disappoint. The chart below rebuilds that relationship from Robert Shiller’s stock market data back to the 1880s, and I’ve walked through it before using a five-year version of the CAPE.
Cheap Starts Win, Expensive Starts Lose
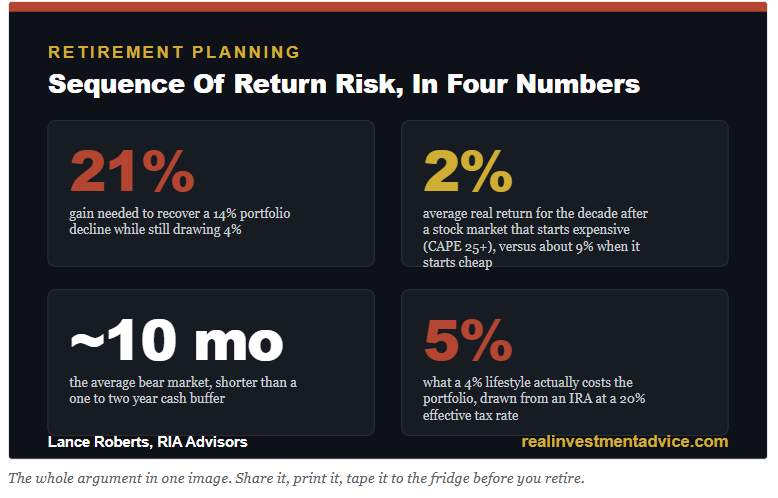
Pay close attention to what happens across the valuation buckets. When the cyclically adjusted price-to-earnings ratio started below 15, the next ten years delivered close to 9% real returns. When it started at 25 or higher, that forward decade shrank to barely 2%. This isn’t a coincidence. History has repeatedly shown us that lower forward returns are the high-probability outcome from rich valuations. Same asset, wildly different opening hands, and the retiree has no vote on which one they draw.
This is the point at which I most often receive reasonable pushback: “Nobody can time valuations.” Yes, that is a fair point. We are not discussing market timing, and valuations are a terrible indicator for that. However, valuations calibrate how much risk you take relative to what the market is offering, because in the long run, valuation is the best measure of returns we have. A rich valuation doesn’t guarantee a bad sequence. It just stacks the deck in favor of one.

The Loss Math That Makes Recovery So Hard
Before you get lost in the debate, take a moment and focus on the mechanism that makes this so unforgiving. Market, and ultimately portfolio, losses and gains are not symmetric, and most people misjudge the gap. A 10% loss needs an 11% gain to recover, which feels “manageable.” A 30% loss requires a 43% gain, and a 50% loss requires the market to double. The deeper the hole, the steeper the climb, and it steepens at an accelerating rate.
For a retiree, however, the math becomes far more brutal. As you are climbing out of that hole, you are effectively cutting the rope above you by pulling money out, and every dollar withdrawn during the recovery is one that never rebounds.
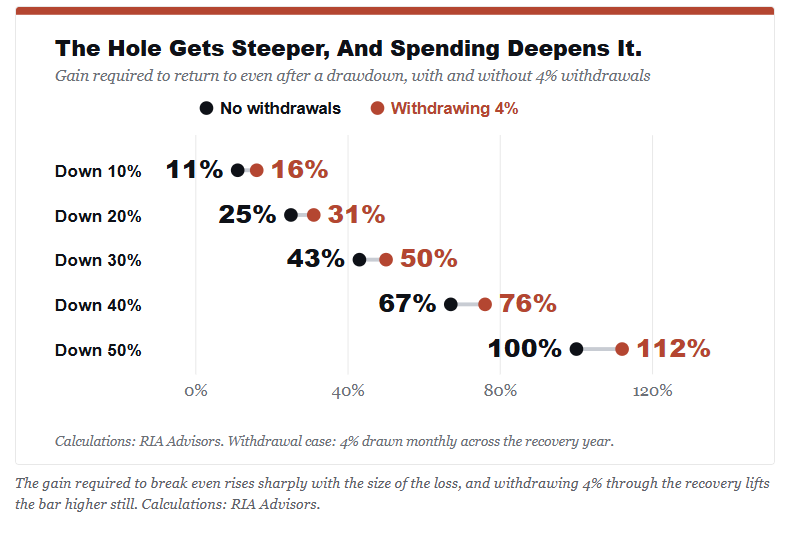
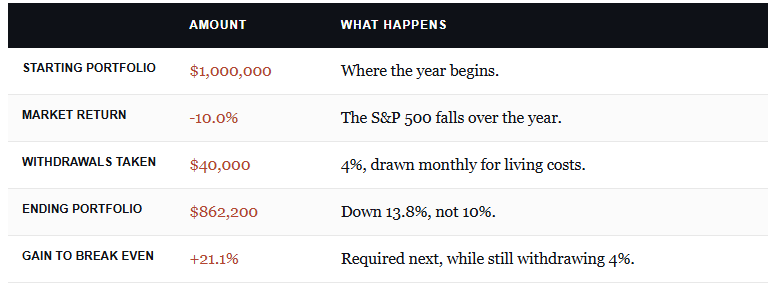
To make this a bit clearer, let’s build a simplistic example and walk through a single year. For argument’s sake, we will assume a retiree starts with $1 million, and the market falls 10%. Simultaneously, they also withdraw the 4% needed for living expenses across the twelve months. This is simple math, right?
However, at the end of the year, the portfolio didn’t go down just 10%. It ended down almost 14% because those withdrawals came from a shrinking base. For that retiree to climb back to a million, over the next year, while they keep spending, the market can’t just return 14%; it has to return 21%. The sequence of return risk turns an ordinary 10% decline into a 21% problem.
Now Add The Tax Collector
Wait, it gets worse. For most of the “free advice” that is given, most overlook the one person everyone hates: the “tax collector.” The “4% rule” is a pre-tax number, since Bengen assumed a tax-free account to keep the math clean. Real retirees rarely have that luxury. Need $40,000 to live on and pull it from a traditional IRA, and every dollar is ordinary income, so the gross withdrawal must be larger to net the same spendable amount. A 4% lifestyle funded from an IRA is really a 5% draw on the portfolio once you account for a 20% effective tax rate. Even if you are drawing from a taxable account, your capital gains, dividends, and income are all taxed as well. That bigger draw is what the portfolio feels, pulling the depletion date forward by years.
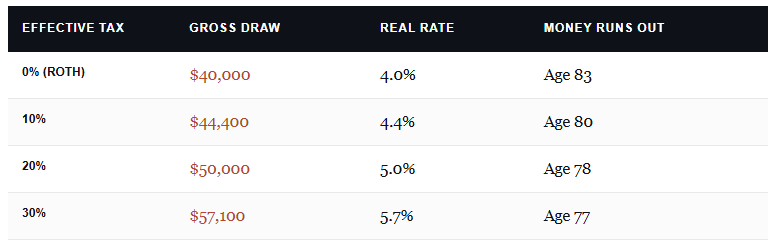
Of course, income tax brackets, state taxes, Social Security taxes, and Medicare surcharges will all impact outcomes. Such is why account types become an important factor in retirement planning. While a Roth IRA changes nothing, a taxable account is gentler as only the gains, dividends, and interest income are taxed. However, a traditional IRA, or retirement plan, taxes every withdrawal at the individual’s tax bracket. While the overall point survives the details, the headline rate understates what the portfolio must fund, and sequence risk feeds on the difference.
Here is the takeaway from this discussion.
“You can’t control when the bad years arrive. You can control whether they find you fully exposed and dependent on selling into them.”
“Markets Always Recover” Misses The Point For Retirees
Over long time horizons, the U.S. market has always recovered from declines and bear markets. For individuals who bolted into cash in a panic, they missed the sharpest rebound days. Unfortunately, those 10 best days tend to cluster within the market’s worst stretches. Therefore, for a 35-year-old with decades of contributions still ahead, “just ride it out” is close to the correct prescription. For a 65-year-old, it is a different story.
While the general belief is that markets “always recover,” there is an unrealized impact in the “waiting.” The market took roughly 13 years to reclaim its 2000 peak in real (inflation-adjusted) terms. For a 35-year-old who was dollar-cost-averaging, the 13-year wait proved beneficial, as it allowed accumulation of shares at lower prices. However, for that 65-year-old drawing income, the effect was the opposite. Every withdrawal during that was capital that never healed. “Ride it out” quietly assumes you aren’t spending the portfolio while you ride.
Okay, let’s put some real numbers to it. According to the life expectancy table, a 65-year-old lives about 19 more years, to roughly 84. The portfolio has to survive whatever sequence the market hands you. Below, a retiree takes a severe early loss and draws the standard 4% through it, against the same market left fully invested.
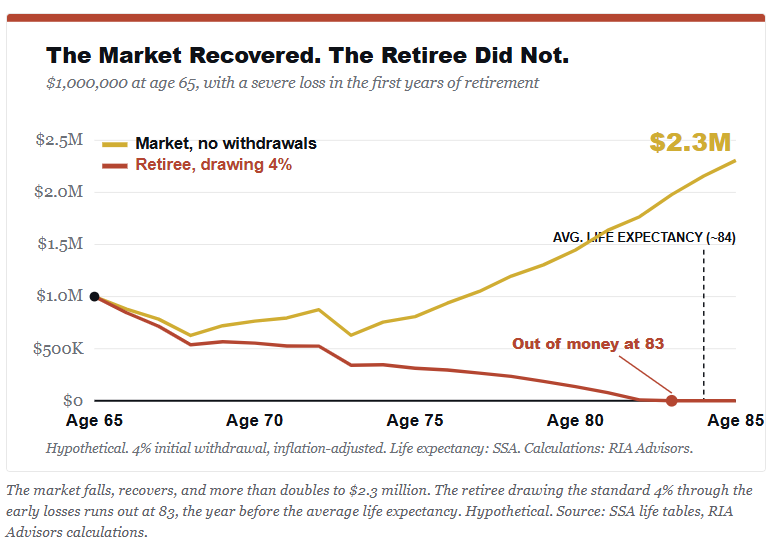
Here is the truth: “the market does exactly what the optimists promise.” It drops, recovers, and climbs to new highs in a repeatable cycle. However, the retiree who drew income through the early losses never gets back to where he started. Their principal hits zero at 83, the year before the average 65-year-old is expected to die, on the same market that made a patient buy-and-hold investor wealthy. And this is the disciplined case, the celebrated 4%, and not a penny more. Same market, same 4% rule, and one of them still ran out of money. That is the gap “just ride it out” refuses to see.
This is usually where I get a fair objection to this analysis:
“But, if you sell, you’ll miss the recovery.”
True, if you’re still a saver. However, it is a very different calculation once you’re living off the balance. I’ve written before about when a retiree should actually reduce exposure, and the point isn’t calling the top. It’s that sequence of return risk breaks the “ride it out” script for anyone in the withdrawal phase.

Rules Of Engagement For The Sequence Of Return Risk
So, all of this analysis brings us to the most important facet of managing your portfolio: the core discipline and financial planning practice at RIA Advisors.
We understand that you can’t forecast the sequence of returns, but we CAN build a plan that survives a bad one. As Howard Marks puts it, you can’t predict, but you can prepare. These are the rules of engagement once you’ve crossed from saving into spending.
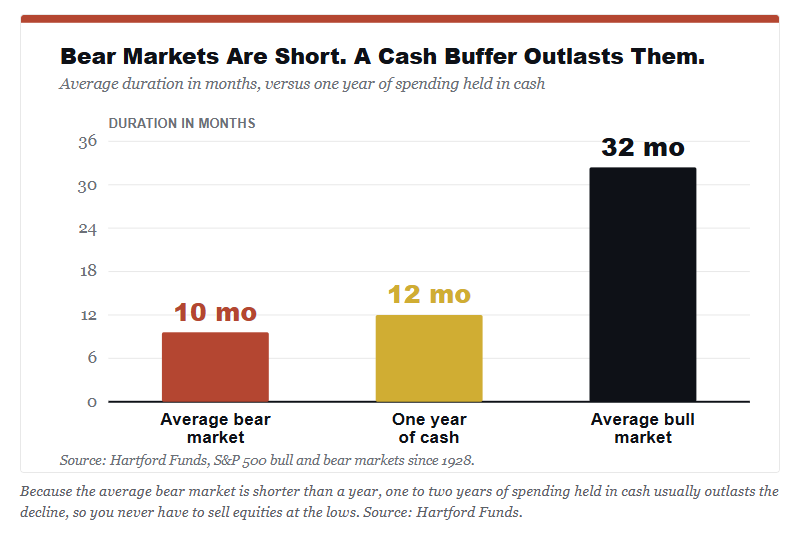
1) Hold one to two years of spending in cash or short-term bonds. Most bear markets are short, with the average one lasting under a year, compared with bull markets that run for years. A cash reserve means that WHEN the market drops, you spend from cash instead of selling stocks at the bottom. You refill once prices recover. The cost is a little cash drag in a roaring bull, a price worth paying to never be a forced seller.
2) Manage the drawdown itself. The process of avoiding a deep loss matters more in the withdrawal phase than catching the last leg of a rally. Maintaining a risk management process that trims exposure as risk increases keeps a 20% decline from growing into a 40% one. I’ve discussed previously that keeping losses small is the majority of the job.
3) Set your starting withdrawal rate to the conditions at the start. If you are retiring into an expensive market, start with a withdrawal rate closer to 3%-3.5% than 4%. That is Pfau’s direct prescription, where a slightly leaner start costs far less than running out of money at 84.
4) Mind the tax drag. The gap between after-tax income needs and pre-tax withdrawals determines whether a plan survives. Consider spreading withdrawals across taxable, tax-deferred, and Roth accounts, and opt for Roth IRA conversions in low-income years. Taking steps to lower the effective rate the portfolio must fund is one of the few levers you control.
5) Stay flexible on spending. The “guardrails” approach from Jonathan Guyton and William Klinger trims withdrawals after bad years and lifts them after good ones. (This is why we recommend having a security cushion.) Implementing a small, temporary spending cut early in a downturn does enormous work by halting the depletion spiral before it builds momentum. Research suggests flexibility alone can support a higher starting rate than a rigid plan.
6) Implement a rising equity glide path, or “bond tent.” This process suggests carrying more bonds in the portfolio during the early stages of retirement when the sequence-of-returns risk is highest. Over time, let overall equity exposure drift higher as the danger fades. Pfau and Kitces showed that this defuses the first decade, the one that matters most.
7) Separate your essentials from the market. Consider covering basic living needs with reliable income sources, such as Social Security and, if you have one, a pension. If there is still a gap between that income and spending needs, an annuity may be an option. Crucially, that reliable income stream allows the portfolio to fund only the discretionary layer, where spending can be more flexible. When your groceries don’t depend on the S&P 500, a bad sequence becomes a mild discomfort, not a catastrophe.
Sequence Of Return Risk: Frequently Asked Questions
What is the sequence of return risk?
Sequence of return risk is the risk that weak returns occur early in retirement, while you are withdrawing income. Selling shares into a decline locks in losses that those shares never recover from, so two retirees with the same average return can end up in very different places based solely on the order in which the returns arrived.
Why does the sequence of return risk only matter once you retire?
While you are saving, you are adding money and effectively buying the dips. In that environment, the order of returns matters much less. However, once the cycle shifts from accumulation to withdrawals, a bad early stretch forces you to sell into weakness. Wade Pfau has estimated that the first ten years drive roughly 77% of the final outcome.
Does the 4% rule protect against sequence-of-returns risk?
While the 4% is widely accepted, in reality, it is only part of the solution. The 4% rule survived history’s worst 30-year sequences, but that withdrawal rate has two flaws: 1) it is a pre-tax number, and 2) it provides no guarantees. High starting valuations, a severe early loss, or taxes that turn a 4% lifestyle into a 5% draw from an IRA can still empty a portfolio.
How much cash should a retiree keep for sequence risk?
For most people, holding one to two years of spending in cash or short-term bonds is a reasonable buffer. Most bear markets are shorter than that, so you can spend from cash instead of selling stocks at the bottom, then refill the reserve once prices recover.
How do starting valuations change a safe withdrawal rate?
Higher valuations have historically meant weaker returns over the following decade, which is exactly when a new retiree is most exposed. Pfau and Kitces found that the safe rate moves with the CAPE ratio at retirement. When valuations are rich, starting nearer 3% to 3.5% buys a margin of safety.

Sources & Notes
- Bengen, William P. “Determining Withdrawal Rates Using Historical Data.” Journal of Financial Planning, 1994. Origin of the 4% rule and the SAFEMAX concept.
- Cooley, Hubbard, and Walz. “Retirement Savings: Choosing a Withdrawal Rate That Is Sustainable.” AAII Journal, 1998 (the Trinity Study).
- Pfau, Wade D. “Can We Predict the Sustainable Withdrawal Rate for New Retirees?” Journal of Financial Planning, 2011, and related work on valuation-based withdrawal rates. retirementresearcher.com.
- Kitces, Michael. Analysis of sequence-of-returns risk and risk-based spending guardrails. kitces.com.
- Guyton, Jonathan, and William Klinger. “Decision Rules and Maximum Initial Withdrawal Rates.” Journal of Financial Planning, 2006 (the guardrails framework).
- CAPE and forward-return figures computed by RIA Advisors from the Robert J. Shiller monthly dataset, S&P Composite, start months 1881 to 2013. shillerdata.com. Shiller prices are monthly averages, so computed returns run modestly off exact figures, but the valuation-to-return relationship holds up well.
- Bear and bull market duration data: Hartford Funds, S&P 500 since 1928. Average figures vary by source and definition, with Yardeni Research reporting roughly 11 months for the average bear. All of them agree that bears are far shorter than bulls.
- Life expectancy at 65: Social Security Administration Period Life Table, 2023, as used in the 2026 Trustees Report. A 65-year-old man averages about 17.5 more years, and a 65-year-old woman about 20.1 more years. The retiree-versus-market chart is hypothetical, assuming a $1,000,000 starting balance, a 4% initial withdrawal rate adjusted to 3.5% annually for inflation, and a severe early-loss sequence.
- Tax figures are illustrative. They assume a $40,000 net lifestyle drawn from a traditional IRA on a $1,000,000 balance, grossed up at the stated effective tax rate, using the same hypothetical return sequence as the chart. Effective rates vary by bracket, state, Social Security taxation, and Medicare (IRMAA) surcharges. Roth and taxable accounts are taxed differently and generally have lighter tax burdens.
Further Reading
- Lance Roberts, “Risk Management For Retirees: When To Reduce Exposure.”
- Lance Roberts, “Portfolio Risk Management: Accepting The Hard Truth.”
- Lance Roberts, “CAPE-5: A Different Measure Of Valuation.”
- Lance Roberts, “Lower Forward Returns Are A High Probability Event.”
- Lance Roberts, “The Best Measure Of Future Stock Market Returns.”