
Over the past six months, the 10-year Treasury yield rose by nearly a full percentage point, and REITs (Real Estate Investment Trusts) paid the price. XLRE, the State Street Real Estate ETF, was essentially flat, whereas the S&P 500 gained 18%. Clearly, higher yields are influencing REIT prices more than equity performance; thus, our question is: are REITS a good equity sector to buy if you think yields have peaked and will decline? To assess this, we looked at the correlations of XLRE’s top holdings to 2yr, 5yr, and 10yr Treasury yields. We also considered the recent relative performance to the S&P 500 and the REITs’ respective subsectors.
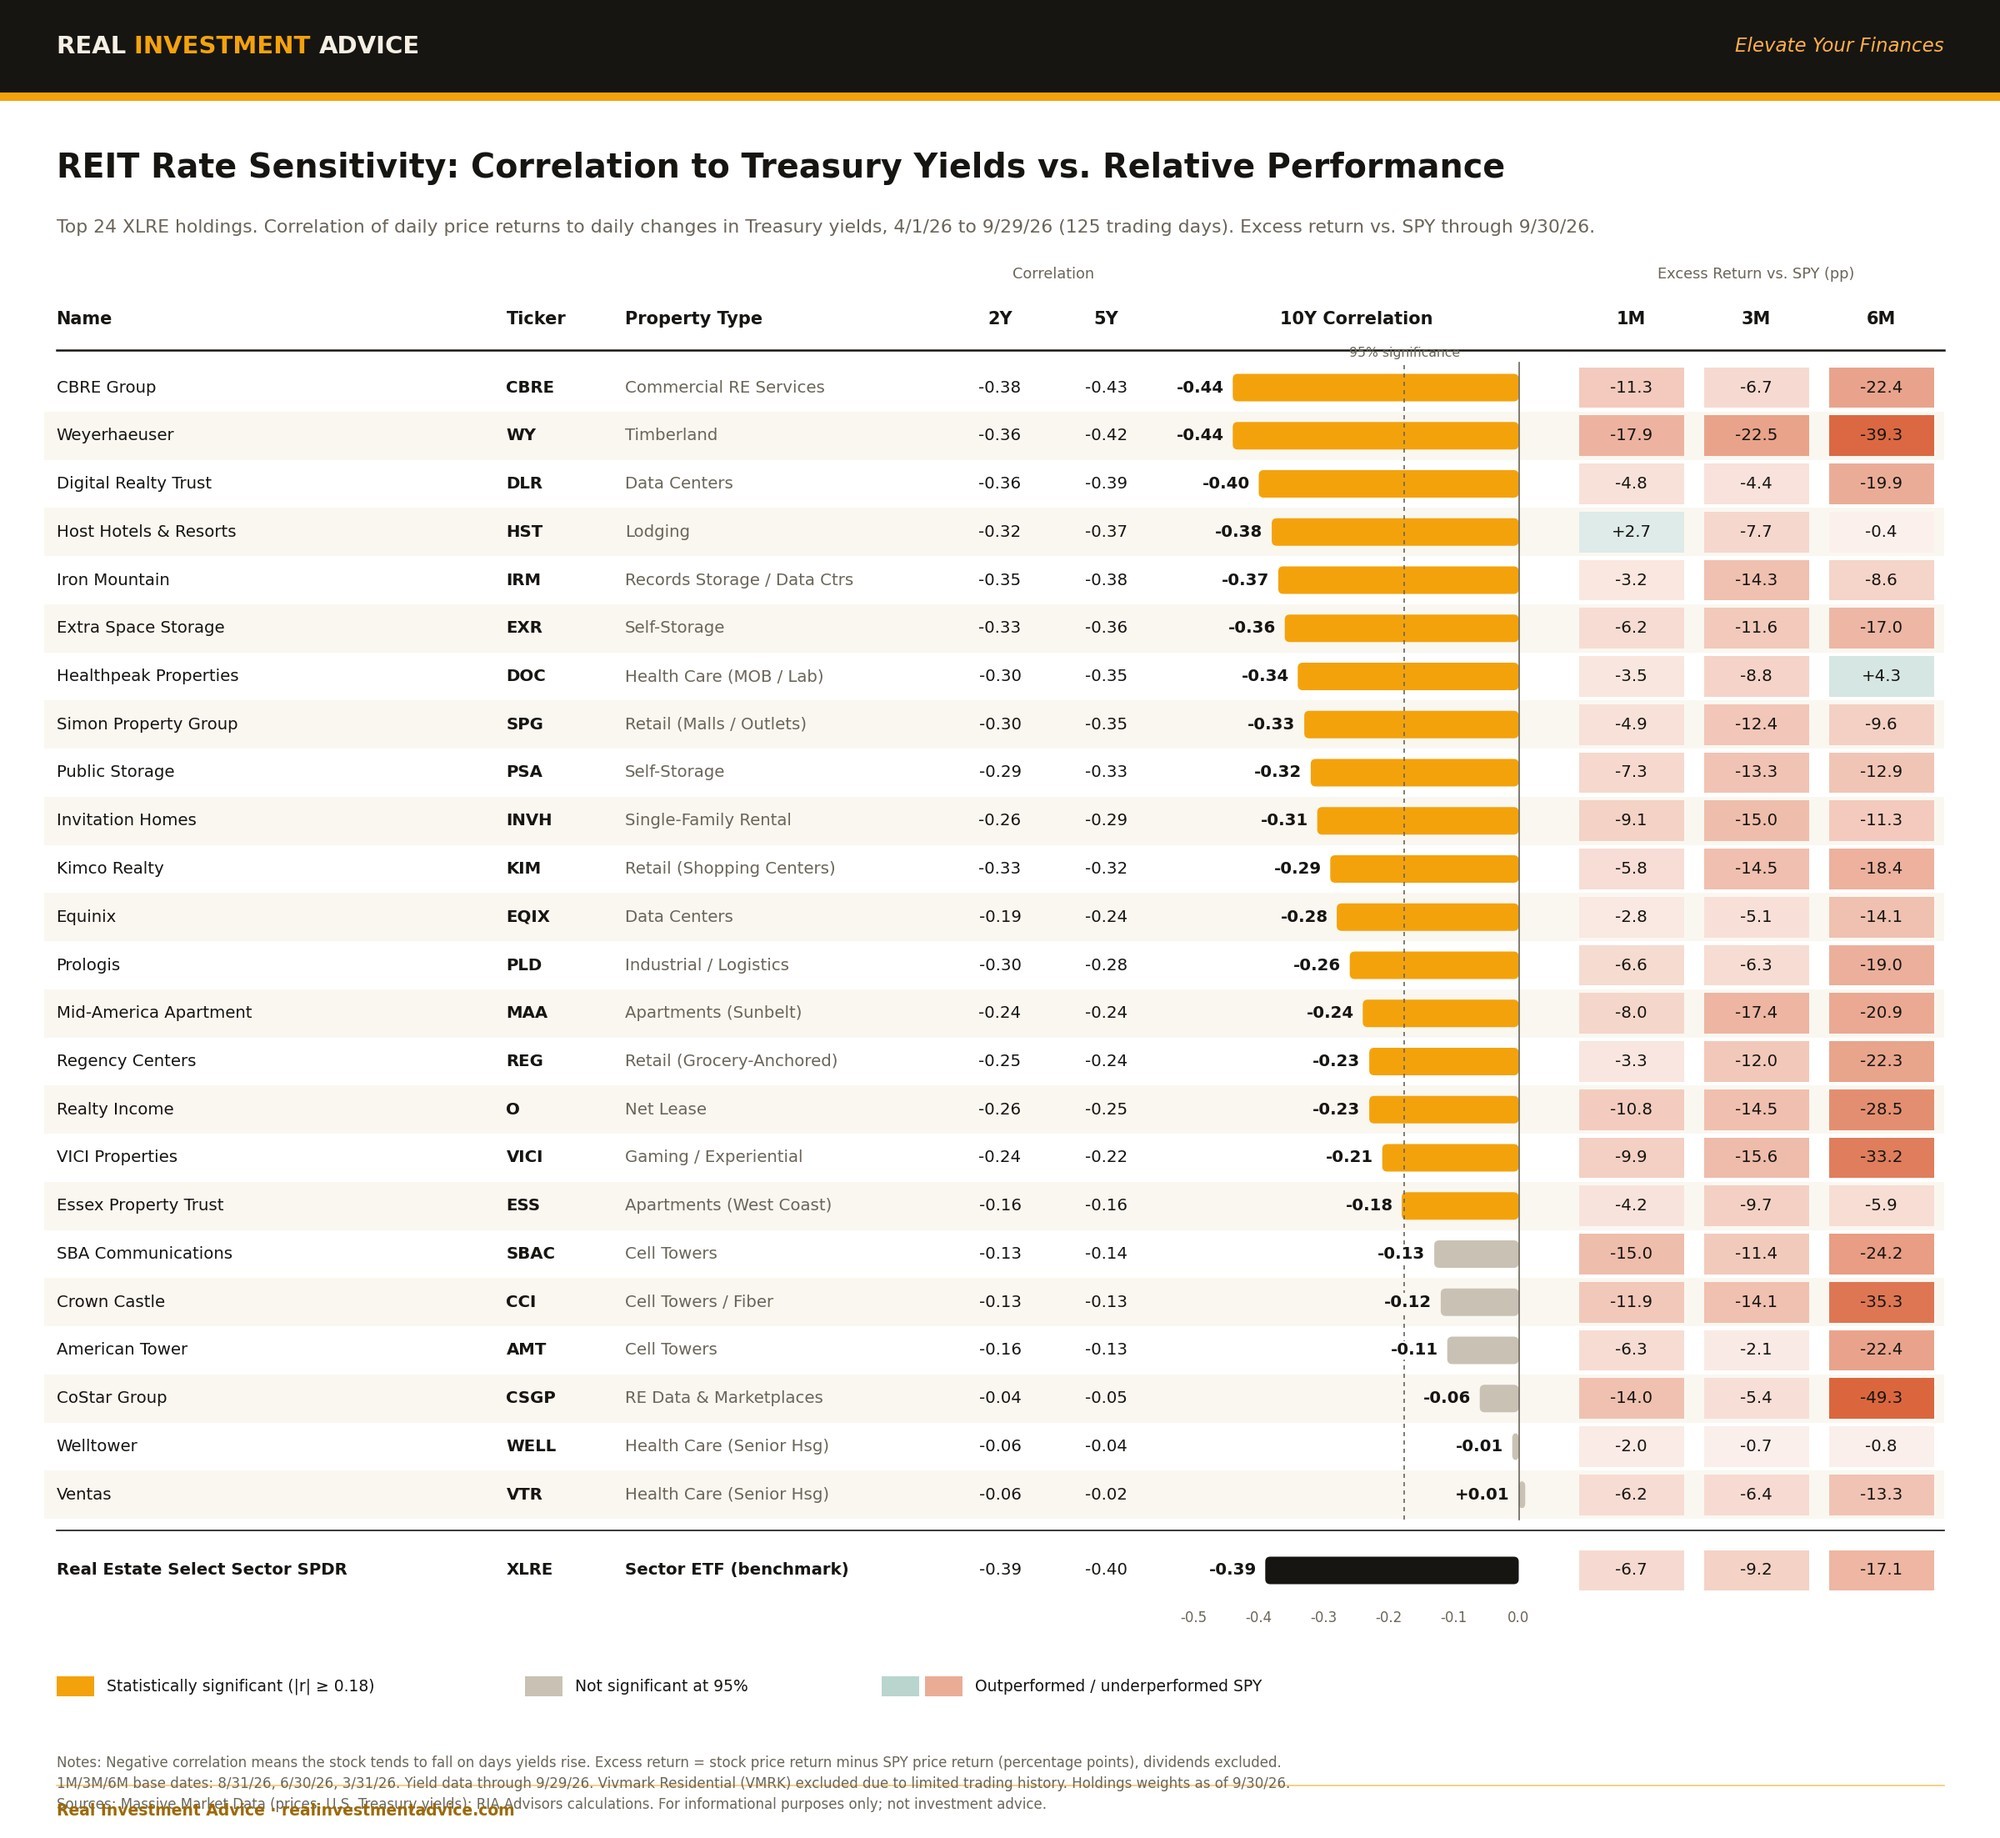
The broad takeaway is that while it’s easy to blame the surge in bond yields for the poor performance, rate sensitivity isn’t uniform across the stocks we analyzed, and other factors matter. Here are a few takeaways from the table summarizing our findings, as shown in the graphic.
- XLRE’s correlation to daily yield changes was -0.39.
- The most rate-sensitive names did not have the most negative correlation to yield changes. To wit, Weyerhaeuser, Digital Realty, and Host Hotels, which are economically cyclical businesses, were among those with the highest negative correlations.
- Host Hotels tracked the S&P 500 despite its high negative correlation.
- Welltower and Ventas, the senior housing REITs that make up roughly 16% of XLRE, showed no meaningful link to yields. Healthpeak Properties was the only holding to beat SPY over six months, while Welltower and Host Hotels were close.
- Cell tower REITs and CoStar (data) also had weak correlations, yet they were among the worst performers. Their struggles appear tied to industry and company fundamentals rather than rates.
- Net lease firms, like Realty Income and VICI, had modest daily correlations but trailed SPY by 28 to 33 points. Their margins are under pressure from rising funding costs, but long-term fixed rents largely remain stable.
Rates matter for REITs, but they explain only part of the price action. With most correlations ranging between -0.2 and -0.4, which explains some of the negative performance, property type, growth, and balance sheets also drove performance divergence within the sector.
What To Watch Today
Earnings

Economy

Market Trading Update
Yesterday, we walked through the Russell 2000 short-squeeze setup, noting that small caps were the likeliest first stop for any squeeze. Today, I want to check the market breadth signals across the rest of the tape. Is the “broadening” finally reaching the beaten-down sectors of real estate, health care, financials, and utilities?
Start with the headline. The S&P 500 closed Tuesday at 7,819, its first close above 7,800 and a fresh record. Yet fewer than a third of its members trade above their 50-day moving average, depending on whose count you use. That’s a record standing on very few shoulders.
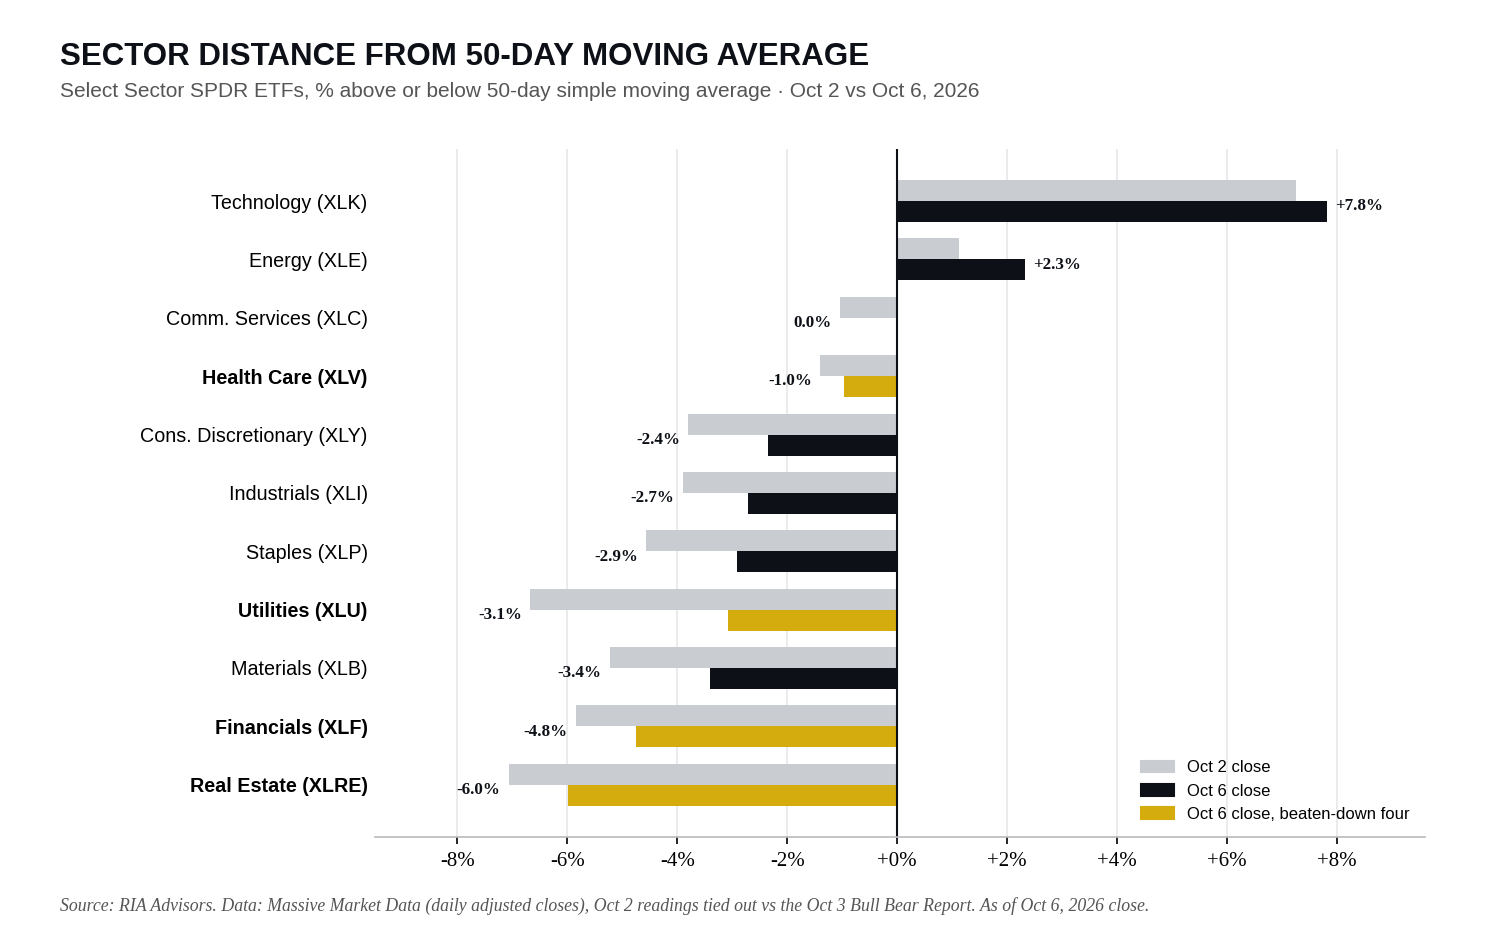
Now for the improvement. In Saturday’s Bull Bear Report, only technology and energy sat above their 50-day averages. Real estate was 7.1% below its line, utilities 6.7%, and financials nearly 6%. By Tuesday’s close, all four laggards had narrowed that gap. Utilities did the heavy lifting, rallying 3.3% in two sessions to cut the deficit to 3.1%. Health care sits just 1% below its average, the closest to a reclaim.
Notice in the composite chart below how stretched the selling got. The equal-weight blend of the four closed below its lower 2 SD band three times in September. Its RSI fell to 22 on Oct. 1, the deepest oversold reading since the April 2025 tariff low. It’s since recovered to 39.
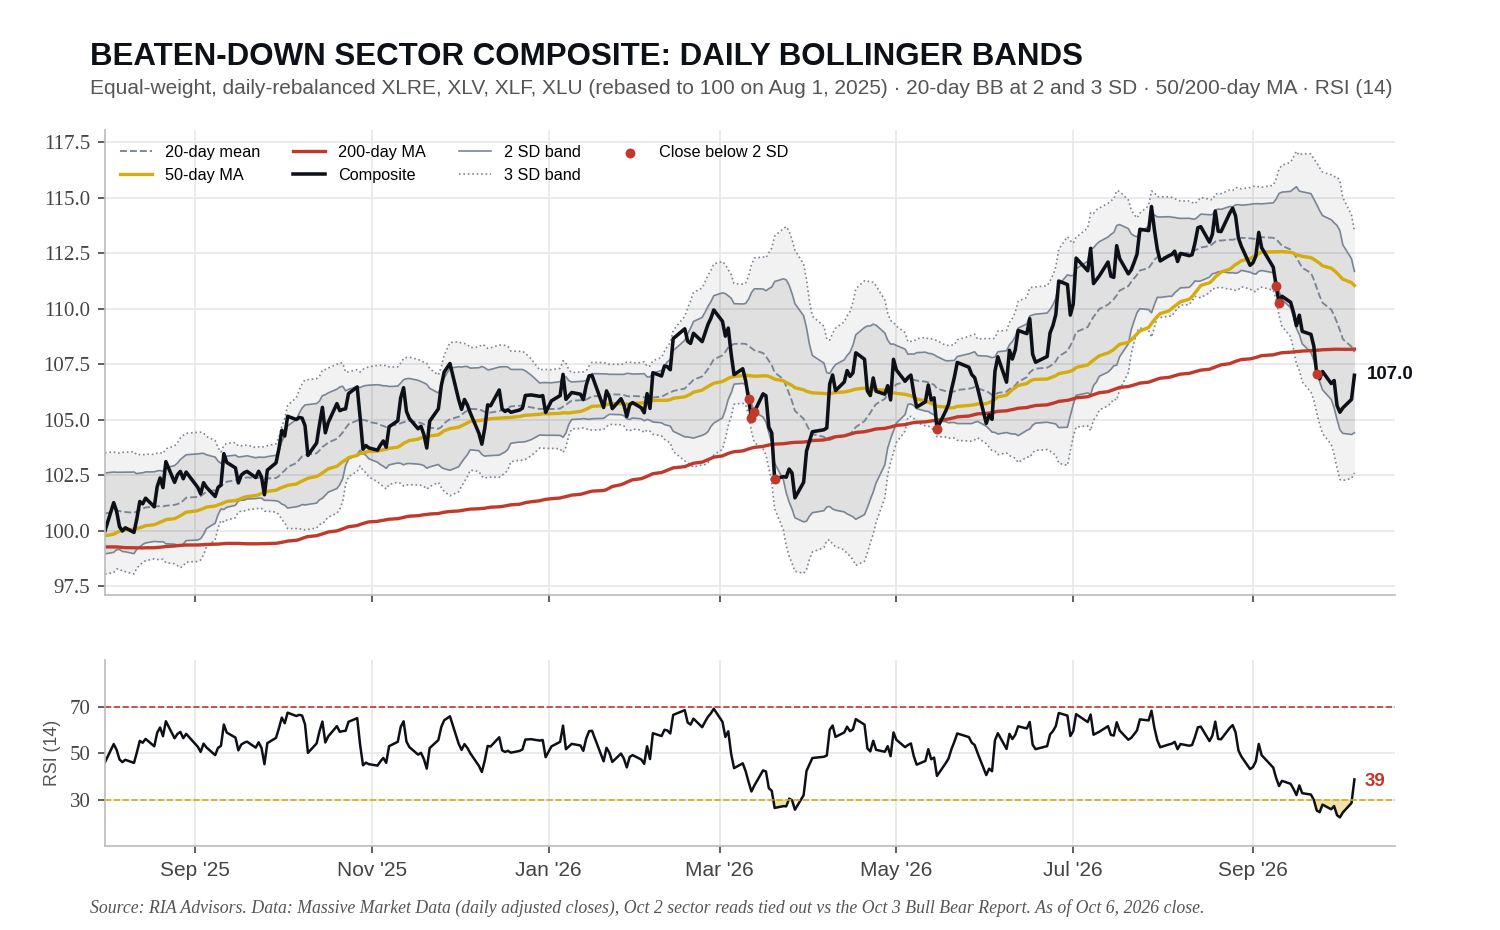
But a bounce is NOT a trend change. The composite still sits 3.6% below a falling 50-day average and 1.1% below its 200-day average. The broader tell hasn’t moved either. The ratio of equal-weight to cap-weight S&P 500 is down 4.3% since June 30 and flat since Friday. Such is the nature of a narrow market. The laggards bounced, but so did the leaders.
“So you’re saying the rotation is dead money?” Not quite. Bob Farrell’s Rule #7 says markets are strongest when they’re broad and weakest when they narrow to a handful of names. Breadth doesn’t have to be good for the rally to continue, but it has to improve for the rally to last. The swing factor remains rates. With the 10-year near 5.26%, these sectors need a move back below 5%, and today’s 30-year auction is the next test.
In the ETF Sector Rotation Model, we aren’t chasing the bounce. Health care is first in line on a close above its 50-day average. Utilities and financials need the composite back above its 200-day and the equal-weight ratio turning higher. Meanwhile, technology sits 7.8% above its 50-day, so trimming it back to target weight funds the rotation before it shows up. Let the laggards prove it, and keep stops where they belong.
Cheap can always get cheaper. It usually waits until you’ve bought.

NVDA Booms While Breadth Continues To Narrow
Nvidia set all-time highs Tuesday, and its market value is quickly approaching $6 trillion. The S&P 500 also set a record, closing above 7,800 for the first time. While both make for positive headlines for the stock market, neither says much about what’s happening to the broader market
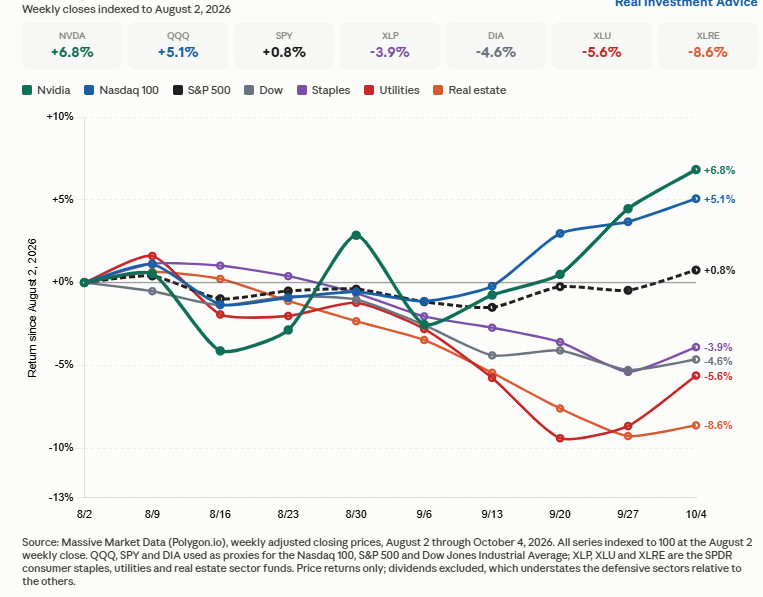
Since the start of August, Nvidia has gained nearly 7%, with the Nasdaq closely following. The S&P 500 is up slightly, balancing gains in technology stocks with weakness across many other sectors. The graph below shows stark divergences in returns since August 1, 2026, with many interest rate-sensitive sectors, like REITs, down moderately. While we led today’s Commentary analysis of REITS, some of the sectors shown below and others not shown are due for a period of outperformance versus the market, but that may not occur before stability and possibly lower yields can be had in the bond market. Such may have to wait for some sort of peace agreement with Iran.
Worried Consumers Keep Spending: Here’s Why
For nearly four years, economists have been predicting that consumers would fail the economy. To their point, sustained high inflation, the fastest Fed tightening cycle in decades, and more recently, surging gasoline prices and interest rates should be taking a toll on consumer spending.
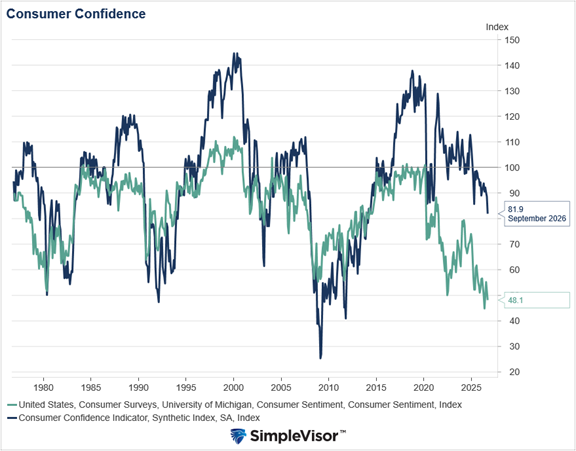
In some respects, those and other factors are weighing on the consumer’s mind. As we share below, the University of Michigan Consumer Sentiment gauge sits at a 50-year low, and the less politically biased Conference Board Consumer Confidence Index is down to 2014 levels.
Yet despite many reasons for consumers to retrench, real personal consumption expenditures (PCE) grew 2.6% through September.
To better understand this resilience, we built a Consumer Health Index. The index combines income, labor, credit, spending, and price data that should explain how much consumers can afford to spend. We then compare our index to PCE, or what consumers have actually spent. The gaps between the two tell an important story about where spending power is coming from and how durable it may be.

Tweet of the Day
Trading Rules With Desktop Printout
“Want to achieve better long-term success in managing your portfolio? Here are our 15-trading rules for managing market risks.”
Please subscribe to the daily commentary to receive these updates every morning before the opening bell.
If you found this blog useful, please send it to someone else, share it on social media, or contact us to set up a meeting.