
“Think Like An Investor” is chapter 1 of a 5-part series examining the narratives around “investing for the long run.”
Chapter 1: Think Like An Investor
Chapter 2: Investor Psychology
Chapter 3: Why Crashes, Timing & Valuations Matter
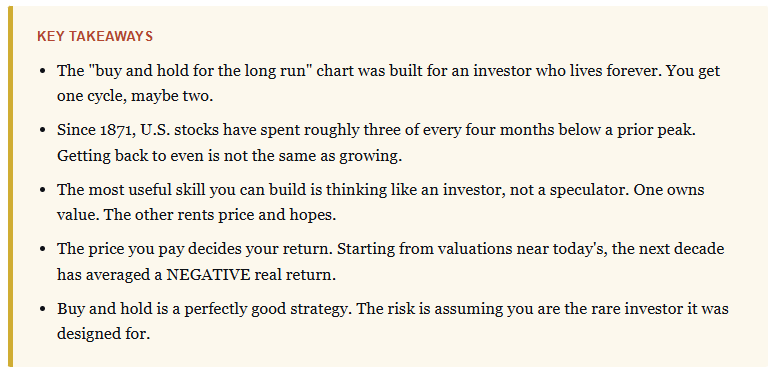
There is a chart that lands in your feed every few months. It plots a single dollar dropped into the stock market a century ago, which has grown into a small fortune. The caption never changes. Just buy and hold. Time in the market beats timing the market. It looks airtight, and honestly, most of it is true.
However, there is a catch: nobody prints underneath it. That chart was built for an investor who does not exist. If you want to actually build wealth instead of just admiring the math on someone else’s timeline, you have to learn to think like an investor first, and almost nobody explains what that means before they hand you the chart and wish you luck.

This is the starting point, and it’s not with a stock tip, not with a hot sector, not with the app that promises commission-free riches. Let’s start with the one mental shift that separates the people who keep their money from the people who donate it to the market in waves. It costs nothing, takes about 10 minutes to understand, and will save you from most of the expensive mistakes waiting for you.
The “Stocks For The Long Run” Promise Has A Catch
Let me be fair to the promise, because it is not a lie. Over the last 126 years, U.S. stocks have gone up and to the right. Anyone who tells you the market does not reward patient owners of good businesses is selling you something worse. The long-run story is real, and I am not here to talk you out of owning stocks.
But look closer at what that beautiful chart quietly assumes about you. It assumes that you:
- Have 126 years to invest
- Never sell and never panic, and
- Never need the money at an inconvenient moment.
- It also assumes you happened to start buying at a reasonable price rather than an expensive one.
Four assumptions, and each one of them is wrong for a real human being with a job, a mortgage, a couple of kids, and a retirement date that does not move.
Strip those assumptions away, and the airtight chart springs a leak. Not because the market failed anyone, but because the market on the poster and the market you actually live through are two very different animals. One is a smooth exponential curve. The other is the thing that gave your parents gray hair in 2008.
The Catch: You Don’t Get The 126-Year Average
Here is the reality nobody puts in the brochure. You are not investing for 126 years. Most people do not start saving seriously until their mid-thirties, and they need the money by their sixties. That is one market cycle. Two if you are lucky and disciplined. So the average return of the last century is a fine piece of trivia, but it is not the return you get to spend.
Here is that same dollar and that same century from the top of this article, with one thing added back in. The cost.
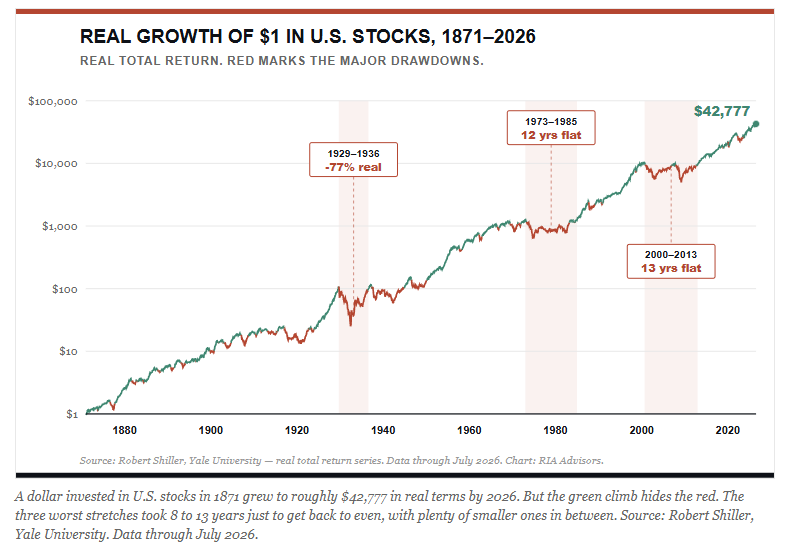
Notice how much of it is red in the chart above. Since 1871, U.S. stocks have spent roughly three of every four months below a prior peak. Three of every four. The green climb is real, but you spend most of your investing life inside the red, grinding back toward a high-water mark you already touched once before and lost.
Andrew Lo, the MIT economist, put it better than I can.
“A river with an average depth of five feet can still drown a six-foot hiker who cannot swim. The average is comforting. The average is also irrelevant if you go under in the deep part.”
Markets have plenty of deep parts, and they do not schedule them around your retirement party.
This is a point I keep coming back to, most recently in a piece called “My Favorite Chart Doesn’t Tell You 3 Things.” Markets grow your money over time. They do not compound it.
Those sound identical, and they are not. Compounding assumes one thing above all else, and that is you never take a large loss along the way. Read that twice, because it is the whole ballgame. Compound returns assume no principal loss, EVER, and the market has never once signed that contract.
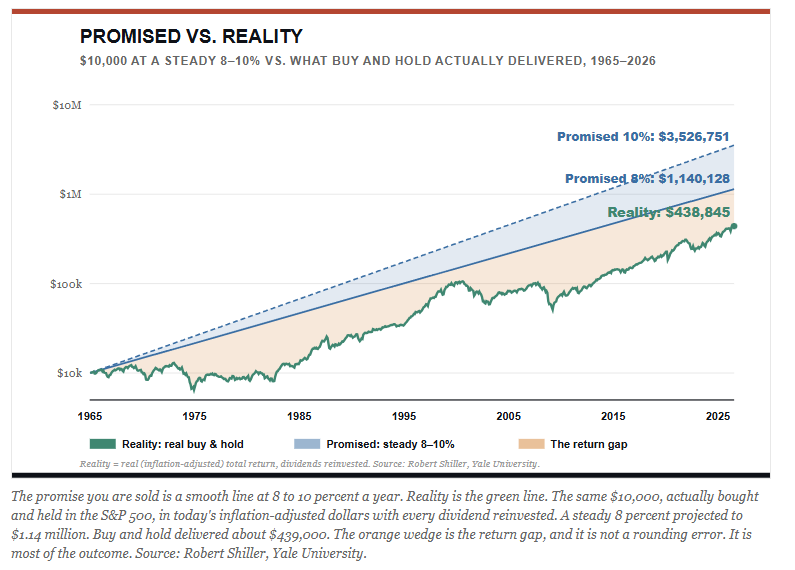
Notice the enormous gap between “what is promised” and “reality.” That gap is what the marketing pitch leaves out. The media quotes that you will average 8-10% over time, which is measured before inflation. They then show you this smooth growth line that no market has ever walked.
As shown, what you actually keep after going through the drawdowns, instead of skipping over them, is a fraction of the projection. This isn’t because anyone lied to you, but an average is a promise the future never agreed to.
Look at what the chart calls the lost decade. An investor who put money in around the 2000 peak did not get back to even, in real terms, until roughly 2013. That is 13 years of biology, of aging, of a retirement date getting closer, spent recovering ground you had already covered.
Getting back to even is not growth. It is the absence of loss that is wearing a costume. If you were 45 years old in 2000 and did everything the poster told you to do, the math did not work out the way it promised.

Learn To Think Like An Investor, Not A Speculator
So if the long-run chart is a trap for real people, what is the fix? It starts with a distinction almost nobody teaches on day one, and it is the single most useful idea in this entire series. There is a difference between an investor and a speculator, and knowing which one you are at any given moment is worth more than any tip your brother-in-law will ever give you at Thanksgiving.
Here is the specific difference.
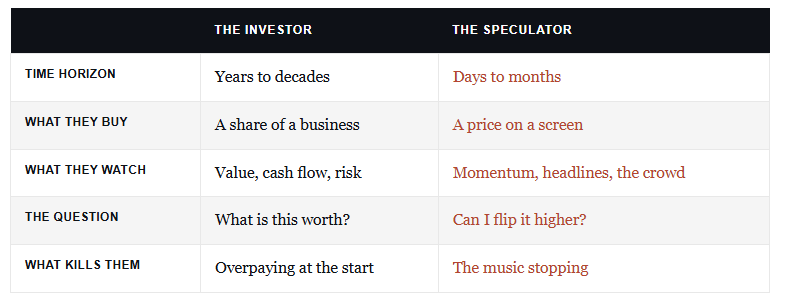
- An investor buys a stake in a real business at a sensible price, cares about what that business is actually worth, and manages the risk of being wrong.
- A speculator buys a ticker symbol because he believes he can sell it to someone else at a higher price later. That is the whole difference. One is buying value. The other is renting price and praying the music keeps playing.
Now, I am not throwing rocks at speculators. Speculating is not a sin, and plenty of smart people do it on purpose, with money they can afford to lose, fully aware of the game they are playing. That is fine. The danger is not speculation, but rather telling yourself you are a long-term investor when you are actually speculating. This is because you expect the safety of the first but take the risk of the second. That is the trap.
In the 2020s, speculation lives more than ever, and you’ve seen it. From the latest meme stocks your co-worker tripled his money on, to the crypto coin your nephew swears is different this time, or the latest 0DTE options trade. That is speculation wearing an investor’s coat.
A good example is the Betterment 2026 survey of 1,000 retail investors, and the answers from Gen Z are revealing.
- A full 52% of the youngest investors said they took money they had originally set aside for investing and moved it straight into sports betting over the previous 12 months.
That alone is a story, but the next number is the one that matters.
- Fully 26% of Gen Z now describe sports betting as a deliberate part of their “long-term financial strategy.”
Read that again and realize that a quarter of young investors have taken an activity built on point spreads and parlays and filed it in the same drawer as the retirement account. That is pure speculation, not even remotely disguised as investing.

In the chart above, notice how fast that number falls as you move up the age brackets. That should not be surprising, as both Gen X and Boomers have already survived two bear market cycles. The less market history you have lived through, the easier it becomes to mistake speculation for an investment.
However, here is the part that the headline skipped. That same research found 80% of the Gen Z crowd reaching for these bets said they are doing it because they feel financially behind, and see gambling as a faster road to their goals than the slow way.
That is the most critical point, as they are not speculating for fun with money they can afford to lose. They are speculating out of fear, with money they cannot afford to lose, and calling it a plan. That is the exact trap Graham and Dodd drew 90 years ago, playing out in real time on a phone.
Does the math rescue them? No. A five-year study from UC San Diego tracked more than 700,000 online gamblers and found that 96% of them LOST money over the period. So a quarter of a generation is quietly building part of its financial future on the one activity where the operator has already told you, in writing, exactly how the story ends.
Bob Farrell, who watched markets for half a century at Merrill Lynch, wrote it into his rules decades ago.
“The public buys the most at the top and the least at the bottom.“
When speculators dress up as investors, that is how that rule keeps coming true, cycle after cycle, generation after generation.
The Margin Of Safety
This is not some idea I cooked up on a slow afternoon. The greatest investors who ever lived spent their careers drawing this exact line, and they put it in writing. Benjamin Graham and David Dodd defined it in 1934 in Security Analysis, and the definition has never needed updating.
“A real investment, after honest analysis, promises the safety of your principal and a satisfactory return. Anything that cannot clear that bar is speculation.”
Phillip Carret, writing four years earlier in The Art of Speculation, drew the same line from the other side.
“The investor cares about the economics of the business. The speculator cares only about the price.”
When the whole crowd pays any price at all because “this time is different,” they are leaning on what gets politely called the greater fool theory. The belief that it does not matter what you overpay, because a bigger fool will always turn up to take it off your hands for more. It works right up until the day it doesn’t, and whoever is holding when the fools run out eats the entire loss.
I pulled together how the legends thought about this in Speculator Or Investor: 10 Rules From Legendary Investors, and the striking part is how they all land in the same place.
Jeremy Grantham warns that you get punished, not paid, for buying expensive risk. James Montier says valuation is to markets what gravity is to everything else. Different words, one message. What you pay decides what you get, and gravity always collects.
So how does an investor avoid falling into the speculation trap? Graham answered it in three words that Warren Buffett still calls a cornerstone. Margin of safety. You buy a dollar of value for fifty cents, so that even when you are wrong, and sooner or later you will be, there is a cushion between the price you paid and the damage you can survive.
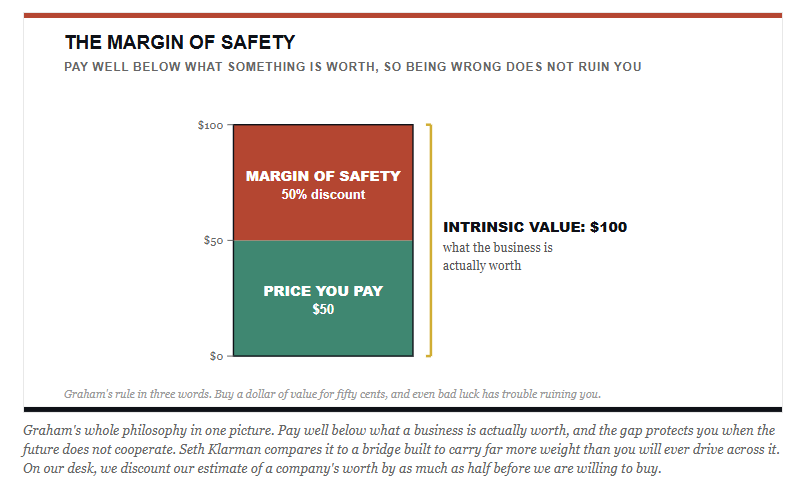
And here is the discipline almost nobody has the stomach for. When nothing is trading at a sensible price, the correct move is to do nothing. Jesse Felder put it perfectly. The hardest thing in this business is to sit on your hands, because inaction feels passive and every instinct screams at you to be DOING something.
But when no opportunity clears the bar, patience is not laziness. It is the most proactive decision you can make. I wrote about this at length recently in “Value, Margin Of Safety, And The Art Of Doing Nothing.” Cash is a position. Waiting is a strategy. Overpaying because you got bored, or because your neighbor is bragging at the barbecue, is exactly how speculators get made.

The Two Questions That Decide Everything
Great, you have made it this far, and once you accept that you get one cycle and that your job is to invest rather than speculate, almost every decision collapses down to two questions. Get these right, and you can ignore the vast majority of the noise. Get them wrong, and no amount of clever stock picking will save you.
The first question is simple. What price are you paying? Valuations at the moment you start matter enormously, because what you pay for a future stream of earnings sets the return you can reasonably expect to earn from it. Pay a high price, and you are pre-committing to a low future return. This is not my opinion. It is arithmetic, and the historical record is about as one-sided as anything you will ever see in markets.
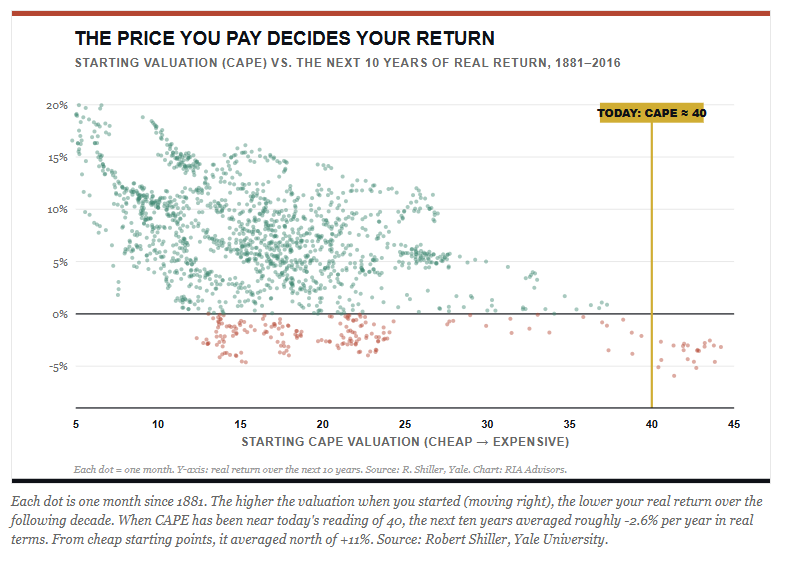
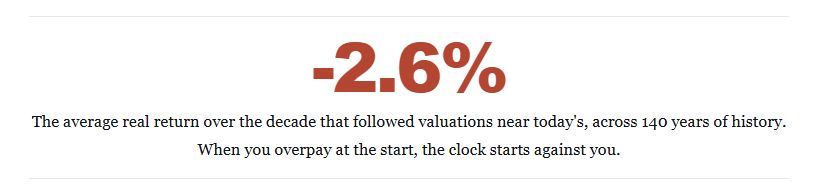
Look closely at the chart above and notice that the cloud of dots slopes down and to the right, and it is not subtle. When stocks were expensive, the next decade took its pound of flesh. The gold line marks where we stand today, with CAPE near 40. Every prior time valuations lived up in that neighborhood, the following ten years delivered a NEGATIVE real return on average. Not a crash necessarily. Just a long, quiet decade of your money running to stand still.
The second question is the one everybody skips, but it is the most critical. How much time do you actually have? This is where the “should I just go all in on stocks” debate usually falls apart.
I wrote a whole piece asking whether Millennials should put 100% into stocks, and the honest answer is that it depends entirely on your answer here. A 25-year-old with four decades ahead and a steady paycheck can absorb a brutal bear market and even use it. A 58-year-old with five years left before retirement cannot. Same market, completely different math, because time is the one asset you cannot buy back once it is spent.
Bob Farrell’s first rule ties the two questions together.
“Markets return to the mean over time. Prices that stretch far above fair value do not stay there forever, and the further they stretch, the harder they snap back when it comes.”
In other words, the price you pay is not just a number at the register; it is a promise. That promise is how much pain you will feel, and how many of your finite years you will burn, when the mean reversion eventually comes.
But Doesn’t Buy And Hold Actually Work?
This is the one question that you need to reconcile, and it depends on you personally. For a specific type of investor, buy-and-hold is an excellent strategy and should be recognized as such. But notice what is most important,
- IF you have a thirty-plus-year horizon,
- And IF you start at reasonable valuations,
- IF you keep your costs near zero,
- IF you automate your contributions,
- And IF you never once flinch during a crash
Then a simple, low-cost index fund held for decades will beat the majority of professionals and virtually all tinkerers. Jack Bogle was right about fees. He was right that most people’s own behavior is the single biggest drag on their returns. Buy and hold, done with discipline, removes the two things that quietly wreck most portfolios: high costs and human emotion.
However, repeated studies show the problem with assuming that describes you. That paragraph is one long chain of “ifs,” and most real investors snap at least one link. Look at what the starting date alone does to the exact same strategy.
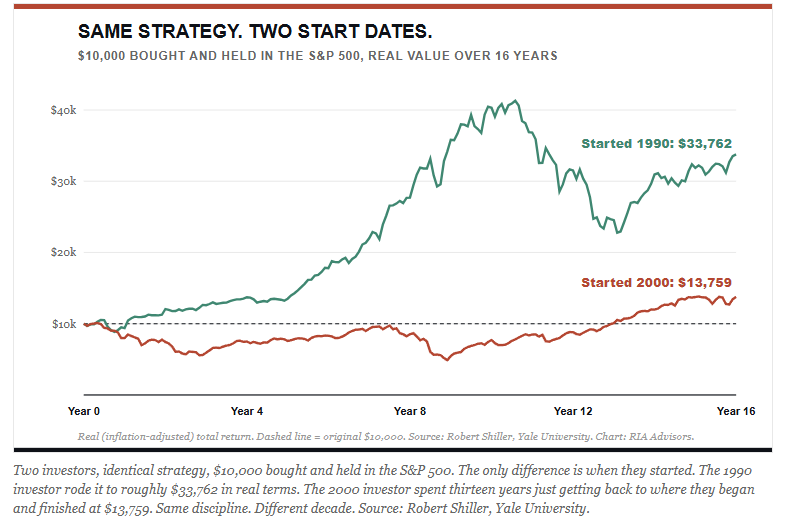
Think about that for a moment. That is the same fund, the same patience, and the same “just hold on.” One investor got rich. The other spent the better part of a decade underwater, and neither of them did a single thing differently. The only variable was the admission price on the day they walked in.
The strategy did not fail the 2000 investor. The strategy is fine. The flaw is assuming you are the flawless, infinitely patient, perfectly timed investor the strategy quietly requires, and that you will not be the one who happened to start at the wrong table.
How To Start Investing With The Right Mindset
With this all in mind, where does a beginner actually start? Not with a stock screener, and not with the app that turns your savings into a video game. You start by getting a few things straight before a single dollar goes to work. Here is the order that matters.
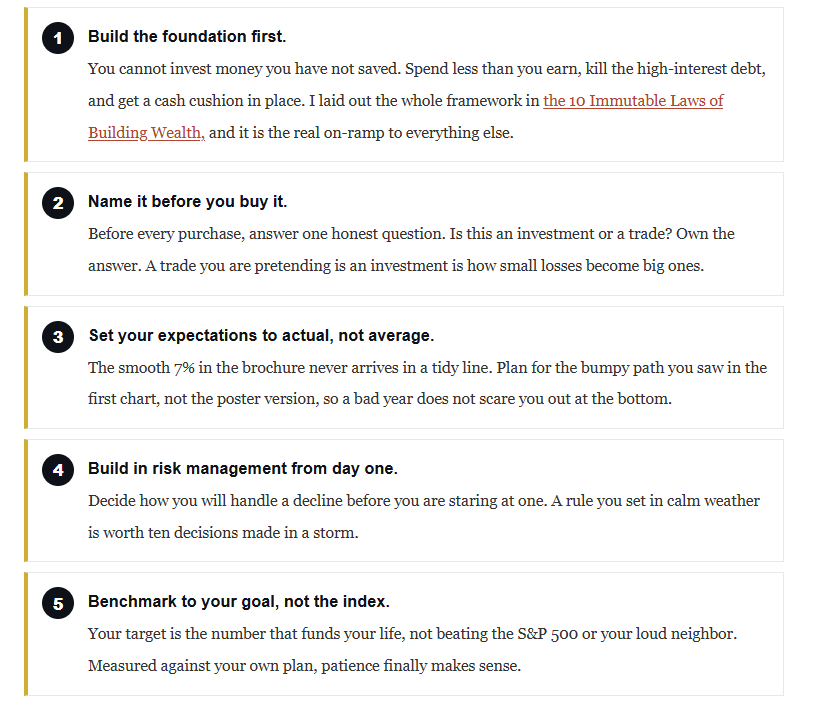
Let me just state that I realize that none of that is exciting. It will not make you rich by Friday, and it will never trend on social media. But it is how people who keep their money actually think, and it is the difference between compounding for decades and starting over every time the market has a bad year.
End Of Chapter 1
The “long run” is not a myth. It is just not yours. You get one cycle, a finite stack of years, and a brain wired to do the wrong thing at the worst possible moment. Learning to think like an investor rather than a speculator is not a personality quirk or a matter of taste. It is the entire game, and the good news is that it is a skill you can actually build, starting today, with the two questions and the five steps above.
That brings us to the next problem. Even once you know all of this, two forces spend every single day trying to drag you back into speculating. One lives inside one’s own head, while the other scrolls past on your screen dressed up as breaking news. In the next article, we take on both, starting with the enemy you cannot fire, mute, or unfollow. Yourself.
If reading this raised a question about how your own money is actually positioned, whether you are truly investing or quietly speculating, that is the conversation worth having before the next bear market forces it on you. At RIA Advisors, our process starts with your complete financial picture, not just your brokerage balance. Schedule a complimentary consultation, and let’s talk about what the data means for you.
Sources & Notes
- Real total return and CAPE valuation data: Robert Shiller, Yale University. econ.yale.edu/~shiller/data.htm. All three charts are built directly from this data series through July 2026.
- Lance Roberts, “My Favorite Chart Doesn’t Tell You 3 Things,” RIA Advisors. realinvestmentadvice.com
- Lance Roberts, “Millennials, Should You Put 100% Into Stocks?” RIA Advisors. realinvestmentadvice.com
- Lance Roberts, “Money: The 10 Immutable Laws Of Building Wealth,” RIA Advisors. realinvestmentadvice.com
- Andrew W. Lo, “Adaptive Markets: Financial Evolution at the Speed of Thought,” Princeton University Press.
- Bob Farrell, “10 Market Rules to Remember,” Merrill Lynch.
- Lance Roberts, “Speculator Or Investor: 10 Rules From Legendary Investors,” RIA Advisors. realinvestmentadvice.com
- Lance Roberts, “Value, Margin Of Safety, & The Art Of Doing Nothing,” RIA Advisors, 2026.
- Benjamin Graham & David Dodd, “Security Analysis” (1934); Philip Carret, “The Art of Speculation” (1930); Seth Klarman, “Margin of Safety” (1991).