
Dallas Fed President Lorie Logan recently said that she estimates the Fed Funds target rate needs to rise “an additional 50 basis points or more.” Her reasoning is straightforward and grounded in the Fed’s Congressional mandates. Inflation is falling as transitory factors fade but trending “toward the mid-2’s, not all the way to the FOMC’s 2 percent goal.” Unemployment at 4.2% sits close to most estimates of the lowest sustainable level. Taken together, she argued:
A balanced labor market and inflation trending above target mean the stance of policy has been offsides.
Full labor and stable prices, as she alludes, is the dual mandate applied to the current environment. Thus, while we may agree or disagree with her view on where rates should be set, Congressional mandates are driving that decision. So far so good, but then Logan introduced a third input.
Logan distinguished between two reasons long-term yields have risen. First, she said if yields are rising because the market anticipates further rate hikes, the Fed should follow the markets and boost rates accordingly. However, if yields are rising because the term premium is rising, the market is doing the Fed’s work, and further rate hikes may not be required.
Interestingly, and to her credit, she flagged the problem with relying on the term premium as your policy compass. To wit:
These decompositions depend on models and subjective judgments, and conditions can change.
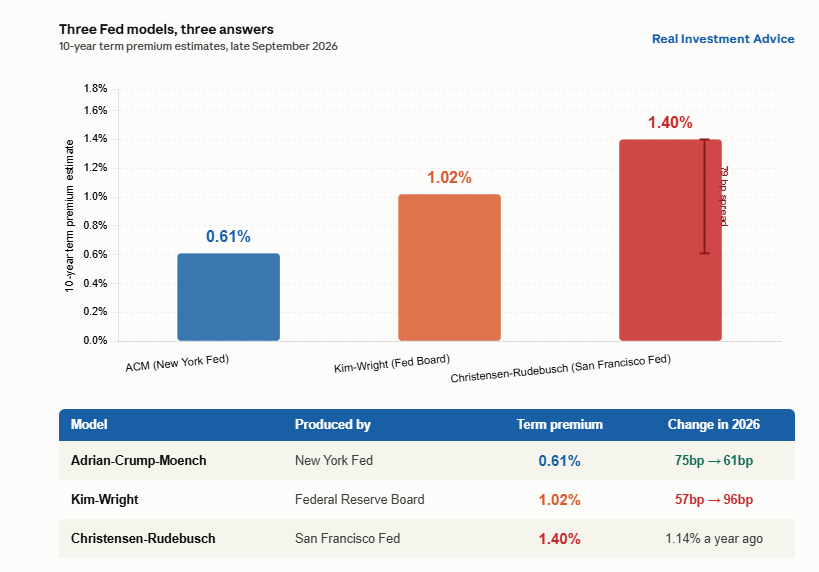
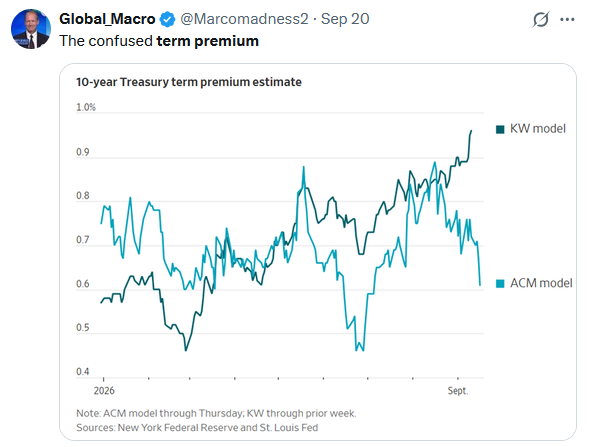
Using the term premium for policy decisions raises a big concern. Logan and likely other Fed members are relying on an unquantifiable number, the term premium, instead of hard inflation and labor market data? The term premium is a model that can be calculated in many different ways, with many different results. Even the Fed’s own models disagree sharply on what it is. The graphic below compares three Fed term premium models. It shows there is a 79-basis-point difference on the same bond, over the same time period, across Fed models. Further, two of the three disagree on whether the term premium rose or fell this year. See today’s Tweet of the Day below, which shows this stark divergence.
Congress mandated the Fed set policy according to prices and employment. Both are observable. Anchoring policy to estimates of market narratives and investor sentiment can lead to significant policy errors.
What To Watch Today
Earnings
- No earnings releases today
Economy

Market Trading Update
Yesterday, we discussed the “upside pain trade,” noting that any squeeze would more likely run through small caps than through crowded mega-caps. Today, let’s take a closer look at the Russell 2000 short squeeze setup, because the fuel is already in the tank.
Start with the trigger. The 10-year Treasury yield hit 5.35% on Monday, the highest level since April 2002. Yet it eased to roughly 5.26% on Tuesday, about where it traded five sessions ago. Rates haven’t reversed. They’ve stalled. That alone was enough for small caps to catch a bid.
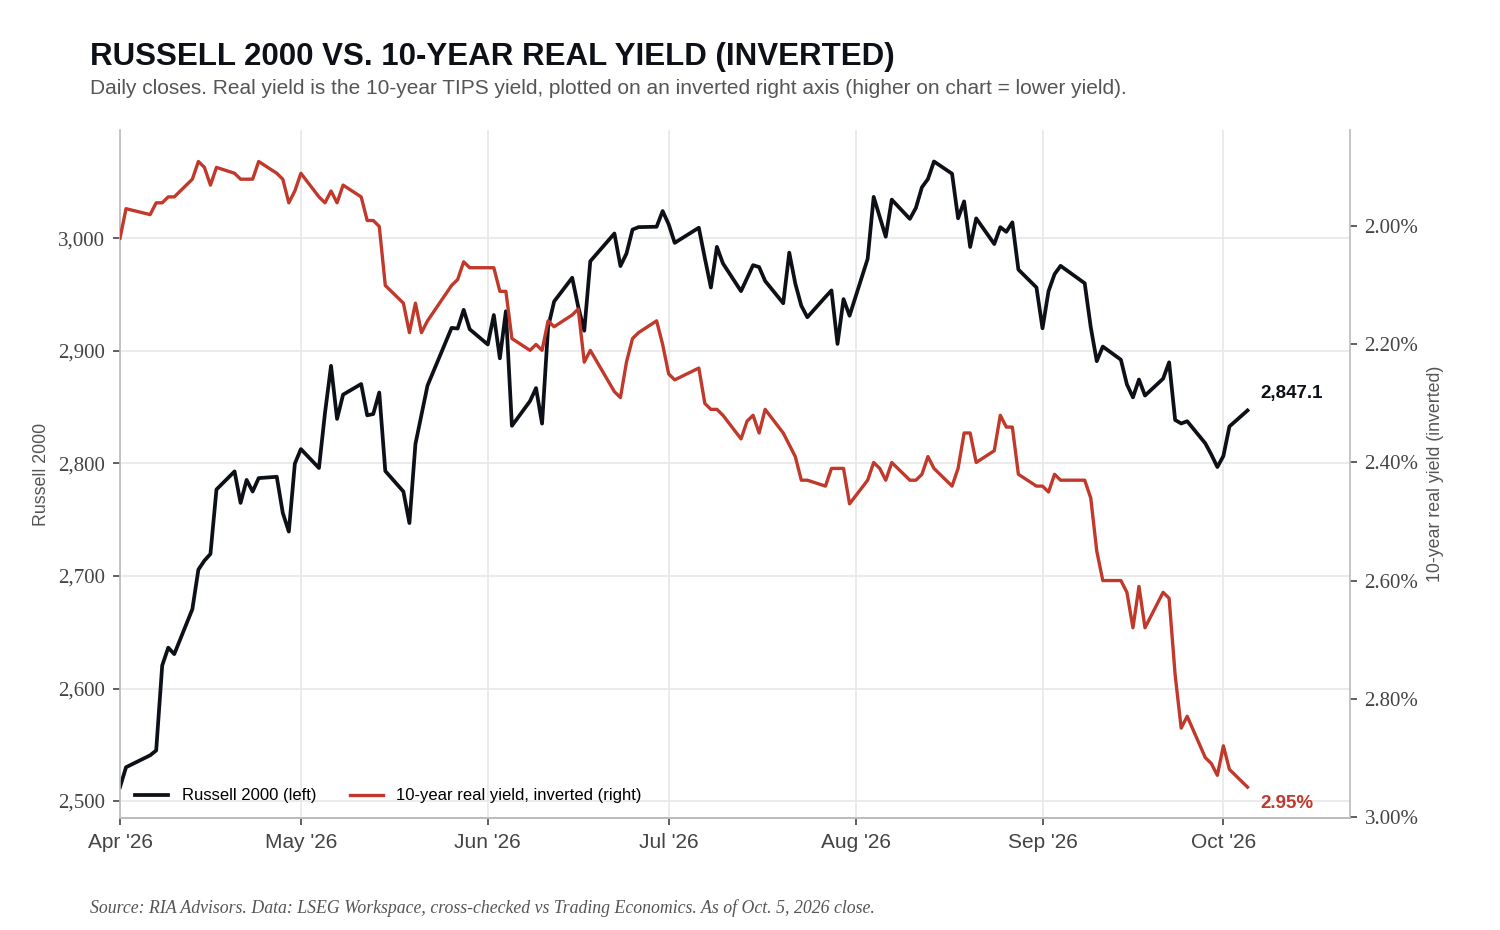
Notice in the chart above how closely the Russell has tracked the inverted 10-year real yield since July. As real yields climbed from 2.41% in mid-August to 2.95%, small caps sank. Now look at the right edge. Real yields edged higher again last week, yet the Russell bounced 1.8% off its Sept. 30 low. That’s what short covering looks like. Such is the nature of a crowded trade.
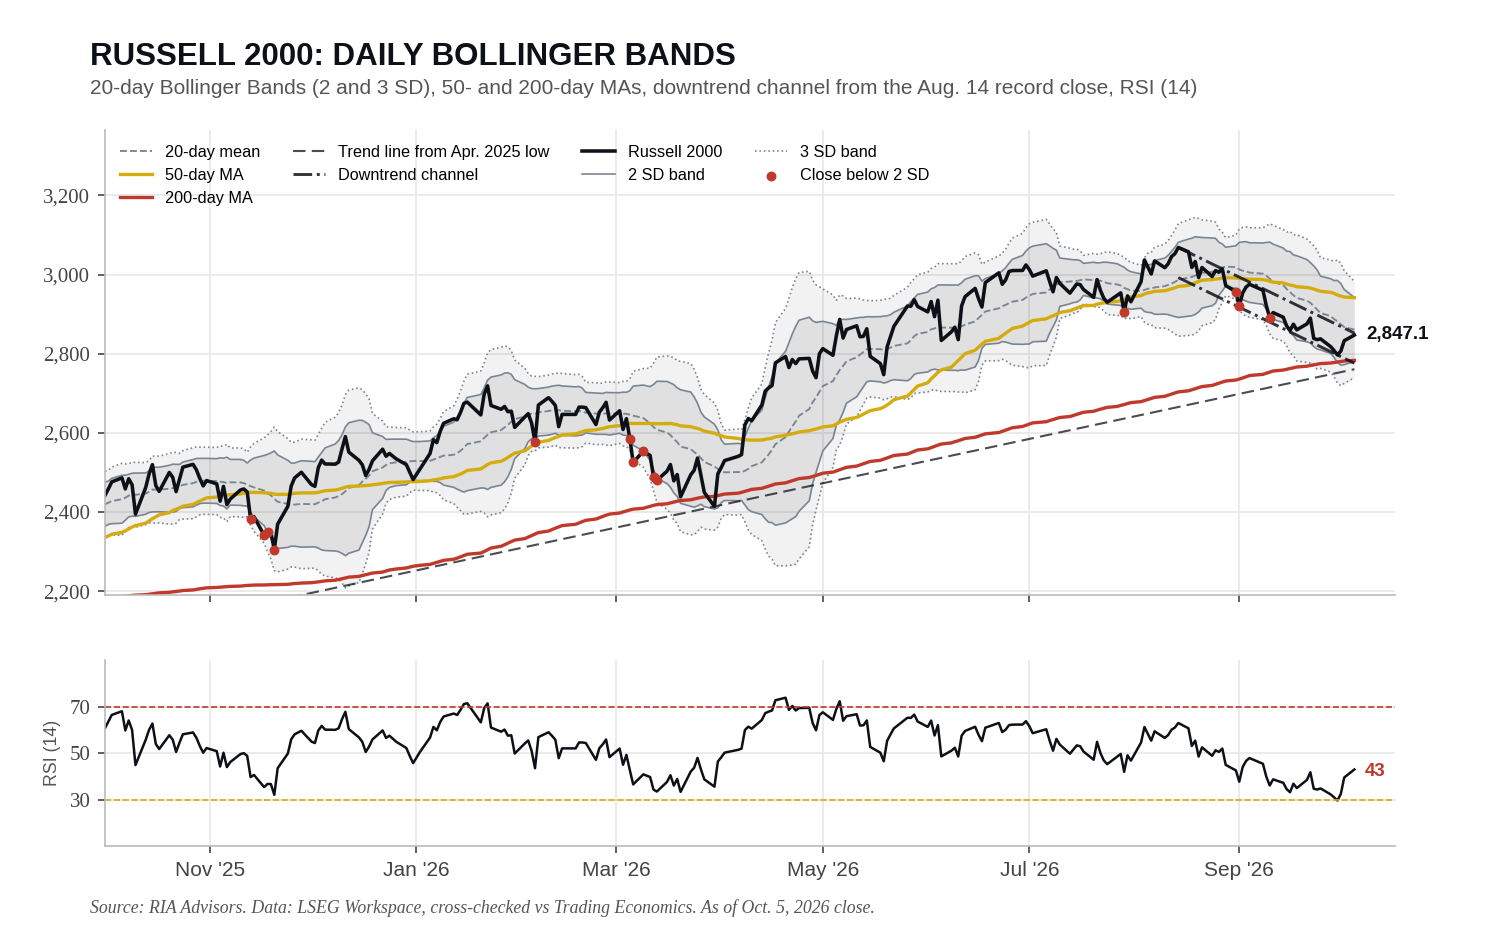
The technical picture is improving, too. The Russell closed Monday at 2,847, about 2% above its 200-day moving average at 2,783 and 7% below the Aug. 14 record close of 3,068. It’s now pressing against the top of the downtrend channel off that peak, which sits near 2,852. Meanwhile, the long-term trend line from the April 2025 low, now near 2,761, held on the pullback. This is the first constructive technical setup in small caps in two months.
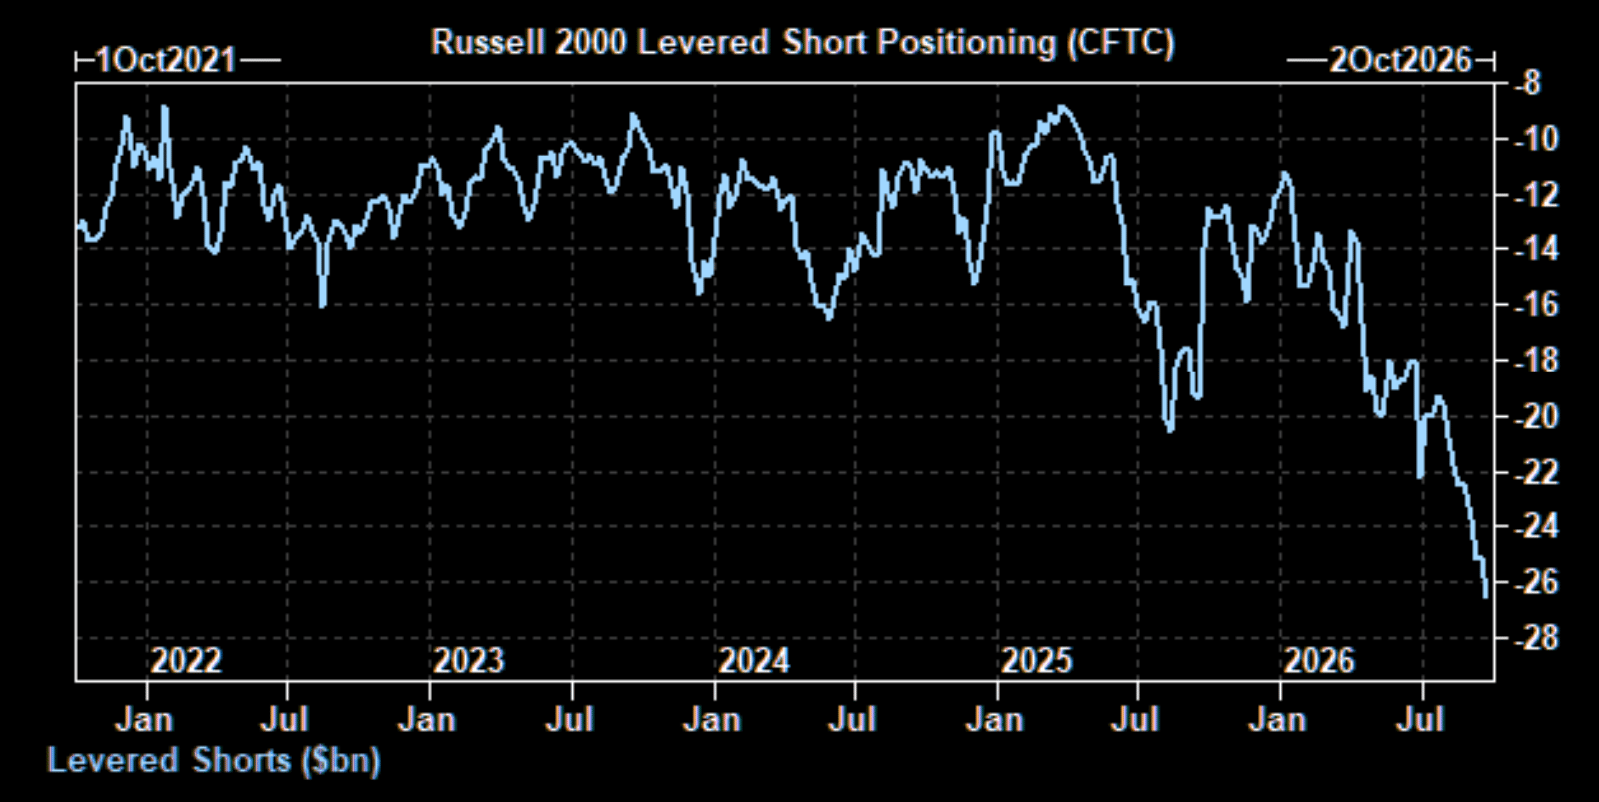
Here’s where it gets interesting. Goldman notes that systematic exposure to the Russell sits at just the 7th percentile, while CFTC data show leveraged funds holding a record short of roughly $26 billion. Over the last several sessions, IWM gained about 2% versus 1.5% for the S&P 500. It’s a small gap. But it’s the first time in three months the relative trend has bent.
Yes, we have seen this movie before: small caps have repeatedly teased breakouts, only to roll over. It’s a fair point, and right now everyone agrees small caps are “dead money” while rates rise, which has been our case as well. However, yields don’t need to collapse for that consensus to crack. A drift back toward the 21-day average near 5.08% would likely send shorts scrambling. A test of the 50-day near 4.86% is a different story entirely.
Of course, the risk cuts both ways. Today’s 10-year auction and the FOMC minutes are the test. A sloppy auction pushes yields back to the highs, and the channel break fails.
Just remember this: “Crowded shorts rarely exit quietly, and neither do the ones who arrive late.“

Gold Is Not Living Up To Its Narrative
Deficits are out of control. Inflation rages. Rising Treasury yields will bankrupt the nation.
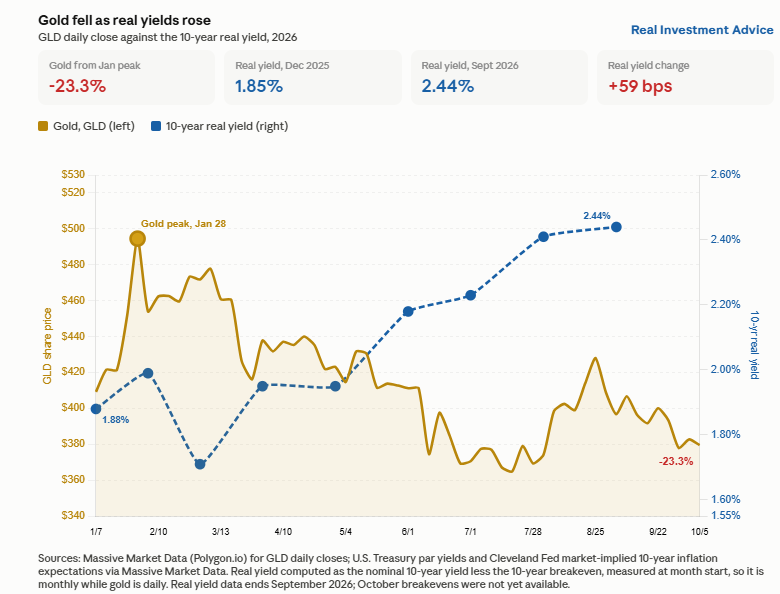
The negative narratives above and others haunt the bond market. Yet what should be bad news for Uncle Sam should be good for gold. Gold has fallen by about 6% over the past month and is almost 25% below January’s record of $5,608. If gold were primarily an inflation and fiscal-malfeasance hedge, it should be at record highs.
As we have shown in the past, gold prices are much more tethered to real yields than to inflation or deficits. This is logical for two reasons. First, high real rates reflect restrictive monetary policy, which runs counter to the rationale for holding gold to hedge against overly easy Fed policies. Second, gold doesn’t pay a yield or dividend. As real yields rise, investors may be more comfortable hedging inflation with TIPS and earning a decent yield. With the 30-year TIPS real yield near 3% and nominal yields at 24-year highs, that opportunity cost of holding gold over bonds has rarely been higher in the past two decades.
Gold does well when real rates fall, which often coincides with inflation rising faster than the Fed is responding. When the Fed is ahead of inflation, as it is attempting to be now, gold struggles regardless of the price level and the many bearish fiscal-but-bullish-gold narratives.

Tweet of the Day
Trading Rules With Desktop Printout
“Want to achieve better long-term success in managing your portfolio? Here are our 15-trading rules for managing market risks.”
Please subscribe to the daily commentary to receive these updates every morning before the opening bell.
If you found this blog useful, please send it to someone else, share it on social media, or contact us to set up a meeting.