
My favorite chart doesn’t tell you three important things about investing and risk management. However, the chart puts the volatility that can occur in any given year into perspective.
Various versions of this chart have been floating around the internet since 2013, when it was first published by J.P. Morgan’s “Guide To The Markets.” The chart, as shown below, plots each year’s annual return for the S&P 500 in blue and its intra-year max drawdown (i.e., a decline from its high) in red.
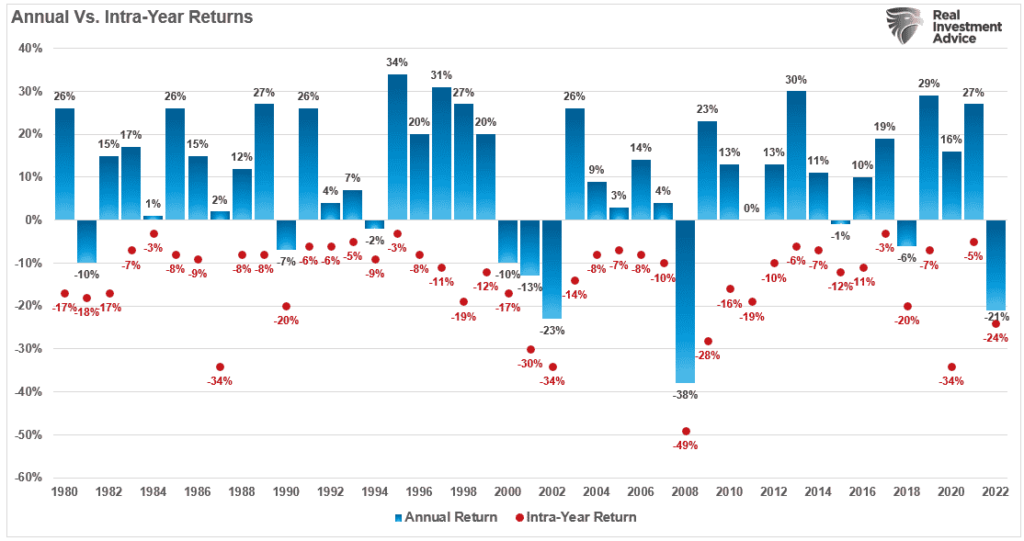
When examining the data in this manner, it is easy to overlook the drawdowns that can occur in any given year. A good example was 2020, where the market declined by 34% in March but finished the year with a 16% gain. Of course, in hindsight, it is easy to say, “if you just held, everything worked out okay.” However, amid those declines, investors fall victim to “loss aversion “ and often sell near the lows. As noted previously:
“The ‘herding effect’ and ‘loss aversion’ are the most significant behaviors that compound the issues of investor mistakes over time. As markets rise, individuals believe the current price trend will continue indefinitely. The longer the rising trend lasts, the more ingrained the belief becomes. Eventually, the last ‘holdouts’ finally ‘buy in’ as the market evolves into a ‘euphoric state.’
As markets decline, there is a slow realization that ‘this decline’ is not a ‘buy the dip’ opportunity. As losses mount, the need to ‘avert loss’ increases until individuals seek to ‘avert further loss’ by selling.“

3-Important Lessons
Going back to our chart above, there are three important lessons concerning portfolio and risk management.
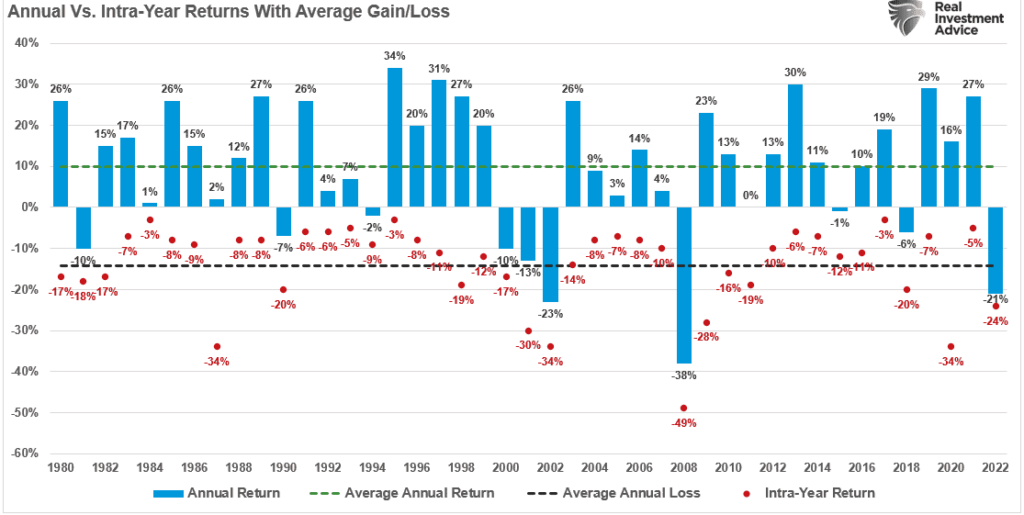
First, markets do not have an average annualized rate of return. Far too often, individuals are told by the financial community that stocks provide an average rate of return over time. These averages are then input into financial plans to provide a rosy outcome of financial security in the future. However, when adding averages to the chart above, we see that markets provide anything but an average return each year.
Second, volatility is always an issue regarding investor performance over long periods. The study of behavioral analysis has become mainstream in recent years, studying a rash of human frailties from loss aversion to anchoring and confirmation bias. While it may sound easy enough to just “ride out the bumps,” amid those intra-year declines, the “need” to halt losses can overwhelm logic.
Lastly, percentage gains and losses are very deceiving. A 10% gain and a 10% loss are two very different things regarding long-term returns. Let’s assume an investor wants to compound their returns by 10% yearly over 5 years. We can do some basic math.
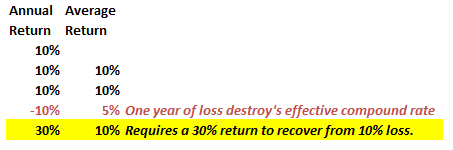
After three straight years of 10% returns, a drawdown of just 10% cuts the average annual compound growth rate by 50%. Furthermore, it then requires a 30% return to regain the average rate of return required. This is because during the loss years, not only does the principal need to get recovered but the expected gains as well.
Such is why there is a significant difference between AVERAGE and ACTUAL returns. The impact of losses destroys the annualized “compounding” effect of money. To prove that, the purple shaded area shows the “average” return of 7% annually. However, the differential between the promised and “actual return” is the return gap. See the problem?
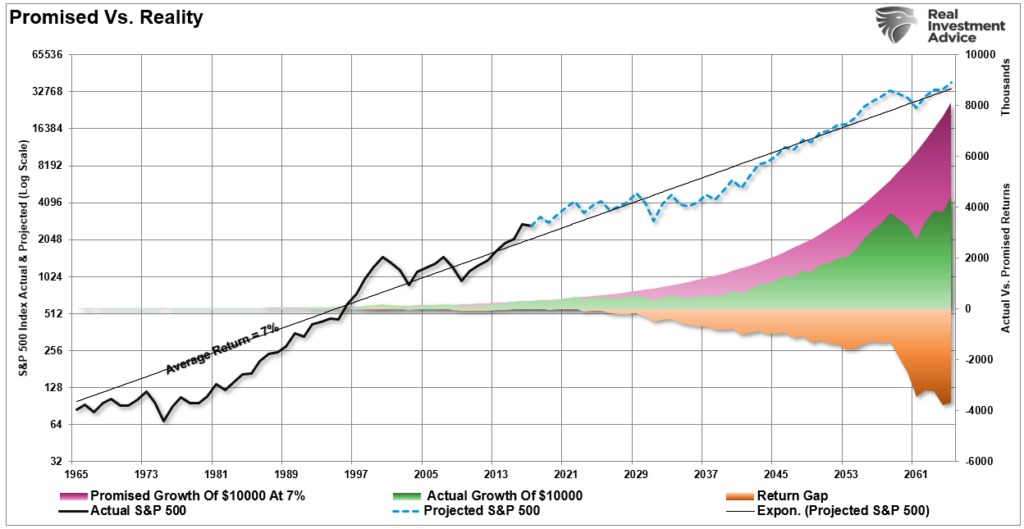
The differential between what investors were promised (and a critical flaw in financial planning) and actual returns are substantial over the long term.
So, before assuming that markets always recover, consider the following points.

Important Points To Consider
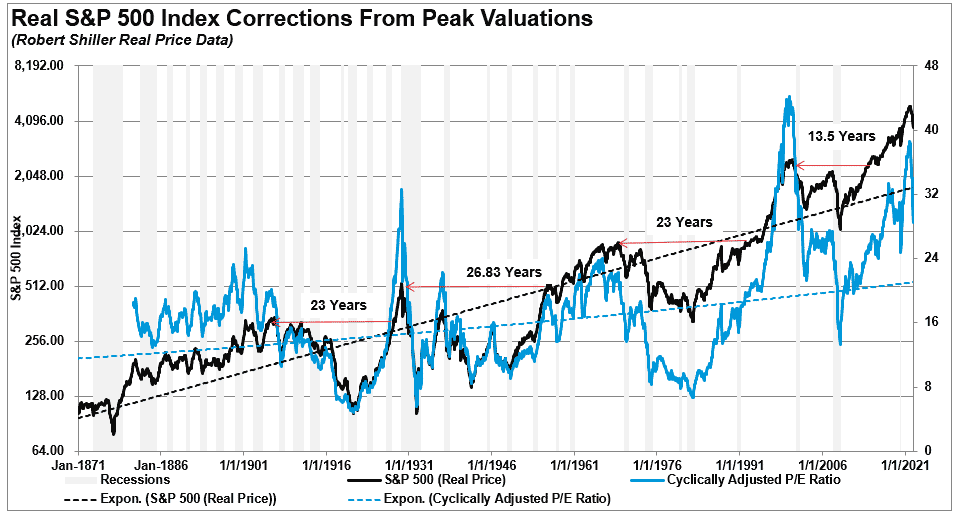
While my favorite chart shows that intra-year drawdowns always recover, the portfolio damage can be quite significant. Throughout history, there have been incredibly long stretches where investment returns were near zero. As shown, the problem is if you started your investment journey when valuations were high.
Given that we don’t live forever, the time we have between today and when we need our portfolios for retirement is a crucial part of the equation.
A vast difference exists between an “index” that benefits from share buybacks, substitutions and market capitalization weighting versus a portfolio invested in actual dollars. Yes, a “buy and hold” portfolio will grow in the financial markets over time, but it DOES NOT compound.
Read this carefully: “Compound returns assume no principal loss, ever.”
To visualize the importance of this statement, the chart below shows $100,000, adjusted for inflation, invested in 2000 versus a 6% annual compound rate of return. The shaded area shows the difference between the portfolio value and the 6% rate of return.

As noted, due to the impact of two bear markets, the investor that started in 2000 is still well short of the rate of return promised. The investor that began in 2007 only just recently achieved their goal. However, the recent bear market set them back again.
See the problem? If you were 45 in 2000, you didn’t make your retirement goal.
Conclusion
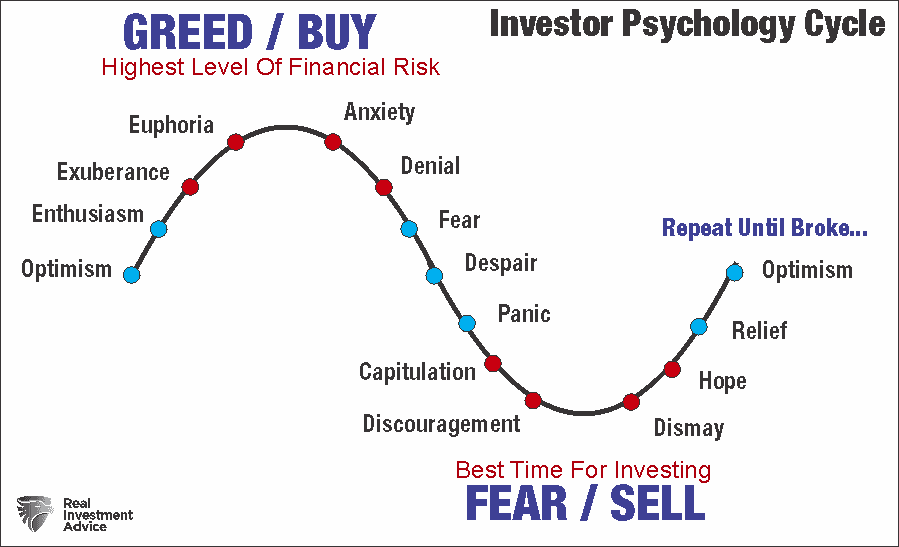
Our inherent human biases make us extremely fallible creatures when investing. Inherently, we will all do precisely the opposite of what we should do. First, we will “buy high” as “greed” overtakes our base logic. Then, we will “sell low” as “panic” over mounting losses.
But we can do better. However, we must understand our essential behavioral traits and learn to manage the amount of risk that we take in our portfolio management strategies.
- Avoid the “herd mentality” of paying increasingly higher prices without sound reasoning.
- Do your research and avoid “confirmation bias.”
- Develop a sound long-term investment strategy that includes “risk management” protocols.
- Diversify your portfolio allocation model to include “safer assets.”
- Control your “greed” and resist the temptation to “get rich quick” in speculative investments.
- Resist getting caught up in “what could have been” or “anchoring” to a past value. Such leads to emotional mistakes.
- Realize that price inflation does not last forever. The larger the deviation from the mean, the greater the eventual reversion will be. Invest accordingly.
Despite the inherent belief that we are long-term investors, we all consistently get swept up in the market’s short-term movements. Such is why charts showing quick recovery of markets obscure the impact of losses and the damage inflicted on investment goals.

