
https://awealthofcommonsense.com/2023/01/is-it-realistic-to-have-100-of-your-portfolio-in-stocks/
Millennials should ignore the chart below which is seen in a variety of forms in the financial media touting “how easy it is to become a millionaire.” There are two primary reasons Millennials aren’t saving as they should. The first is the lack of money to save, the second is that markets do not compound returns.
The following charts show four hypothetical Millennial investors who invest $10,000 a year at a 6.5% annual rate of return over different periods of their lives:
- Thomas invests for his entire working life, from 25 to 65.
- Mackenzie starts 10 years later, investing from 35 to 65.
- Colton puts money away for only 10 years at the start of his career, from ages 25 to 35.
- Taylor saves from 25 to 65 like Thomas, but instead of being moderately aggressive with his investments she simply holds cash at a 2.25% annual return.”

At first glance, it is apparent that starting a consistent saving and investing program early in life leads to the best financial outcomes. Of course, such is entirely logical.
However, there are two critical problems with the analysis that renders its observations quite irrelevant.
The Saving Problem
The first problem is quite evident when looking at recent financial surveys of average Americans. For example, a recent Bankrate survey found:
“Only about 4 in 10 Americans have enough savings to cover an unplanned expense of $1,000, meaning more than half would need to find other means to pay for an unexpected car repair or emergency room visit.”

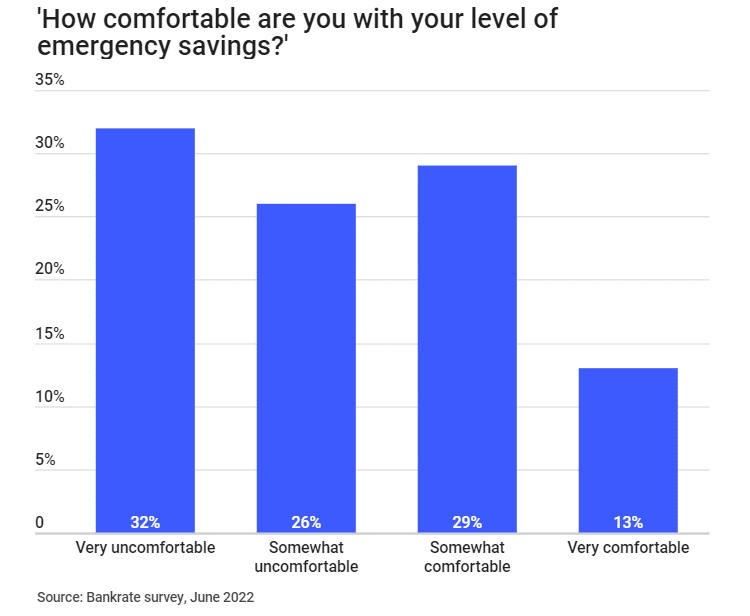
Of course, with inflation surging in 2022, another more recent Bankrate study found that more than half of adults are uncomfortable with their level of emergency savings.
As you can see, for most Millennials, the idea of saving $10,000 a year sounds great, the problem is that the median income in the U.S. barely covers the cost of living much less leaving excess savings. As shown, the median income in the U.S. for 80% of wage earners is $53,663 (via the Census Bureau, 2020 most recent data).
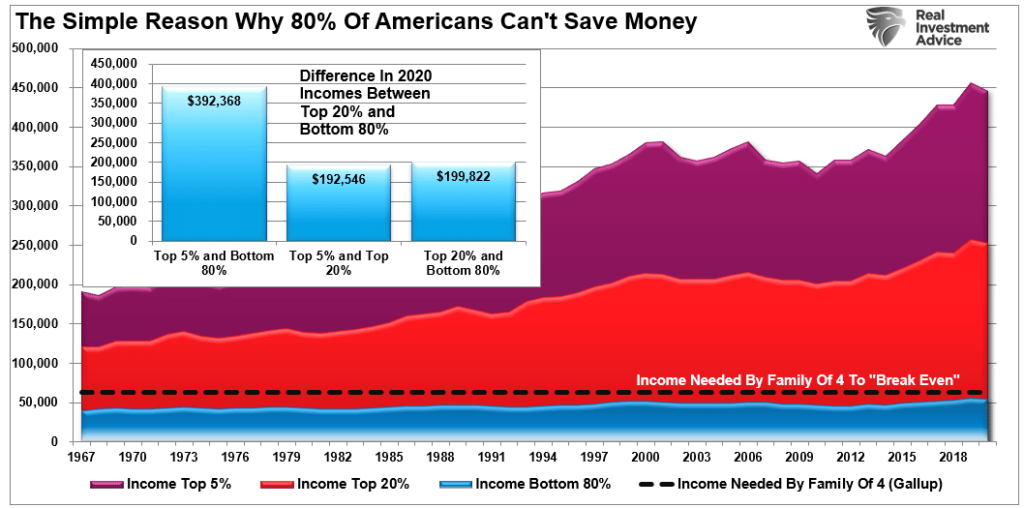
The problem, of course, is the generalized assumption that Millennials are able to save roughly 25% of their annual after-tax incomes. This is not a realistic assumption given that many of the Millennial age group are struggling with student loan and credit card debts, car notes, apartment rent, etc.
In fact, the current gap between savings, income, and the cost of living is running at the highest annual deficit on record. It currently requires roughly $6,300 a year in additional debt to maintain the current standard of living. Either that or spending gets reduced which is the likely outcome as a recession becomes more visible.

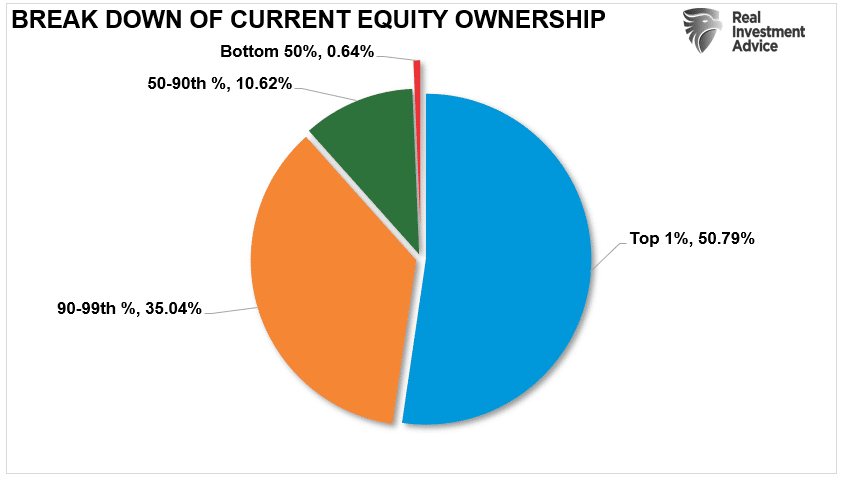
Of course, if you don’t have excess cash flow, it is really difficult to “invest” in the financial markets. Such is why the top 10% of income earnings own roughly 90% of the entire stock market.
Understanding the lack of financial stability in the vast majority of households, how are Thomas, Mackenzie, Colton, and Taylor supposed to save $10,000 a year. Such is questionable when Thomas works in customer service, Mackenzie is a nursing assistant, Taylor is a bartender and Colton works retail? (These are the jobs that have made up a bulk of the employment increases since 2009. They are also in the lower wage paying scales which makes the problem of savings difficult.)
Such is why Millennials are setting new records for living with their parents.
“Young people started moving out mid-century as they became more economically independent, and by 1960 only 29% of young adults total—men and women—were living with mom and dad. But that number has been rising ever since, and in 2021, the number of young adults living with their parents eclipsed the 1940s. And last year 52% of young adults were living at home, which is the highest rate since 1940.” – Pew Research

Stocks Do Not Deliver Compound Rates Of Return
The second major problem with the analysis is the assumption that stocks deliver compounded returns over the long term. This is one of the biggest fallacies perpetuated by Wall Street on individuals in the effort to entice them to sink their money in “fee-based” investment strategies and forget about them.
Compound returns ONLY occur in investments that have a return of principal function and an interest rate such as CD’s or Bonds (not bond funds.) This is not the case with stocks as just recently discussed in the “Problem With HODL”
“While the average rate of return may have been 10% over the long term, the markets do not deliver 10% yearly. Let’s assume an investor wants to compound their returns by 10% a year over five years. We can do some basic math.”
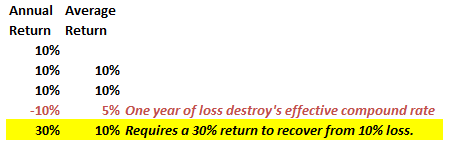
“After three years of 10% returns, a drawdown of just 10% cuts the average annual compound growth rate by 50%. Furthermore, it then requires a 30% return to regain the average rate of return required.
While an investor can “HODL” for the long term, there is a significant difference between the AVERAGE and ACTUAL returns received. As I showed previously, the impact of losses destroys the annualized “compounding” effect of money. (The purple shaded area shows the “average” return of 7% annually. However, the differential between the promised and “actual return” is the return gap.)“
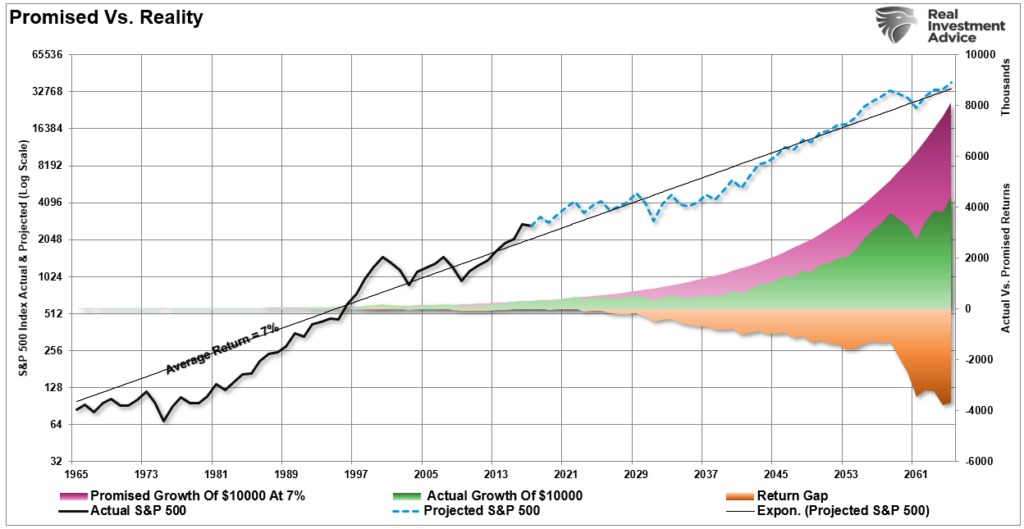
When imputing volatility into returns, the differential between what investors were promised (and this is a huge flaw in financial planning) and what actually happened to their money is substantial over the long term.
Timing Is Everything
Lastly, and probably the most critical point, is the valuation level of the market when these individuals began the saving and investing program.
The problem for Thomas and his friends is that valuation levels are currently at some of the highest levels recorded in market history. The chart below shows REAL rolling returns for stock-based investments over 20-year time frames at various valuation levels throughout history.
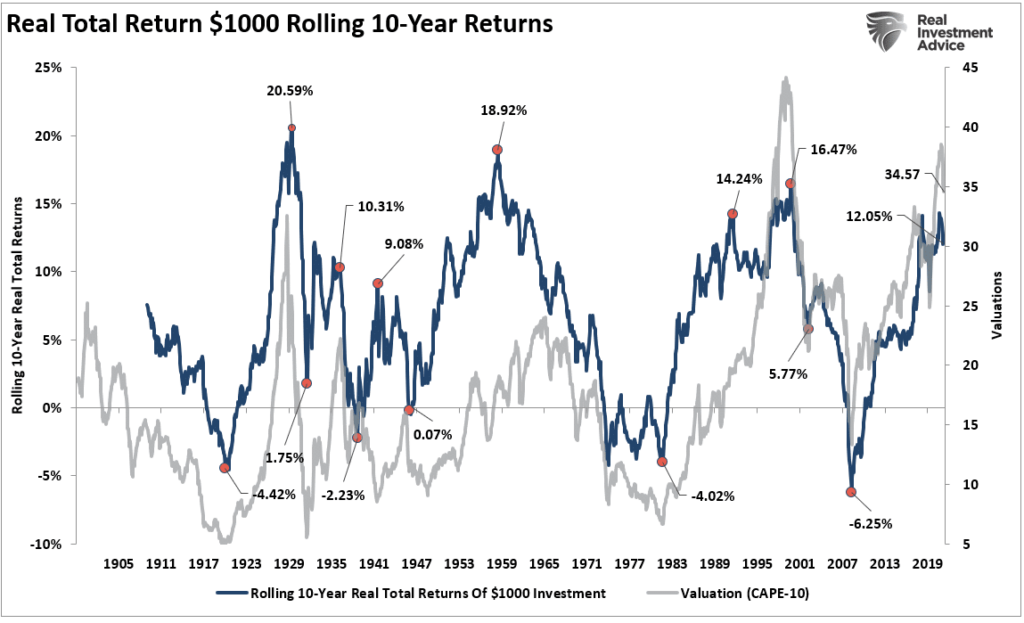
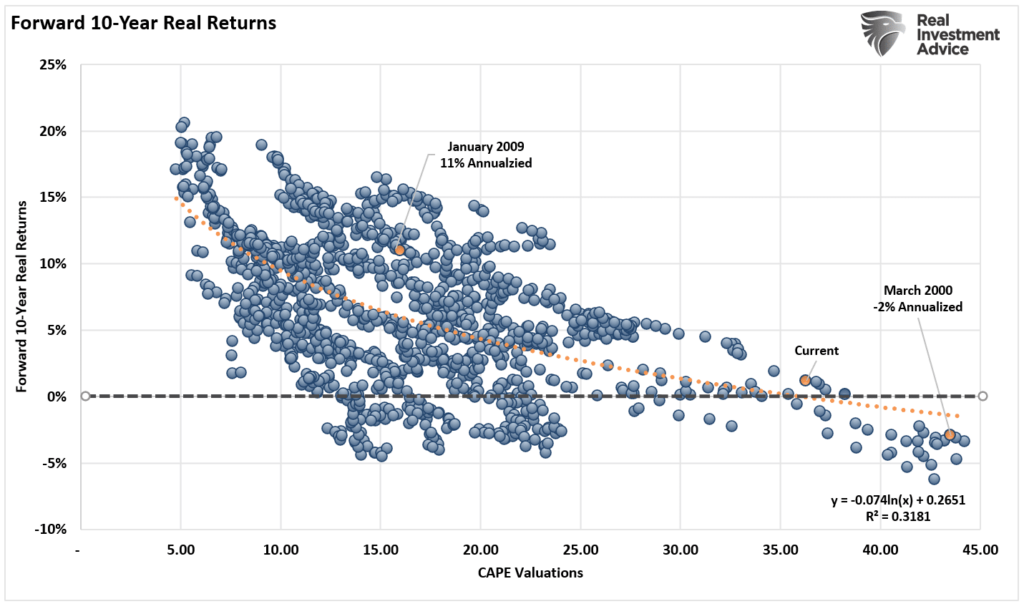
The return has everything with valuations and whether multiples are expanding or contracting. As shown in the chart above, real rates of return rise when valuations expand from low to high levels. But, real rates of return fall sharply when valuations have historically exceeded 23x trailing earnings and revert to their long-term mean.
Yes, “buy and hold” investing will work, but it depends on WHEN you start your investing journey. At 35x CAPE, such suggests that returns over the next 10-20 years could be disappointing.
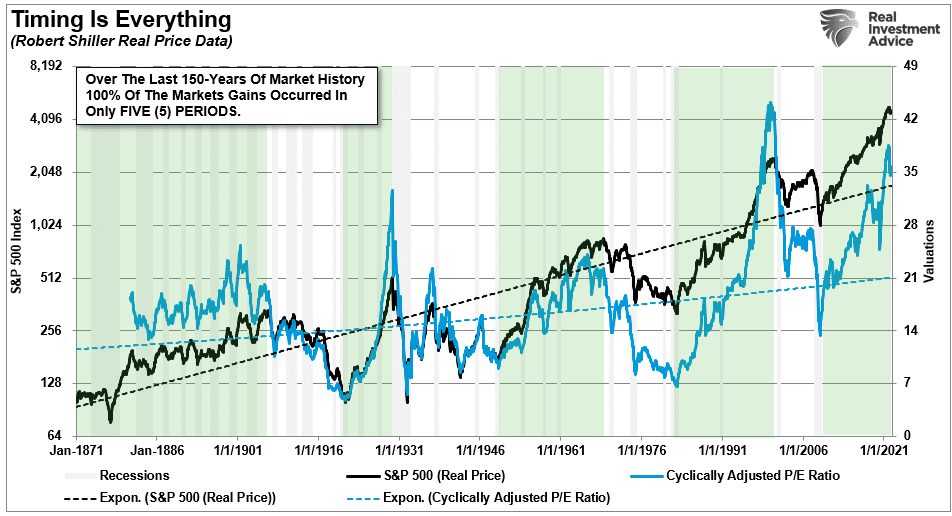
The MAJORITY of the returns from investing came in just 5 of the 9-major market cycles since 1871. Every other period yielded a return that lost out to inflation during that time frame.
Conclusion
While “long-term” and “buy-and-hold” investment strategies sound good at face value, the real-world outcomes fell short for three reasons:
- Lack of savings.
- Inability to remain consistent
- Impact of negative returns on long-term goals.
Unfortunately, for individuals, the difference between promised and actual outcomes continues to be two very different things and generally not for the better.
It should also be somewhat evident that “long-term” and “buy and hold” strategies don’t work as promised when you consider the charts above. After three significant bull markets since 1980, the bottom 80-90% of Americans have little wealth to show for it.
This is due to a myriad of poor investment decisions, terrible advice from the financial media, and a predatory Wall Street taking advantage of unwitting investors.
Don’t misunderstand me. Should individuals invest in the financial markets? Absolutely. However, it should be done with a solid investment discipline that takes into account the importance of managing volatility and psychological investment risks. There are many great advisors that do exactly that, unfortunately, they generally aren’t found on the front pages of investment publications or in the financial media.
Of course, the problem to solve first is getting Millennials out of their parent’s basements and back into the workforce. Having a job makes it easier to start investing, to begin with.

