
If you knew you were standing inside a stock market bubble, you wouldn’t be standing in it for long. You’d sell. So would I, and so would everyone reading this. And if spotting market bubbles was something everyone could do in real time, the bubble couldn’t form in the first place. That paradox is why spotting market bubbles is one of the hardest jobs in finance, and why bubbles look painfully obvious only after the fact.
Market bubbles are not a modern invention. They’ve been a recurring feature of financial life for almost 400 years, ever since the first organized stock exchange opened in Amsterdam in the early 1600s.
The Dutch Tulip Mania of 1636 to 1637 is the textbook case. Tulip bulb prices in the Netherlands soared roughly twentyfold in a few months, then collapsed by about 99% in May 1637. Less than a century later, the South Sea Bubble of 1720 took shares of the South Sea Company from £128 in January to £1,050 in June before collapsing back to near the starting price by year-end. Isaac Newton, often cited as the smartest man of his era, lost a fortune in that one. He’s reputed to have said: “I can calculate the motion of the heavenly bodies, but not the madness of crowds.”
The 20th century gave us bigger versions of the same story. The Roaring Twenties ended with the 1929 crash and a peak-to-trough Dow drawdown of nearly 89% by 1932. Japan’s late-1980s asset bubble carried the Nikkei 225 to 38,915 on December 29, 1989, and triggered a collapse that eventually took the index down more than 80%, with the post-bubble low not arriving until October 2008, nearly 19 years after the peak. Then came the dot-com bubble. Between January 1995 and March 10, 2000, the Nasdaq Composite rose roughly 572% to a peak of 5,048.62. It then fell 78% by October 2002, and didn’t recover its 2000 high until April 2015.
The 2008 housing-and-credit bubble ended differently. Instead of a single speculative asset, the bubble formed in mortgage credit and spread across the entire global banking system. The S&P 500 lost 57% from its peak to its trough. None of these episodes looked the same on the way up. Yet all of them look identical on the way down. This is why spotting market bubbles is always a function of hindsight.
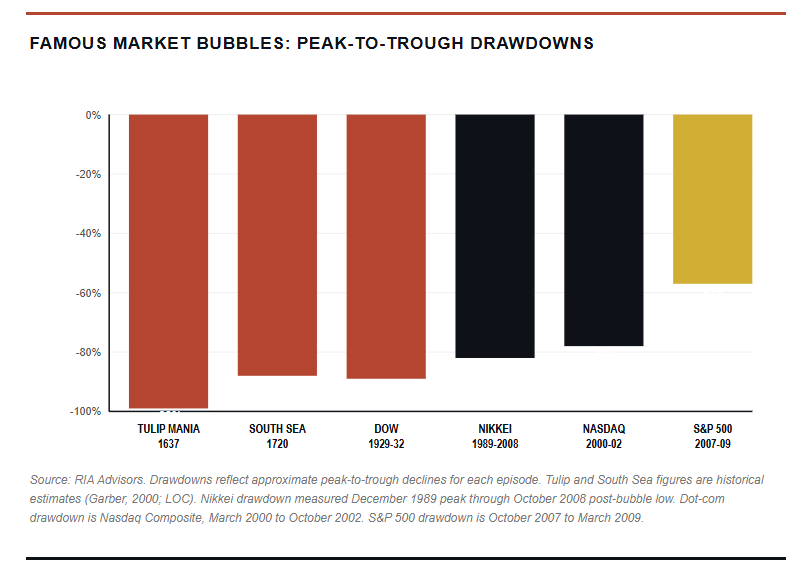
Notice in the chart above. The drawdowns from the four largest equity bubbles ranged from 57% to 99%. None of them recovered quickly. The Nasdaq took 15 years. The Nikkei took 34 years to finally reclaim its 1989 peak, hitting it in February 2024, before pushing on to fresh all-time highs since. The damage from a real bubble isn’t measured in months. It’s often measured in lost decades.

Why Spotting Market Bubbles Is Mostly Hindsight
As stated above, spotting market bubbles in advance is often futile. Just because assets sport high prices, valuations, or any other metric you choose, those alone do not necessarily define a bubble. A good example of the futility of spotting market bubbles in advance was in 1996 when Alan Greenspan warned of “irrational exuberance.” Yes, prices were elevated, sentiment was extremely bullish, and the Nasdaq then tripled over the next three and a half years before peaking. Anyone who sold on that warning missed an enormous gain before the eventual crash. That’s the trap.
Owen Lamont, a portfolio manager at Acadian Asset Management who has spent years studying market extremes, put it bluntly. He once joked that a bubble is just “when I think the stock market is overpriced and then it doubles.” That’s not really a joke. It captures the practical impossibility of timing a top in real time. Stanley Druckenmiller, working alongside George Soros, identified the Japanese bubble in 1988 and shorted it. The Nikkei kept ripping higher into late 1989, and Druckenmiller eventually said his lesson was simple.” Valuation is not a catalyst.“
Bubbles also sustain themselves through narrative, not arithmetic. In 1999, the story was that the internet had repealed the rules of economic gravity. Cisco Systems, the world’s most valuable company at its peak, traded at a trailing P/E ratio above 100. In 1989, the story was that Japan Inc. was unstoppable. In 2007, the story was that housing prices would never fall nationally. Each story was wrong, but each story sounded reasonable at the time, especially because each story had real evidence supporting it. The internet did transform commerce. Japan was a manufacturing powerhouse. Housing prices had not, in fact, fallen nationally for decades. The bubble forms when investors take a real trend and extrapolate it past any reasonable mean reversion.
The Four Horsemen Investors Should Watch
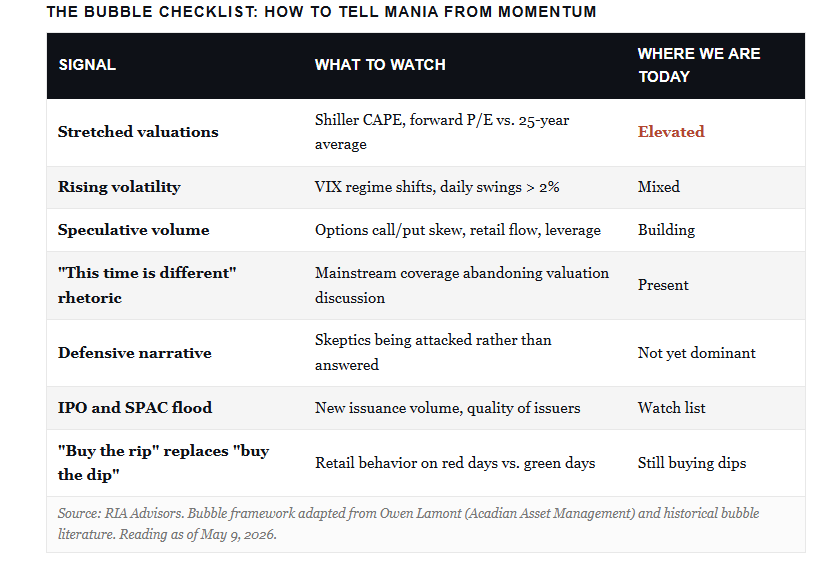
So, with that said, if high prices or valuations alone don’t make a bubble, what does? Several decades of academic and practitioner research point to a consistent checklist. Lamont calls them the four horsemen, and they are essentially what you would expect.
- High prices, measured by valuation multiples that significantly exceed long-term averages.
- High volatility. Bubbles don’t drift higher quietly. They lurch up and down with bigger and bigger swings.
- High trading volume, particularly among retail and speculative accounts that were previously inactive.
- The spread of “bubble beliefs,” the idea that this time is different and traditional valuation rules no longer apply.
However, for me, I would include a fifth indicator that’s saved me more than once. It’s defensiveness. When the cheerleaders of an asset stop selling its merits and start attacking the people who question it, the bubble has gone parabolic. We saw it in late-1999 internet stocks. We saw it again at the 2021 SPAC mania and the Bitcoin peak. And we saw it most recently in the 2025 precious metals run.
When I published my critique of the commodity supercycle and dollar-debasement thesis last year, the response from precious metals advocates wasn’t a counterargument backed by data. It was dismissal and accusations of being on the wrong side of history. Silver then rallied roughly 135% on the year before suffering its biggest single-day drop since the 1980s in late January 2026. Gold knocked more than 10% off its peak in the same window. When debate stops, and tribal loyalty takes over, the top is usually close.
How the Current Setup Compares to 1999
Naturally, the question is whether we are currently “spotting a market bubble”? The honest answer is that some signals are flashing yellow. Others aren’t.
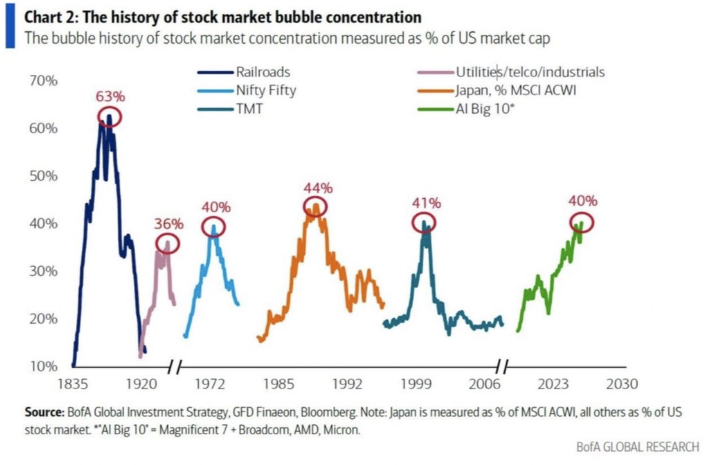
The yellow signals are real. The S&P 500’s cyclically adjusted P/E sits within striking distance of the all-time high set in December 1999. Concentration risk is severe. The top 10 stocks now make up a larger share of the S&P 500 than tech, media, and telecom did at the March 2000 peak. Performance for AI infrastructure leaders has gone parabolic. A normalization of multiples back toward the long-term average would, by itself, deliver a market drawdown of 30% or more even without a recession.
However, the differences from 1999 are real and matter. In March 2000, dozens of marquee Nasdaq names had no earnings, no cash flow, and business models built on burning venture capital to acquire eyeballs. Today’s leaders, meaning Nvidia, Microsoft, Alphabet, and Meta, throw off enormous free cash flow. Pets.com had 9 months of cash left when it went public. Nvidia generated tens of billions in operating profit last quarter. That isn’t a small distinction. A bubble built on hopes and venture capital pops differently than one built on real, but extrapolated, earnings power.
The table below puts the comparison on a single page. Some indicators are eerily similar. Some are actually worse today. And a few key fundamentals are meaningfully better.
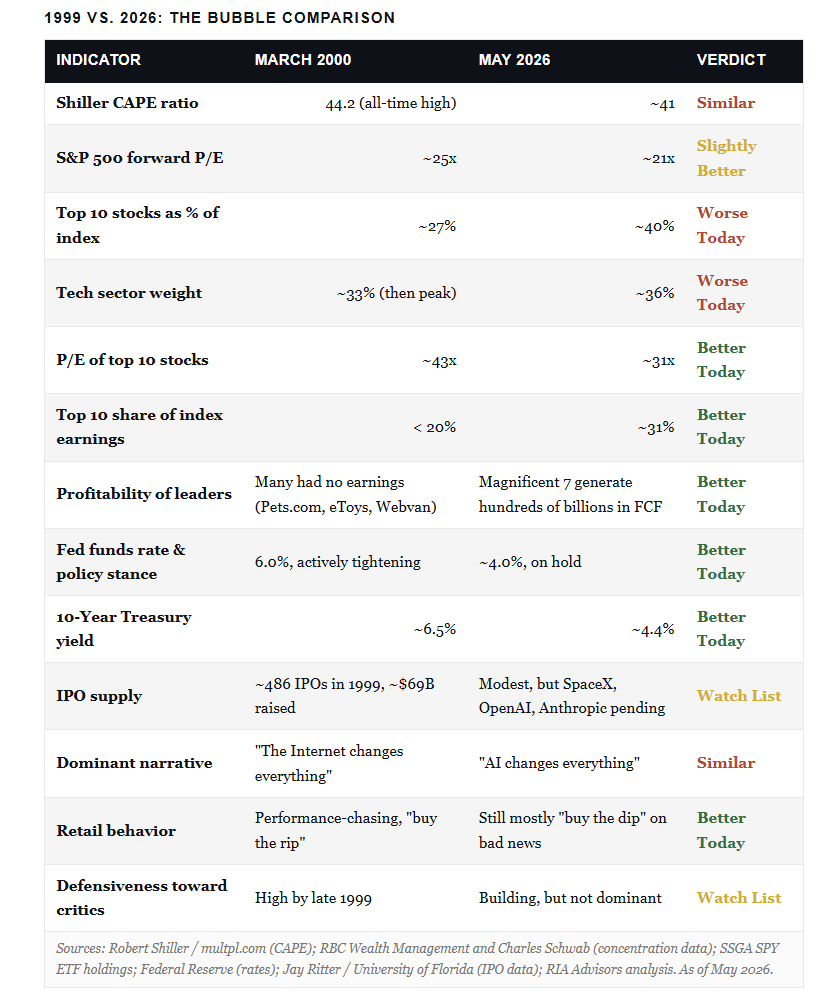
Read the verdict column carefully. Out of 13 indicators, four flash similar or worse than 2000, six look genuinely better, and three sit on the watch list. That’s not a green light. It’s also not 1999 with a new ticker symbol. The honest read is that we have a stretched market with a single dominant narrative and severe concentration, but with profitability, monetary policy, and retail behavior in better shape than they were at the last comparable top.
The piece that worries me more than the headline P/E is concentration. When the S&P 500 owes most of its return to a handful of stocks, you don’t actually own a diversified U.S. equity portfolio. You own a thematic AI bet dressed as an index fund. That’s the exposure most readers should be measuring carefully right now.

How to Stay Invested Without Catching a Falling Knife
Bubbles, real or imagined, create a behavioral problem more than a portfolio problem. The behavioral problem is that investors flip from “all in” to “all out” based on the week’s headlines. Both of those positions are usually wrong. Stocks aren’t a light switch. The decision is rarely between fully invested and fully in cash.
What’s actually worked through every prior bubble cycle is straightforward.
- Stay invested in a diversified mix you can defend in any tape.
- Trim what’s run, add to what hasn’t.
- Hold meaningful positions in assets that behave differently from the popular trade, including bonds, value stocks, and, most importantly, cash, which gives you an opportunity.
- Above all, define in advance what would force you to reduce risk, and write it down.
I’ve been arguing for some time now that bonds remain the best portfolio stabilizer for most investors, even after the 2022 drawdown. In a real equity unwind, bonds historically offset stock losses through the duration trade as the Fed cuts in response. That’s the relationship that briefly broke down in 2022 because both stocks and bonds were repricing higher inflation at the same time. In a true bubble pop scenario, when growth and inflation expectations both collapse, the negative correlation tends to reassert itself.
The other rule is worth repeating. Rebalancing is not market timing. Selling some of your winners and buying some of your laggards forces you to do something contrarian on a calendar, not on a hunch. Investors who rebalanced annually from 2000 to 2002 still suffered, but suffered far less than those who rode the Nasdaq concentration into the abyss.
Free Resource: If you want the full framework we use to stress-test client portfolios for concentration risk, download our RIA Portfolio Risk Guide. It walks through the same checks our team runs every quarter.
The Signals That Mark the End
What actually triggers the unwind, in past bubbles, is rarely the thing analysts spend the most time worrying about. The Fed didn’t pop the Nasdaq with the warnings of 1996. The Fed popped it with the 1999 and 2000 rate hikes. The Bank of Japan popped its bubble by raising the discount rate from 2.5% to 4.25% in late 1989. In 2007, a small wave of subprime mortgage delinquencies sparked the contagion. The catalyst is usually a tightening of liquidity, not a change in the narrative.
Several signs tend to cluster near the top:
- First, a flood of new stock issuance. SPACs in 2021. Internet IPOs in 1999 and early 2000. When the supply of speculative paper finally meets demand, prices roll over. Lamont himself has flagged issuance as the single signal he’s watching most closely right now. With multiple AI-era giants reportedly preparing to go public, that signal is worth tracking week to week.
- Second, a shift from “buy the dip” to “buy the rip.” Healthy bull markets see investors add on weakness. Late-stage bubbles see investors pile in on strength because they’re afraid of being left behind. That FOMO behavior is the textbook performance-chasing pattern.
- Third, mainstream financial coverage that stops debating valuation entirely. When the question “are we in a bubble” disappears from major publications and gets replaced by exclusive feature stories on the personal lives of momentum traders, the top is usually close. We aren’t there yet, but we’re closer than we were a year ago.
- Fourth, a credit event. Bubbles don’t usually pop from inside the asset. They pop because something in the financing chain breaks. In 2000, it was margin calls and burning cash balances. Then, in 2008, it was subprime credit. In 2021, it was the SPAC unwind that started taking down low-quality issuers.
The next pop, whenever it comes, will likely be triggered by stress somewhere in private credit, leveraged loans, or AI infrastructure financing rather than in the equity market itself.
The bottom line is that you don’t need to know exactly when the music stops. You need to know what your portfolio looks like when it does. That’s the question to ask yourself this week, well before the question becomes urgent.