
🔎 At a Glance
- Is The Momentum Crash Over?
- Market Brief & Technical Review
- From Lance’s Desk: AI Bear Case: What Skeptics Get Right And Wrong – RIA
- Market stats, screens, and risk indicators
🏛️ Market Brief – Eight Sectors Higher, Index Still Lower
The S&P 500 closed the week at 7,489.72, up 1.1%; however, that headline hides nearly everything that mattered.
“Despite a hopeful bounce to end the month, it was a bloodbath for most assets. It was the Nasdaq’s worst July in 22 years, bonds’ biggest July yield spike since 2005, and oil’s biggest July jump in over 30 years.” – Zerohedge
While the S&P remains close to its all-time highs, the momentum factor fell 2.2%, and the semiconductor sector fell 4.2%. Conversely, the average stock, measured by the equal-weight index, added 0.7%, which is why an index can climb while its leadership breaks, and that is precisely what happened.
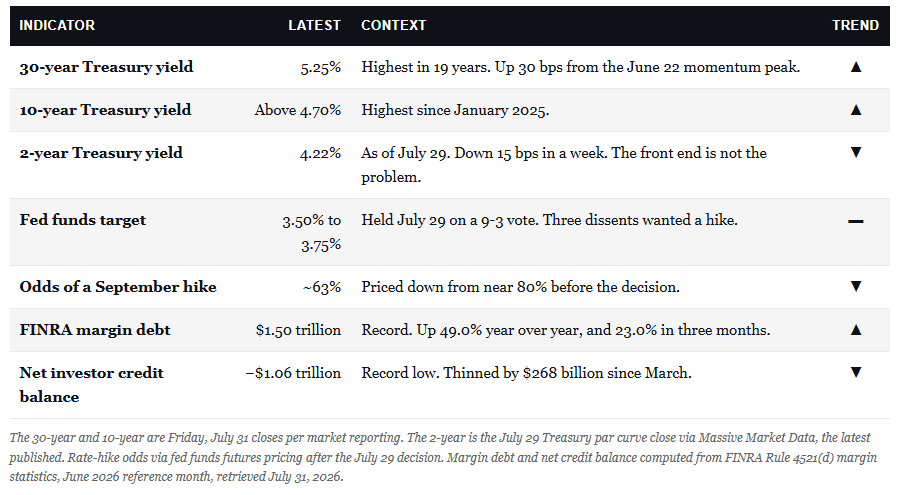
The engine was at the long end of the curve. The 30-year Treasury closed Friday at 5.25%, up roughly 4 basis points on the day and the highest yield since 2007, with the 10-year pushing through 4.7%, its highest since January 2025. Both moved after oil jumped sharply higher amid the re-escalation in Iran, and the FOMC held the funds rate at 3.50%-3.75% for a fifth straight meeting.
With no “forward guidance” from the Fed, now-rudderless bond traders dumped bonds on expectations of higher inflation driven by oil prices. The bond market read that combination as a Fed willing to let inflation run, and repriced the term premium accordingly.
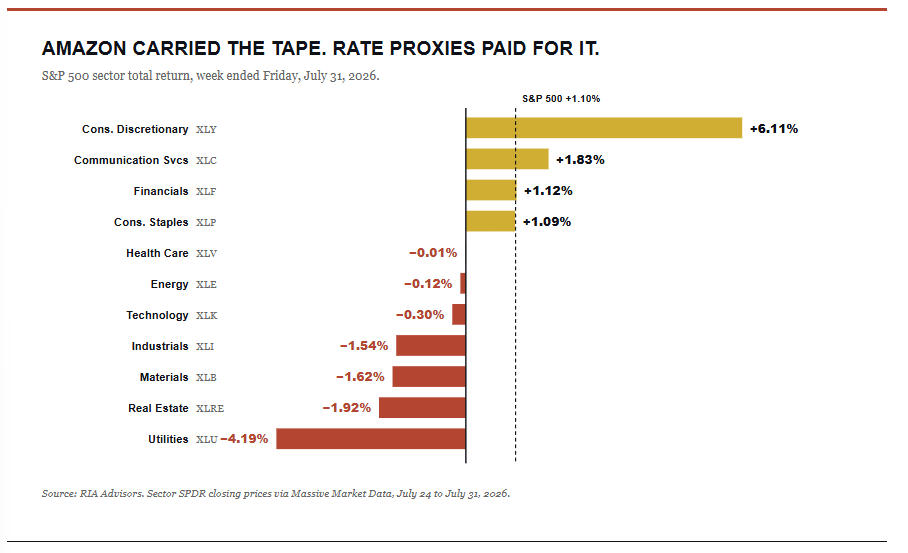
As shown, the spike in rates impacted rate-sensitive sectors the most, with Utilities falling 4.2% and real estate 1.9%. Consumer discretionary gained 6.1%, though that is an Amazon story rather than a consumer story.
The Megacaps were a story of the “haves and have-nots.” Thursday, Microsoft rose 15.5%, and Meta fell 8.0%. Friday, Amazon rose 15.3%, and Apple fell 7.4%. Two consecutive sessions in which one megacap gained roughly 15% while another dropped 7% or more. Microsoft and Amazon showed strong revenue growth in the cloud sector, supporting their Capex spend, while Meta and Apple showed concerns.
Underneath, the macro data cooperated with the bulls, and the bond market ignored it. Second-quarter GDP grew 1.5% against a 2.1% estimate. June core PCE fell 0.1% on the month and sits at 3.3% year over year. That is disinflation alongside slowing growth, which normally argues for lower yields, not a 19-year high in the 30-year.
Let’s dig into the technicals.
📈Technical Backdrop – Below The 50-Day, Testing Support
The S&P 500 ETF (SPY) closed Friday at 747.03, up 0.72% on the session and 1.1% on the week. The number that matters is 744.99. That is the 50-day moving average, and Friday finished 0.27% above it after three sessions below. The index reclaimed its first line of defense on the last day of the month.
Reclaimed is not confirmed. Momentum snapped back hard, but the trend signals have not flipped. RSI(14) closed at 53.0, up from 38.7 on Wednesday, which is neutral rather than strong. Williams %R(14) sits at −32.3 after printing −98.6 on Wednesday, among the deepest oversold readings of the year. MACD remains below its signal line and below zero, at −0.80 against −0.02, though the histogram improved from −1.52 to −0.78. That describes a bounce inside a damaged trend.

Volume supports the move without validating it. Friday traded 60.8 million shares, 1.27 times the 20-day average, and the session ranged from 737.68 down low to 748.89 high before closing near the top of it. Buyers showed up on the dip. Twenty-day realized volatility is 12.4% annualized, still low, meaning the tape is pricing very little risk into a 19-year high in long rates.
However, as we have noted previously, we are paying attention to market breadth. The market-cap-weighted index beat the equal-weighted index this week, 1.1% vs. 0.7%, reversing the prior month’s pattern. Semiconductors fell 4.2% while the index rose. Micron lost 5.9%, and SanDisk lost 5.1% on Friday alone, while the S&P gained 0.7%. Leadership is still contracting, not broadening.

From a trading perspective, the 50-DMA at 744.99 is the pivot, and it sits 0.27% under Friday’s close. While the market reclaimed that previously broken support, it needs to maintain that recovery this week. If you added any positions on Thursday or Friday, you can set a stop just below the closing price. A close below opens the July 29 low at 729.10, and under that, the 200-DMA at 700.39 is 6.2% lower. To the upside, the June 2 record close of 759.57 is only 1.7% away, and I would trim into it rather than chase through it. A marginal new high on contracting leadership is a distribution setup, not a breakout.
Watch 744.99 at Monday’s open. Holding it keeps this bounce alive into the record high. Losing it tells you that Thursday and Friday were the rally to sell.
🔑 Key Catalysts Next Week
This is jobs week, and it arrives at the worst possible moment for a market that just watched the 30-year hit a 19-year high. Three FOMC members voted to hike on Wednesday, and that was all the bond market could focus on, and now Fed Funds Futures put September odds near 63%. I think this is a misaligned repricing given the weaknesses in recent economic data, and Friday’s July employment report will likely trigger a sharp reversal.
However, heading into that report, economic data will build throughout the week, with Wednesday carrying the heaviest data load, including ADP at 8:15 a.m. and ISM Services at 10:00. Notably, the services print matters more than usual because services inflation is what the dissenters keep citing.
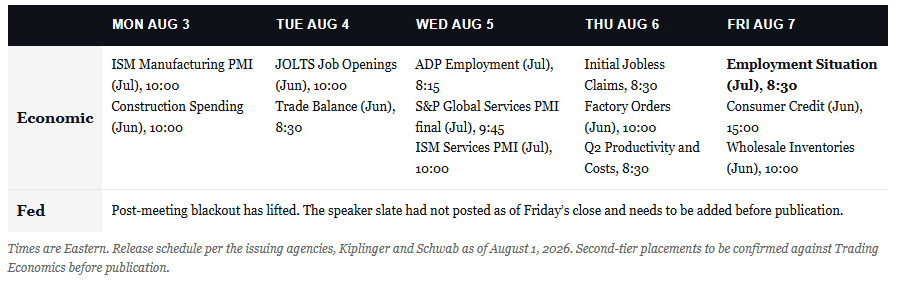
As we discussed in “Wage Growth As A Leading Inflation Indicator,” watch the wage line rather than the headline count. Payrolls came in weak in June, and the unemployment rate sits at 4.2%, so a soft headline is already partly discounted. Personal income already printed a weak number, and I expect that average hourly earnings may show weakness as well. That will move the long end because that is the series the three dissenters are pointing to.
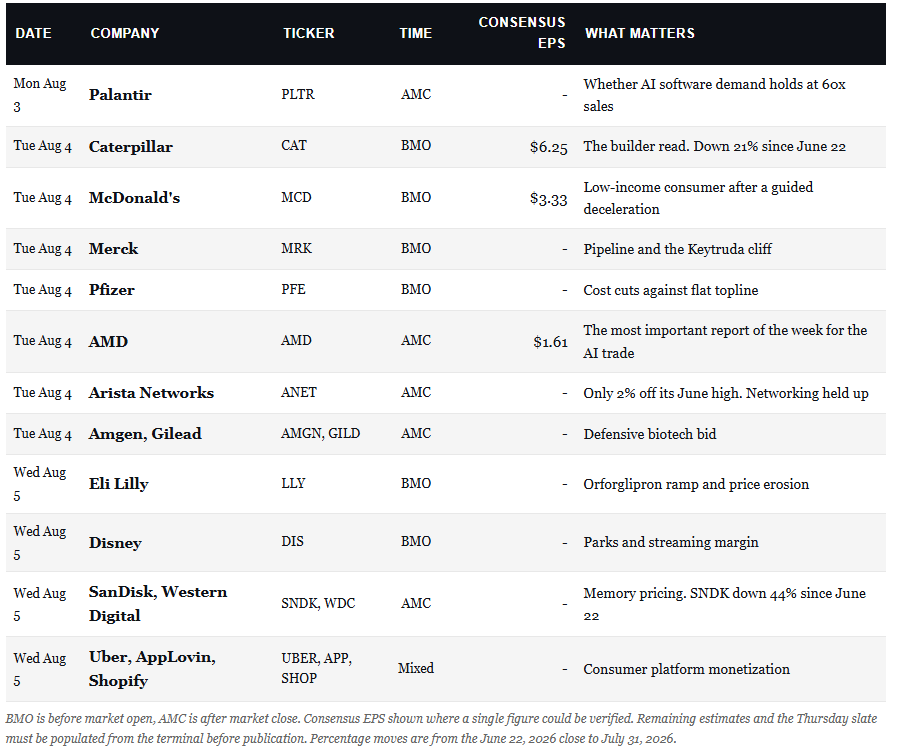
From the earnings front, the calendar is finally broadening beyond megacap technology and into the real economy. Caterpillar reports Tuesday before the open, and after a 21% decline since June 22, it is the cleanest read available on whether the data center build is actually converting into equipment orders. AMD follows Tuesday after the close and is the most consequential report of the week for the AI complex. Memory gets its verdict on Wednesday when SanDisk and Western Digital report, and SanDisk carries a 44% decline since the June peak into the print. Eli Lilly and Disney round out Wednesday morning.
Friday’s employment report is the event, and the asymmetry is uncomfortable. A cool wage number gives the long end room to retreat, which is the fastest available path to repairing the momentum complex. With bonds already deeply oversold on both a daily and weekly basis, the odds of a reversal are elevated. From a short-term trading perspective, a bet on longer-duration bonds may be the non-consensus trade that catches the market by surprise.
Need Help With Your Investing Strategy?
Are you looking for comprehensive financial, insurance, and estate planning services? Need a risk-managed portfolio management strategy to grow and protect your savings? Whatever your needs are, we are here to help.

💰 Is The Momentum Crash Over?
What a week that was. As I discussed on Thursday on the Real Investment Show, the average retail investor portfolio is likely faring far worse than the broad market index. The momentum crash we just lived through was the fastest on record. It ended last Thursday with a $45 billion hedge fund handing its entire public equity book to Citadel in a single block trade.
None of it should have been a surprise. On June 22, in The Technical Backdrop: When Flows Meet a Hawkish Fed, I wrote that a market running on flows, leverage, and shrinking leadership could melt up into July. It could also reverse hard the moment those mechanical buyers turned into sellers. The close of that piece was blunt, and was published on the exact day momentum peaked. It is also named the mechanism.
“Lastly, watch the long end of the curve. If Warsh’s signal keeps the ten-year climbing, the most expensive, most crowded, most rate-sensitive corner of this market, the same one soaking up forty cents of every dollar, is the corner that pays for it first.“
The most crowded corner of this market, the one soaking up forty cents of every S&P 500 dollar, would pay for rising yields first. That is precisely what happened. Two weeks ago, Momentum Meltdown Catches Traders By Surprise flagged the same divergence in miniature. Last week, The AI Capex Bill Comes Due walked through the $800 billion megacap air pocket. The only question left is whether the correction is finished or whether this was the first act.
Momentum Crashed. The Average Stock Did Not.
Start with the magnitude, because the numbers are without precedent. Morgan Stanley’s sector-neutral momentum index fell 17.4% over four sessions, the worst four-day stretch in the history of the series. The comparable declines were roughly 11% after the dot-com peak and again in the 2022 inflation bear, and 14% after the Covid crash. The technology and media slice of that basket dropped 36% in four days, against a prior record near 20% set in the 1999 to 2001 unwind.
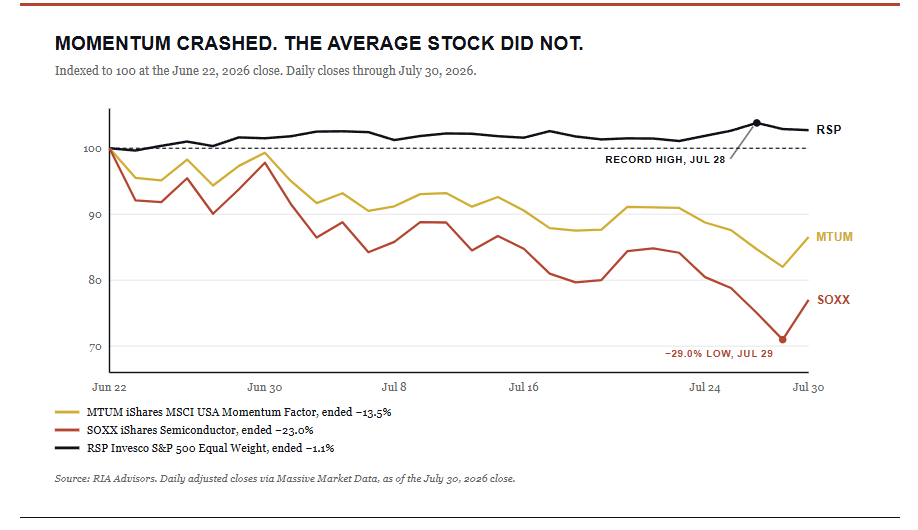
You can see the same thing in instruments you can actually trade. The iShares Momentum ETF fell 18.0% from its June 22 peak to its July 29 low, and semiconductors, measured by SOXX, surrendered 29.0% over those same twenty-five sessions. Momentum broke. The equal-weight S&P 500 closed at a record high on July 28. Right in the middle of the wreckage.
While for many retail investors, it may “feel” like a market crash, it wasn’t. It was a rotation, and leveraged traders were liquidated.
None of that is new. In More Market Wisdom: Jesse Livermore, Part 2, we walked through how leadership rotates across cycles. The Nifty Fifty became the laggards of the late 1970s. Technology dominated the late 1990s, then delivered a lost decade. Energy was close to unownable from 2014 through 2020, then led the market in 2021 and 2022. Staying rigidly committed to yesterday’s leaders is the most reliable path to underperforming in the next cycle.
Diversification is what converts that rotation from a portfolio problem into a portfolio feature. We covered the practical version in Momentum Strategies, and Physics: Mass And Velocity Matter, and the structural version in The Passive Aggressive Market, where investors rotate hard between factor ETFs and still call it passive investing. Last week priced the difference. Own the equal-weight index, and you made a record high on July 28. Own the momentum factor, and you gave back 18%.
Leverage Was The Mechanism. Rates Lit The Fuse.
During Thursday’s meltdown, I called Michael Lebowitz, and we discussed that it “felt” as if someone was being liquidated. It turned out that a hedge fund, Situational Awareness, which ran leverage roughly 4x its equity base through total return swaps, was the victim. Within a day, it liquidated nearly 3/4 of its holdings.
It is the structure that matters. Prime brokers hold the physical shares while the client takes the economic exposure, so the position never appears in a public filing, and no single broker sees the whole book. Goldman Sachs, JPMorgan, and Bank of America were the counterparties here.
Here is the crucial point: When the collateral fell far enough, the “Prime Brokers” decided to sell. Not the fund.
We have written that sentence before, in Margin Debt Surges As Bulls Leverage Bets:
That process is at the discretion of the broker-dealers that extended that leverage in the first place.
So what tipped the collateral? Rates. After the FOMC meeting this past week, the front end of the curve barely flinched. The long end did the damage, with the 30-year closing that day at 5.20%, its highest level in 19 years. Nothing in this market is more sensitive to the long end than an unprofitable growth stock bought with borrowed money.
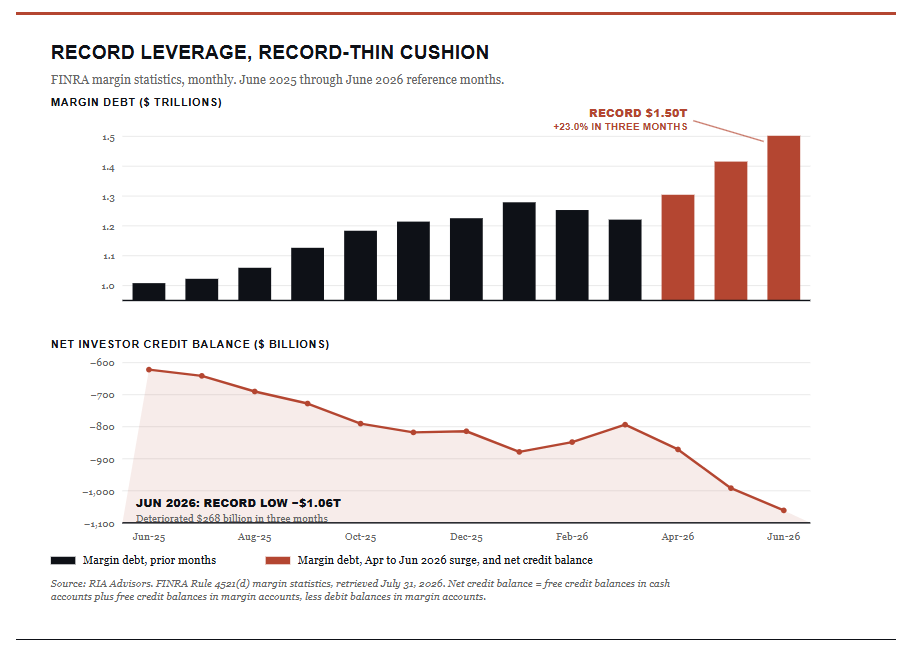
The backdrop was already stretched thin. Margin debt set another record in June at $1.50 trillion, up 49% from a year ago, while the net investor credit balance sank to a record negative $1.06 trillion. That is the thinnest cushion against forced selling ever recorded, a point we walked through in Margin Debt Risk: The Ratios That Mislead Investors.
The timing in the chart below is what matters. Leverage actually fell from January into March. Then it went vertical. Margin debt jumped 23.0% in the three months through June, and the credit cushion thinned by $268 billion over that same stretch. That build topped out precisely as momentum did.
Situational Awareness was not the only leveraged buyer in that corner, either. Citadel’s desk put levered ETF assets at a record $218 billion in June, up roughly 60% from the end of March, with semiconductor-linked leverage nearly tripling. We mapped where that money was pointing in A Supply Tsunami Is Coming.

The Daily Shot tracks a slightly wider universe, and its version shows the round trip. Net market exposure across US levered and inverse ETFs peaked near $436 billion in mid-June, about 3.4 times its level in the summer of 2021. It has since fallen 27%, and fund assets are down 25% from their peak.
That is the retail mirror of the de-grossing of the reported prime desks. It also explains why Thursday had so much fuel. Two dollars in a 3x fund carries six dollars of market risk, so when that complex shrinks, the selling is mechanical, and then it stops.
The Fundamentals Never Broke
Here is where the opportunity argument lives, and it deserves a fair hearing. Microsoft grew Azure revenue 43% in constant currency, above a 40.2% estimate, and surpassed $100 billion in annual Azure revenue for the first time. Amy Hood told the Street that capital spending will grow again in fiscal 2027. Amazon lifted its 2026 capex plan toward $220 billion on an AWS-driven beat.
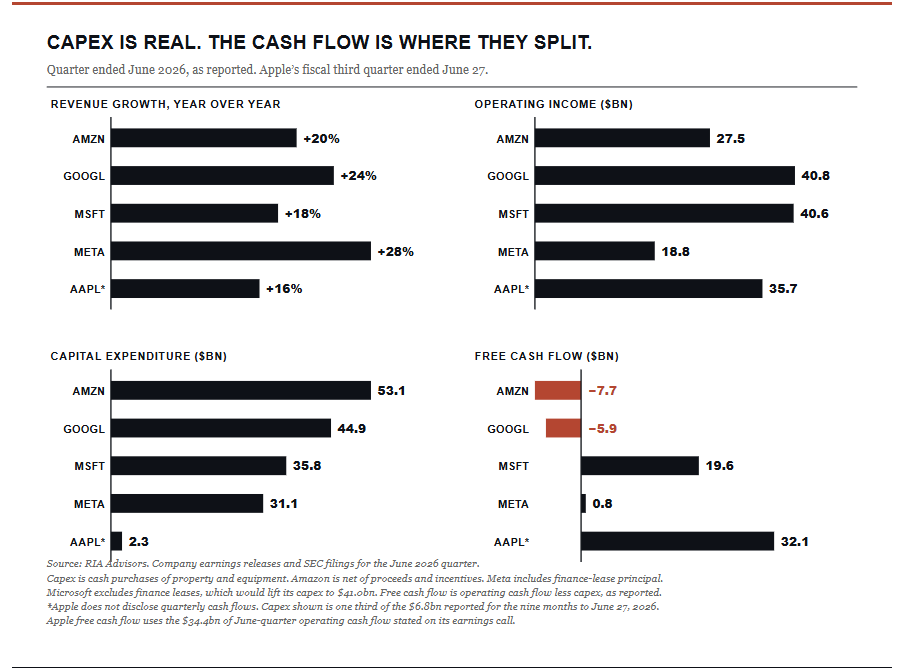
That scorecard kills the simple version of the story. Amazon spent the most of anyone, $53 billion against $45 billion of operating cash flow, printed the worst free cash flow in the group, and jumped about 9% after hours. Alphabet spent less, burned less, and fell 7%.
So, why the difference? It clearly was not an issue of “cash flows” as the narrative suggests. What separated them was evidence that the spending is already earning inside the operating line.
- AWS grew 37% with segment operating income up 64% and margin back to 39.4%.
- Azure grew 43% with remaining performance obligations at $678 billion.
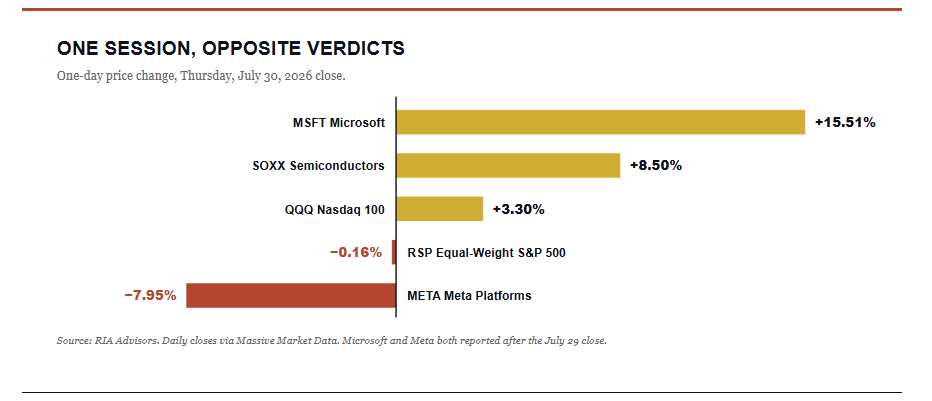
However, Meta went the other way, with operating income down 8% and the margin down from 43% to 31%. After that, the market did the talking with Microsoft rising 15.5% on Thursday, and Meta falling 8.0% in the same session. This wasn’t surprising after Meta missed by more than a $1 per share, guided Q3 revenue to the low end, and declined to commit to a 2027 spending figure.
The market is not punishing capital spending, nor rewarding cash flow. It is paying for proof that the spending is already earning inside the operating line. Read that again, because it is the entire trade.
Both halves of that scorecard are distorted by a single timing mismatch, which I laid out in “AI Capex Depreciation Risk Is The Catch To Record Earnings.” Cash leaves now, so free cash flow understates these businesses. Depreciation lands later, so operating income flatters them. Roughly $760 billion in spending this year is offset by only about $211 billion in recognized depreciation.
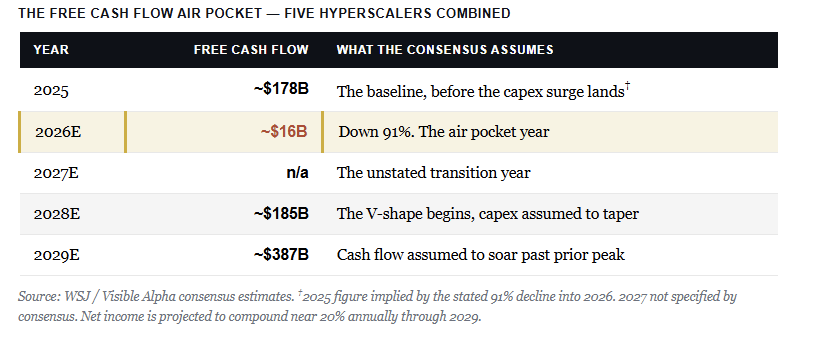
So is the market mispricing Alphabet, which is investing, against Apple, which is not? Partly, yes. Alphabet was sold on an in-line core quarter, not a broken one, and 82% cloud growth against a contracted backlog is not a sign of a business in trouble. But that is not a free option either.
Consensus already assumes free cash flow snaps back from roughly $16 billion this year to $387 billion by 2029. That snapback is an assumption, not a result. And Microsoft just stretched the useful life of its data centers from fifteen years to twenty-five, which cuts reported depreciation without changing a single server. Demand is REAL. What broke was the financing stacked on top of it, and who pays the depreciation bill remains unsettled.
Is The Correction Over? The 2000 Playbook Says No.
So, for the one question everyone wants an answer to: “Is it safe to go back into the ‘momentum’ waters?”
BTIG’s Jonathan Krinsky called time on the momentum crash Thursday morning, and on the bounce I think he’s right. Goldman’s high-minus-low momentum index had fallen 23% below its 200-day average after sitting 40% above it in mid-June. It has rarely spent much time beyond 20% below that line in twenty-five years. Stretched is stretched. A dislocation that extreme produces a Thursday almost mechanically, and Microsoft’s print gave buyers a reason to show up at once.
However, a bounce is not a bottom. Krinsky’s own 2000 comparison is the useful part of that note. One month past the dot-com peak, the SOX had fallen 35%. It then rallied roughly 37% and still went on to test its 200-day moving average. Semiconductors closed Thursday 23.0% below the June 22 peak, 11.1% under the 50-day moving average, but still 25.6% above the 200-day.
Sit with that last figure for a second. Even after the fastest momentum crash on record, SOXX trades a quarter above its own long-term trend line. Trapped longs from June do not sell on the first bad day. They sell into the first rally that gets them close to even.

What Should Investors Do Now
Okay, what do we do now heading into the seasonal weak months of August and September? First, treat this bounce as a gift for repositioning, not an invitation to re-risk. The forced seller is gone. But Citadel holds a large block of the same paper and has no obligation to keep it. Secondly, if the 30-year keeps threatening a multi-year breakout, that adds to the risk, and that one variable decides whether the AI complex gets a durable bid or another leg lower.

However, there are opportunities in the rubble, and the following is a quick screen to start from, grouped by what each name actually does in the buildout. Look at the last column before anything else, because Friday rewrote it. Five names now sit above where they were at the momentum peak, and the top two are Microsoft and Amazon, the two heaviest spenders in the group. While some of the selling was certainly due to the liquidation of Situational Awareness, not all of it was. Everything that builds, supplies, or finances the buildout, without yet showing a return, is still down 10% to 47%.
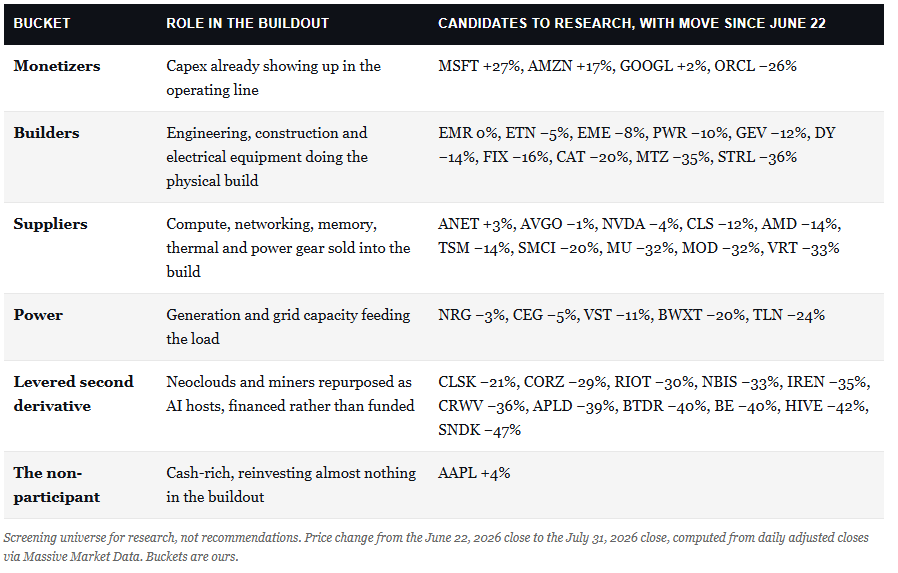
Two things follow. The levered bucket is already flushed, so the case for trimming it is no longer about valuation; it is about which balance sheets survive a retest. And the builders and suppliers are where contracted revenue meets washed-out prices, which is the part of this list I would spend the weekend on.
My read is a tradable rally that fails that potentially fails, particularly if rates continue to push higher this week. If I’m wrong, I’m wrong by buying quality early. That’s the cheaper mistake. We continue to suggest using strength to upgrade quality, cutting names whose only thesis was price momentum, and holding cash to act on a retest of support.
Trade accordingly.
🖊️ From Lance’s Desk
This week’s #MacroView blog digs into the AI “bear case” isn’t one argument; it’s three. Burry on earnings. Bernstein on circular financing. MIT on revenue. Two are half right. One falls apart on the data.

Also Posted This Week:
- Carnage In Hyperscaler Credit: Really? – RIA – by Michael Lebowitz
- Are US Treasuries Still A Safe Asset? – RIA – by Lance Roberts
📹 Watch & Listen
Markets are testing a critical technical level after failing to reclaim the 50-day moving average. Is this a routine pullback before new highs, or the beginning of a deeper correction?
Subscribe To Our YouTube Channel To Get Notified Of All Our Videos
📊 Market Statistics & Analysis
Weekly technical overview across key sectors, risk indicators, and market internals

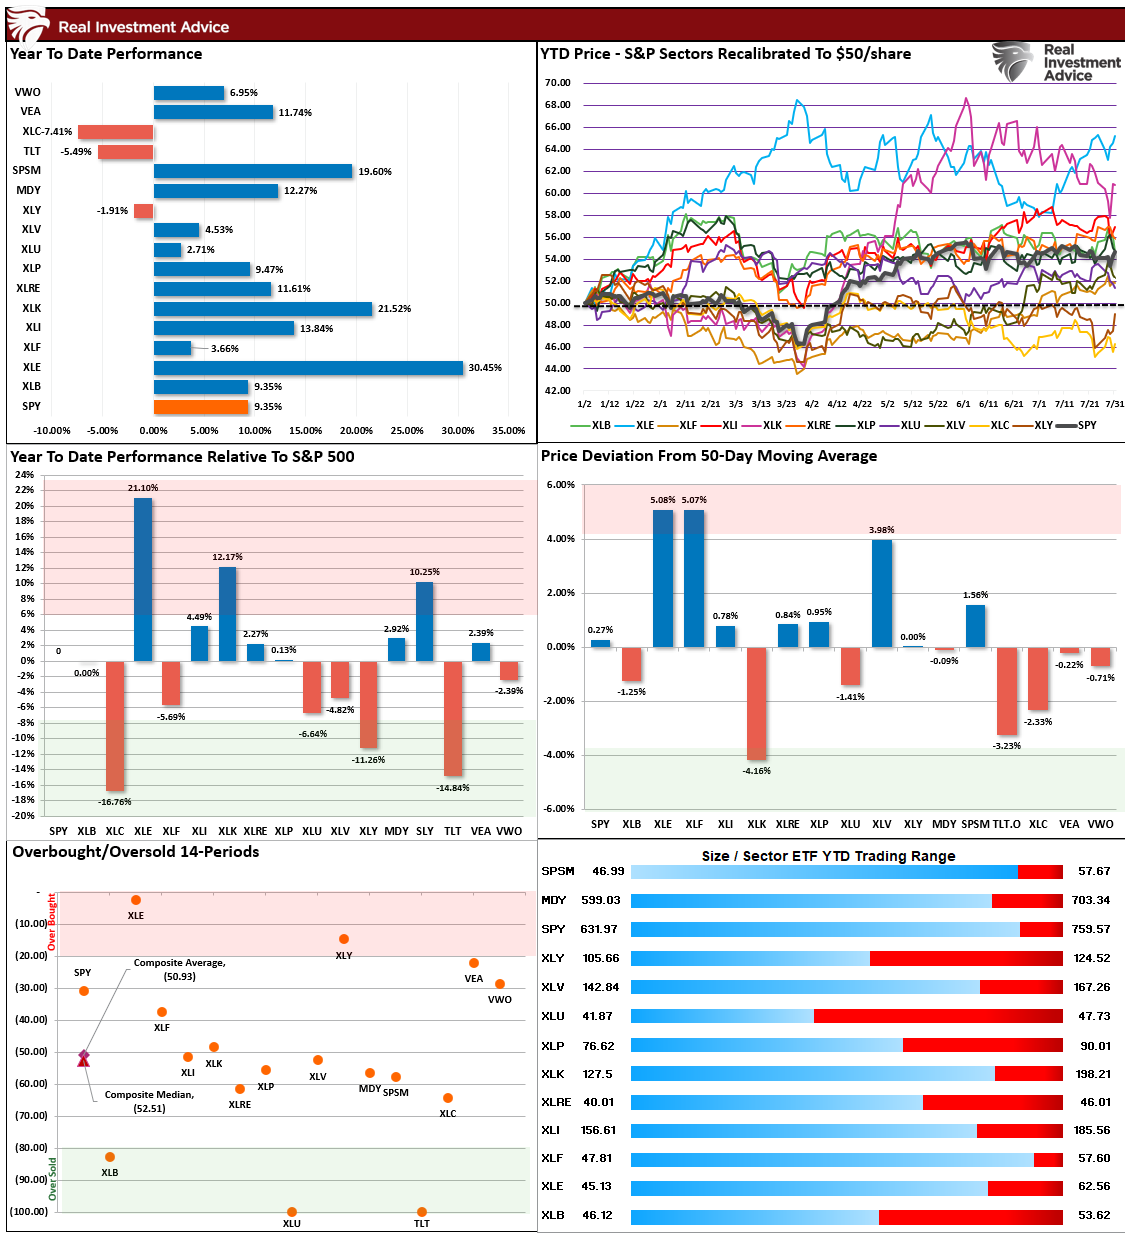
💸 Market & Sector X-Ray: Market Gains Ground
The market action this week turned at the end of the week with the market reclaiming the 50-DMA. Energy and Technology led the way. One of the main concerns remains the rapid rotation in the market with money flows jumping from one sector or market to the next, while the broad market really doesn’t gain much ground. Remain cautious into next week.
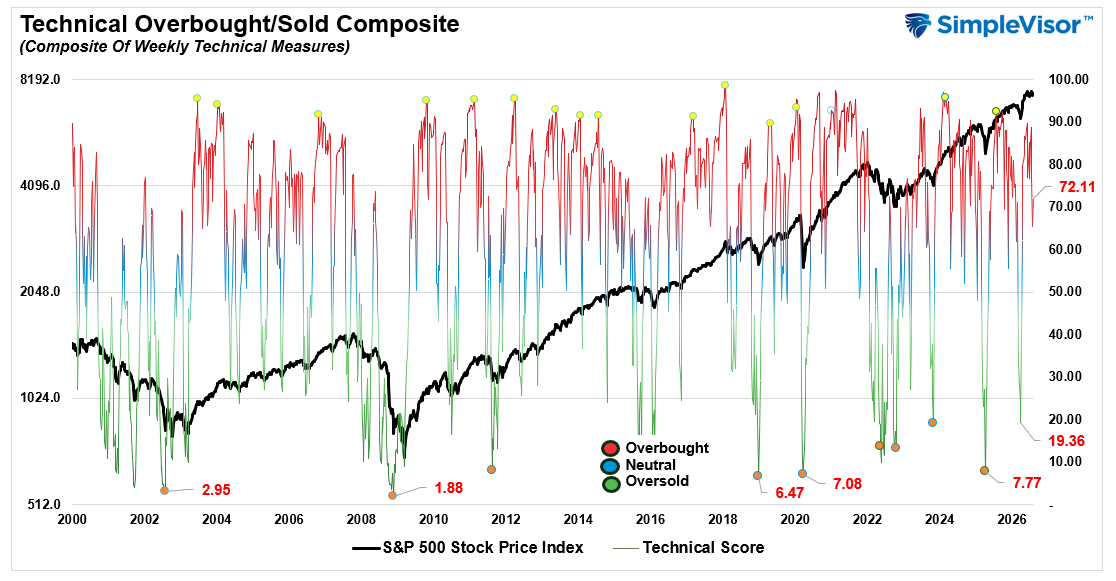
📐 Technical Composite: 72.11 – Still Bullish
The technical condition ticked up this past week as the Megacaps put in a strong run at the end of the week. The market is not overbought but is not oversold either, and sentiment remains bullish for now.
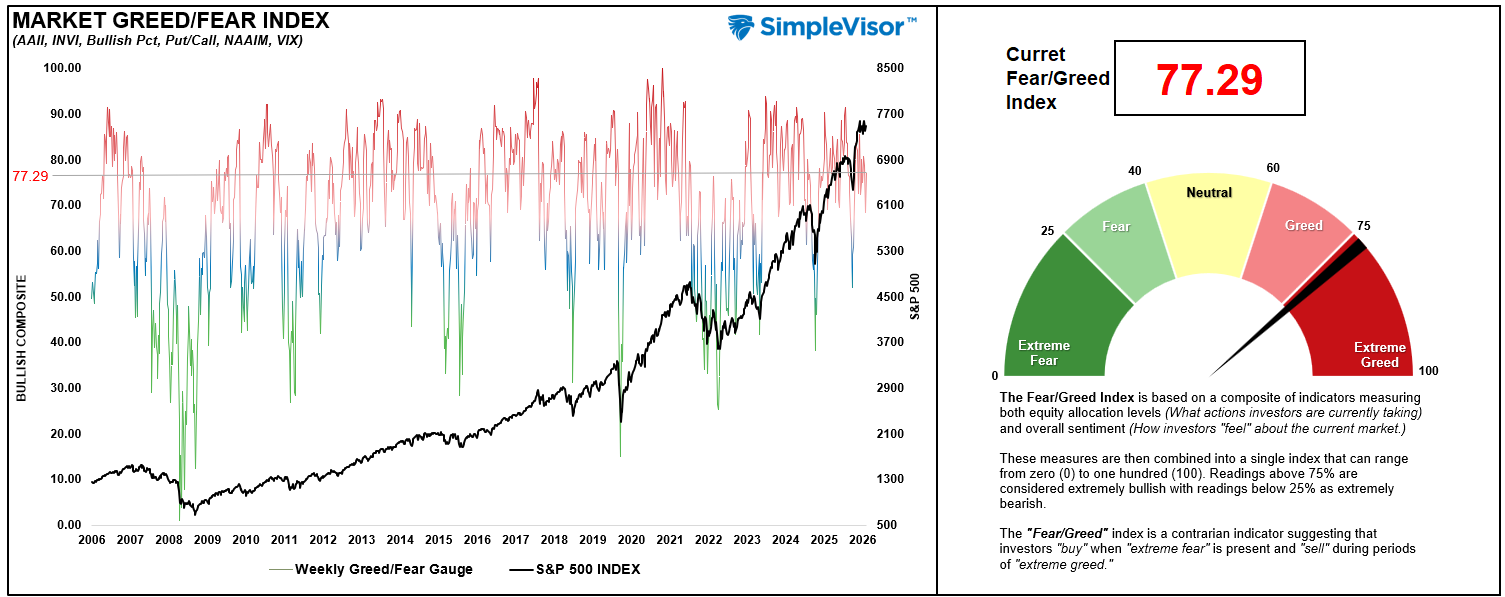
🤑 Fear/Greed Index: 77.29 – Back To Extreme Greed
Earnings reports from the large cap stocks pushed the market higher and brought investor positioning and sentiment along with it. From a “how are investors positioned” view, investors are still very bullish the market and show now real signs of concern.
🔁 Relative Factor Performance
We noted two weeks ago that “compression of factors has been evident…that clustering will shake itself out sooner than later, and the opportunity will be in which factors start to take the lead.” That happened at the end of this past week with some of the Megacap names leading the charge. Magacaps remain a decently oversold factor so we may see more upward bias next week.

📊 MFBR Index (Money Flow/Breadth Ratio Indicator)
NEW! MFBR Index: The Money Flow Breadth Ratio (MFBR) model is a rules-based equity allocation framework that uses weekly S&P 500 money flow data to generate buy, sell, and neutral signals. The MFBR systematically adjusts portfolio equity exposure in response to the direction and persistence of institutional capital flows. It aims to reduce drawdowns while capturing the majority of market upside.
“As of July 31, 2026, with the S&P 500 at 7,489.72, the Money Flow Breadth Ratio (MFBR) stands at 70% and rising. This places the indicator in extended BUY territory (above 70%), triggering a BUY signal. The prior week reading was 65%, representing a 5% decline over the trailing four weeks.
The model currently recommends HOLDING exposure at 67%, a level that has remained since July 10, 2026 (3 weeks). This reflects the grid’s view of current breadth conditions.”

📊 Sector Model & Risk Ranges
The risk range report resets at the beginning of each month. Next week, will get range deviations for August. For now, Energy and Small Caps remain the most deviated from their long term means.

Have a great week.
Lance Roberts, CIO, RIA Advisors