
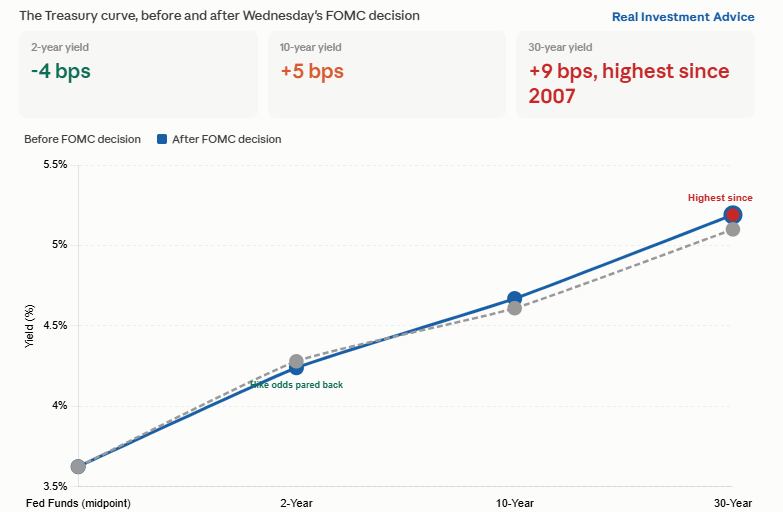
At Wednesday’s FOMC press conference, Chair Warsh made it clear that the Fed’s number one goal is returning inflation to its 2% target. The reaction in the long end of the bond market was one of disbelief. The 2-year yield fell roughly 4 basis points to 4.24%, while long bonds like the 10-year climbed by 7 basis points to 4.67% and the 30-year surged by more than 10 basis points to 5.20%, its highest level since July 2007. The spread between the 30-year long bond and the 3-month bill widened by roughly 20 basis points.
The message embedded in that yield curve steepening is that the market thinks the Fed is too dovish and not willing to combat inflation. As such, they are slightly reducing the odds of near-term rate hikes but, in their place, putting more emphasis on inflation concerns on the long end of the bond curve. While the market may have its opinion on the Fed’s resolve to tame inflation, Warsh was adamant that they will act if necessary. To wit, he stated:
I want to stress, of course, that decisions by this committee matter a great deal, and where necessary and appropriate, we will not hesitate to act.
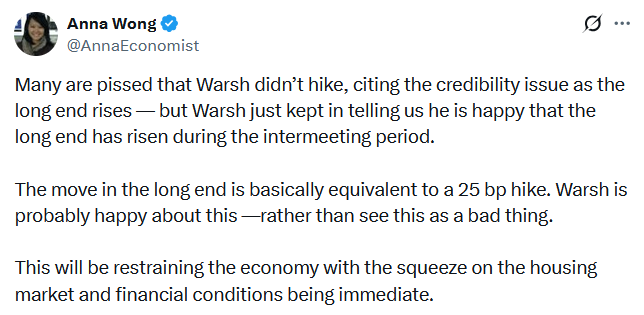
Powell’s Fed may have taken the market message and crafted a more hawkish tone in speeches to quell concerns. Warsh’s Fed may appreciate the market message and be willing to let the market do its work for them. Higher long bond yields will have a negative impact on the economy and inflation. Given that large parts of the recent inflation surge are temporary, a hike might be foolish, but higher long yields may slow the economy and inflation enough to get inflation back to target. Warsh’s Fed may be willing to allow for some temporary discomfort in the bond market, particularly the long end, to meet his inflation target, which will ultimately result in lower yields.
What To Watch Today
Earnings

Economy

Market Trading Update
Yesterday, we covered the megacap wobble and flagged that momentum had rolled over with the 14-day RSI in the mid-40s, leaving room to fall. Today, I want to answer the question that follows: What does midterm-year seasonality do with an oversold Nasdaq?
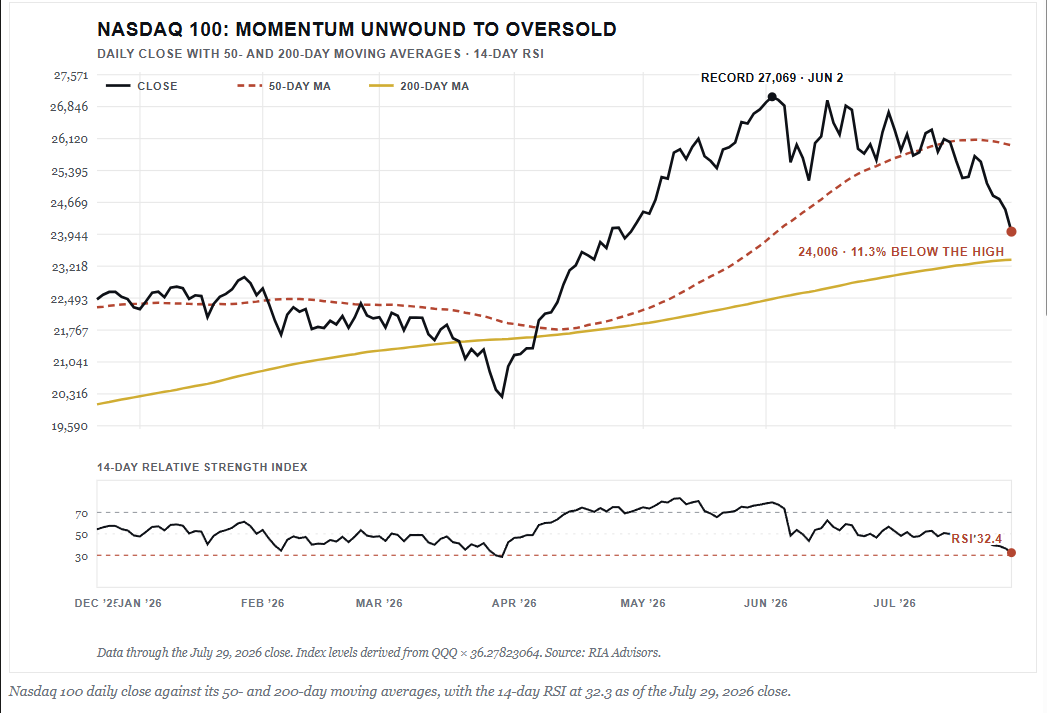
Start with what July actually was. The S&P 500 lost just 2.3% for the month through Wednesday’s close, so the headline reads like a shrug. Underneath, it was a factor crash. Semiconductors fell 23.1%. The momentum factor dropped by 17.4%, technology by 12.6%, and the Nasdaq 100 by 10.1%. Meanwhile, the equal-weight S&P rose 1.4%, energy gained 10.4%, and financials added 5.7%. The average stock had a perfectly good month. The crowded trade did NOT.

That leaves the index and its generals in very different places. The S&P 500 closed Wednesday at 7,311, roughly 2% under its 50-day average near 7,462 and still 4.3% above a rising 200-day average near 7,010. The Nasdaq 100 is the stretched one. At 24,006, it sits 7.6% below its 50-day and only 2.7% above its 200-day at 23,367, down 11.3% from the June 2 record of 27,069. Its 14-day RSI closed at 32.3, with semiconductors at 33.
Now the seasonal question. August through October has been the weakest three-month stretch since 1928, per Bank of America, and in the down years, the average correction runs 7.35%. Goldman Sachs notes that in every midterm year since 1974, the median return from August 1 to election day is zero. Carson’s work adds the timing detail that matters most. Midterm years carry the cycle’s largest intra-year drawdown, and they don’t bottom until August 18 on average, with a median of September 29.
Here’s where the math gets interesting. A full reversion in the Nasdaq 100 to its 200-day is only 2.7% away, a shallow floor by any historical standard. That’s the bull case hiding inside an ugly month. The bear case is that oversold readings resolve lower when the calendar and the flows agree, and Ned Davis flags rising oil alongside rising yields, the same pairing that preceded 1987, 1990, and 2022. Oil is up more than 20% in July.
Then Thursday happened. By late morning, Microsoft had gained nearly 15% on earnings, semiconductors had gained 6%, and the Nasdaq had gained 2.6%, while the equal-weight index had fallen 1.1%. Read that carefully. It’s an earnings-driven snapback in the same handful of names that broke, not a breadth repair, and Apple reports tonight into a Fed that just held with dissents to hike.
So we aren’t chasing this gap higher. We’d rather add quality technology exposure into the Nasdaq’s 200-day near 23,400 than pay up two sessions off a 32 RSI. Keep the cash buffer, hold the defensives that actually paid this month, and let the mid-August window prove itself first. Manage risk at the line, not after it breaks.
What To Watch Today

Microsoft And Meta Beat: Stocks Head In Different Directions
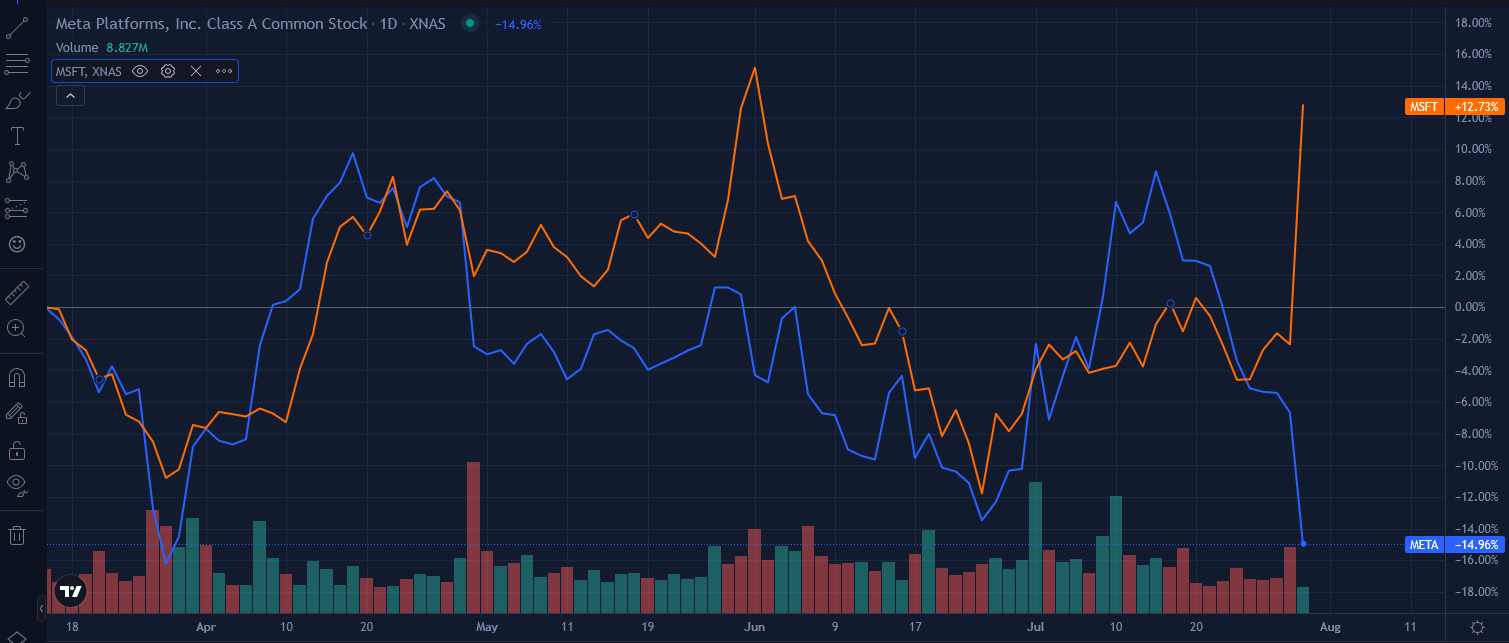
After Microsoft and Meta both easily beat revenue expectations, Microsoft is opening higher by nearly 10% while Meta falls by a similar percentage. The divergence may be confusing at first glance, but looking past the top-line figures, the reaction makes sense.
Microsoft’s revenue rose 18% to $90.01 billion, beating the $87.62 billion consensus, while EPS jumped 30% to $4.74. Azure, its cloud platform, the division investors seem to care most about, accelerated to 43% growth, well above the 40% consensus. Microsoft’s management lowered its capital expenditure outlook slightly. In a nutshell, Microsoft’s spending guidance was positive from a market perspective while the business grew faster than expected.
Meta’s revenue also handily beat expectations, up 28% to $60.80 billion. But net income fell 14% to $15.85 billion, EPS dropped to $6.18 from $7.14 a year earlier, and operating margin fell sharply to 31% from 43%. Some of the earnings disappointment was due to one-time costs related to staff reductions. Meta raised the lower end of its 2026 capex range to $130 billion from $125 billion. Unlike Microsoft, investors got shrinking profitability paired with rising spending.
The market is distinguishing between capex that is converting into accelerating growth and capex that is eating into profits. All that said, we mustn’t read too much into a one-day market reaction to earnings.

Tweet of the Day
New UPDATED Trading Rules With Desktop Printout
“Want to achieve better long-term success in managing your portfolio? Here are our 15-trading rules for managing market risks.”
Please subscribe to the daily commentary to receive these updates every morning before the opening bell.
If you found this blog useful, please send it to someone else, share it on social media, or contact us to set up a meeting.