


In yesterday’s post on “Moral Hazard,” we discussed how Fed actions shifted the “risk appetite” of investors through “perceived” insurance against losses. As we head into a potentially contentious election, market “bulls” are “all in” again as hopes remain high that more “stimulus” will soon come.
Since the Fed intervened in March, investor sentiment has gotten run back up to extremes despite the economy remaining amid a deep recession.
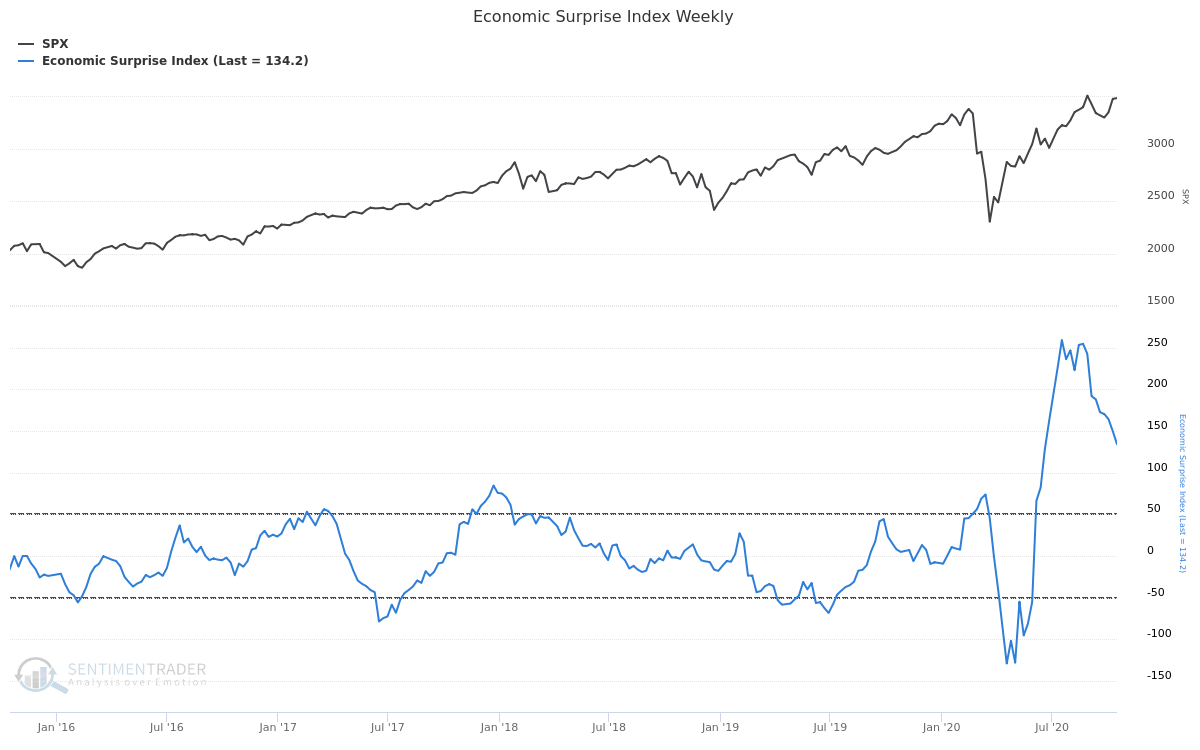
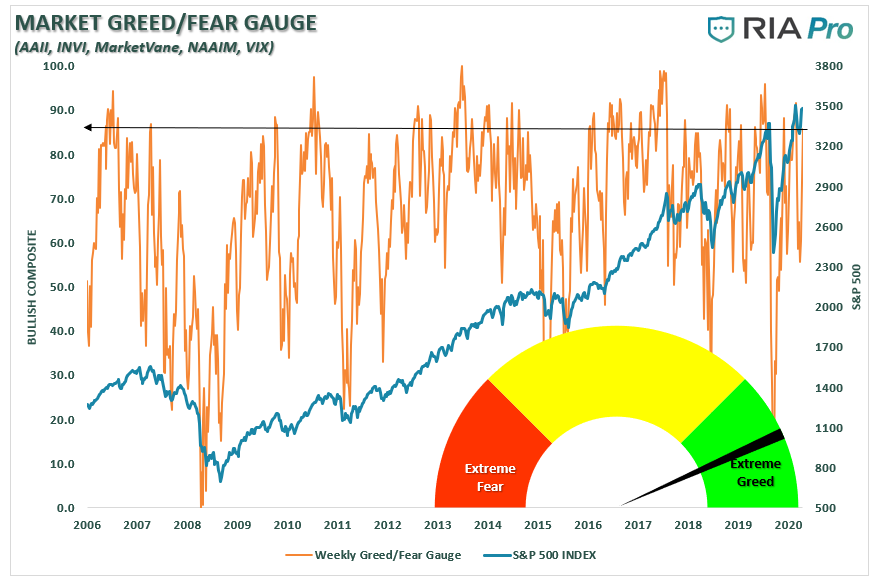
As I noted in this past weekend’s RIAPro Subscriber Newsletter (30-day Risk-Free Trial), both the Technical and market positioning “Fear/Greed” gauges have moved back into more extreme territory following the brief September decline. Such is the case even though “stimulus” remains elusive, the Fed is on the sidelines, and economic growth has begun to disappoint as noted by the Economic Surprise Index.
The technical overbought/sold gauge comprises several price indicators (RSI, Williams %R, etc.), measured using “weekly” closing price data. Readings above “80” are considered overbought, and below “20” is oversold. Given this is weekly data, its readings move slowly and align with short-term peaks and troughs of markets

The “Fear/Greed” gauge is how individual and professional investors are “positioning” themselves in the market based on their equity exposure. From a contrarian position, the higher the allocation to equities, to more likely the market is closer to a correction than not. The gauge uses weekly closing data.

More Sentiment Extremes
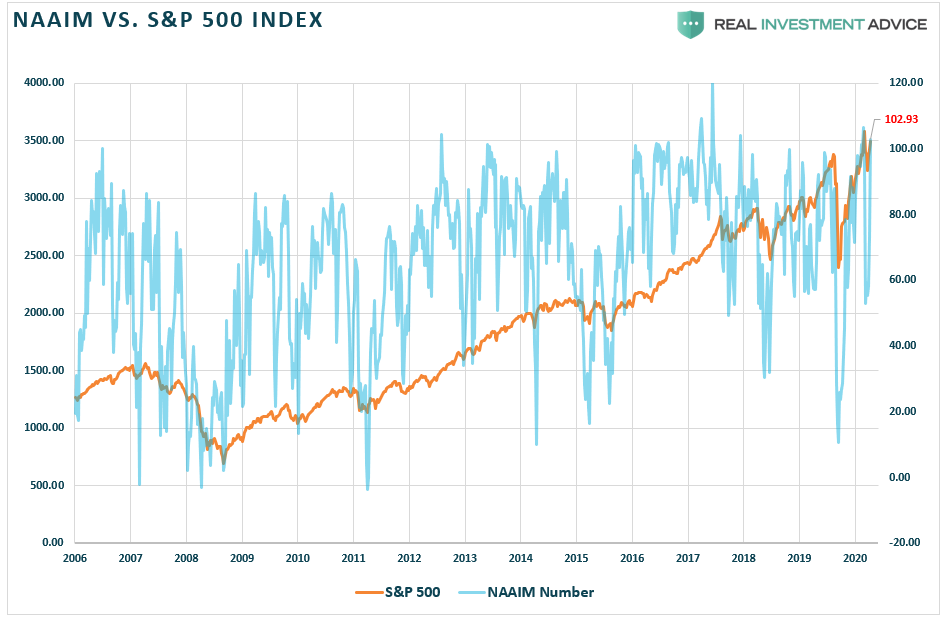
One of the sub-components of the “Fear/Greed” gauge is the NAAIM index of professional investors, which measures the percentage allocation to that group’s equities. Currently, equity allocations of professional investors are back to full weightings. While such doesn’t mean the markets are about to crash, more often than not, their “bullishness” has tended to be an excellent short-term “contrarian” indicator.
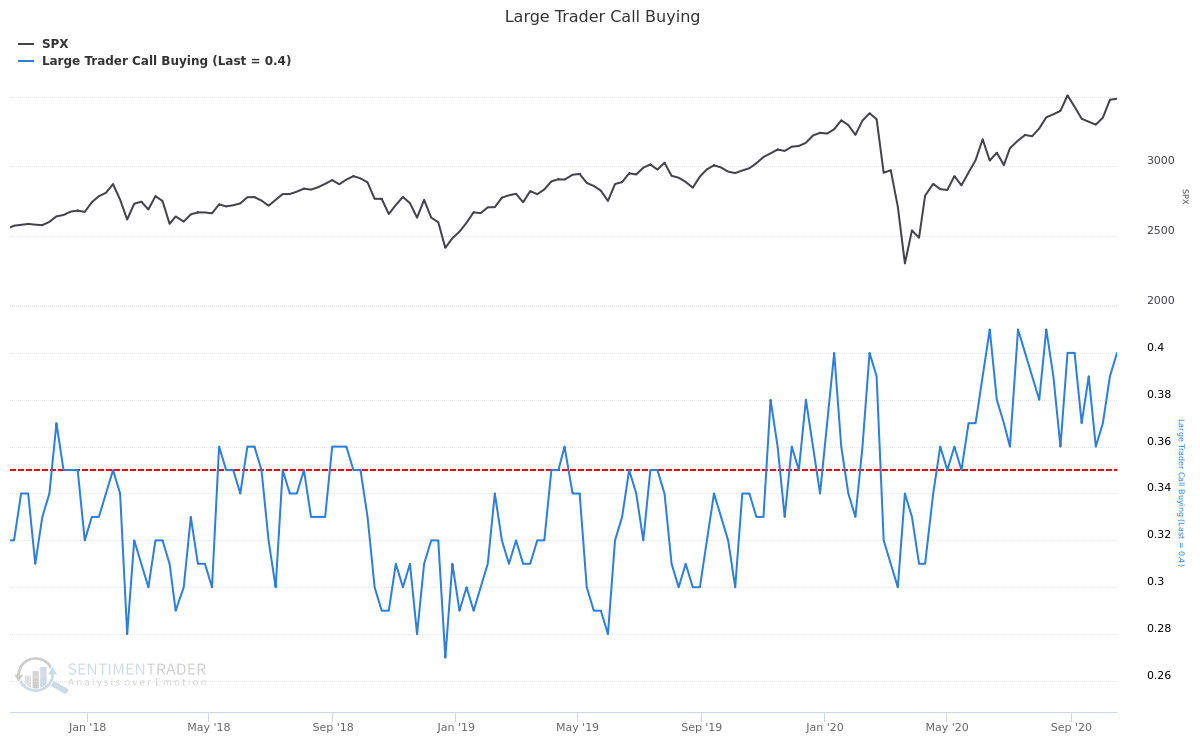
The same goes for large speculative traders in the options market. With call option buying back to more extreme levels, the risk remains skewed to the downside.
Short-term market timers are also back into the “excessively bullish” zone.
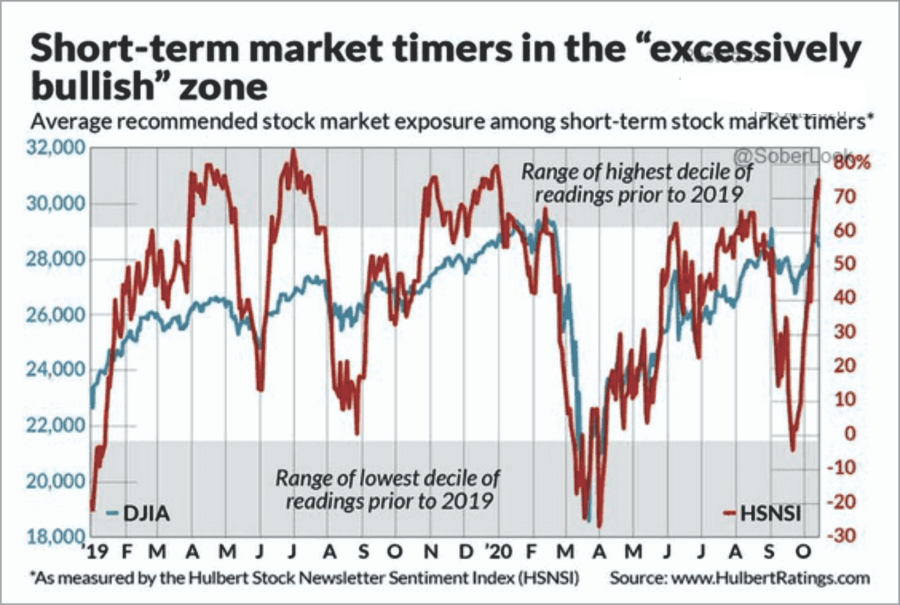
Okay, you get the idea; investors are “all-in” as we head into the election.

Short-Term Trends Remain Bullish
Despite market sentiment on the more extreme side, the market’s short-term dynamics remain bullish for now. As shown below, the market remains above both the 20- and 50-dma, with the 20-dma very close to a positive cross. Such gives the market a decent level of nearby support, which should buoy prices near term.
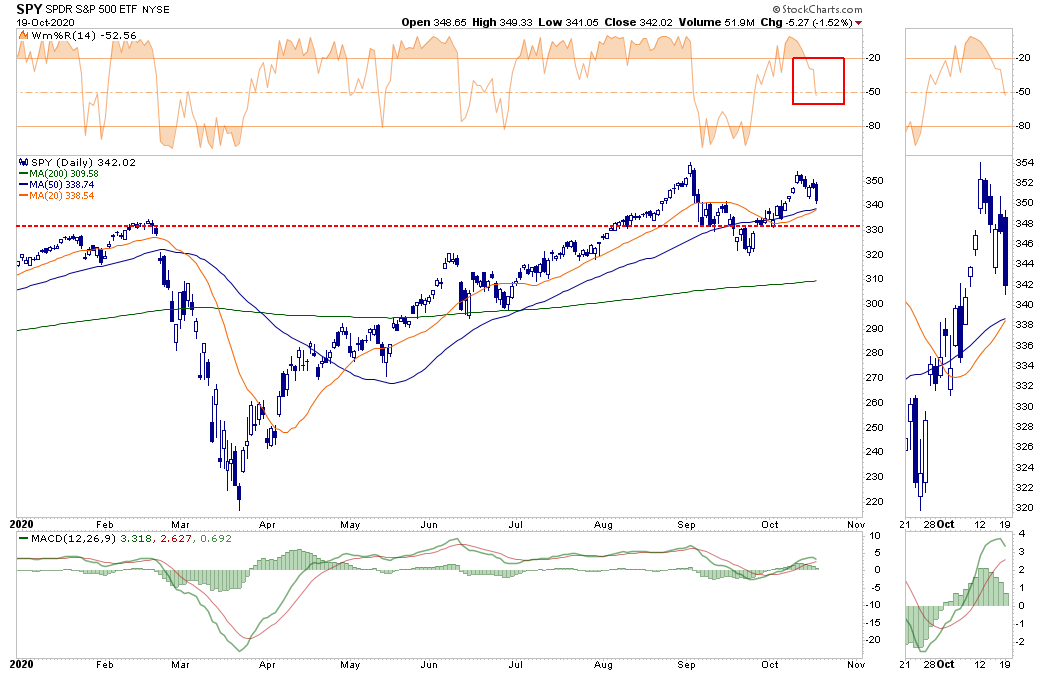
There is a risk of a deeper sell-off in the short-term. As noted this past weekend, a contested election leaves the market vulnerable to a decline. September lows, and below that, the 200-dma are viable targets for a short-term correction. Furthermore, given the markets have been running on hopes of “more stimulus,” there is a growing realization that another rescue package may not be coming until well after the election.
Either of those events would most certainly lead to lower asset prices in the short-term.
Intermediate Trends More Cautious
On a weekly basis, the market remains in a clear bullish trend from the 2009 lows. The correction in March did not clear the market excesses in terms of valuations and price action. Note in 2008, chart below, the depth of the decline in the indicators. The decline in March did not reach those more extreme levels. As noted in that article:
- “Corrections” generally occur over short time frames, do not break the prevailing trend in prices, and are quickly resolved by markets reversing to new highs.
- “Bear Markets” tend to be long-term affairs where prices grind sideways or lower over several months as valuations are reverted.
I discussed this concept in the video below.
While the “correction” in March was unusually swift, it did not break the long-term bullish trend. Such suggests the bull market that began in 2009 is still intact as long as the monthly trend line holds.
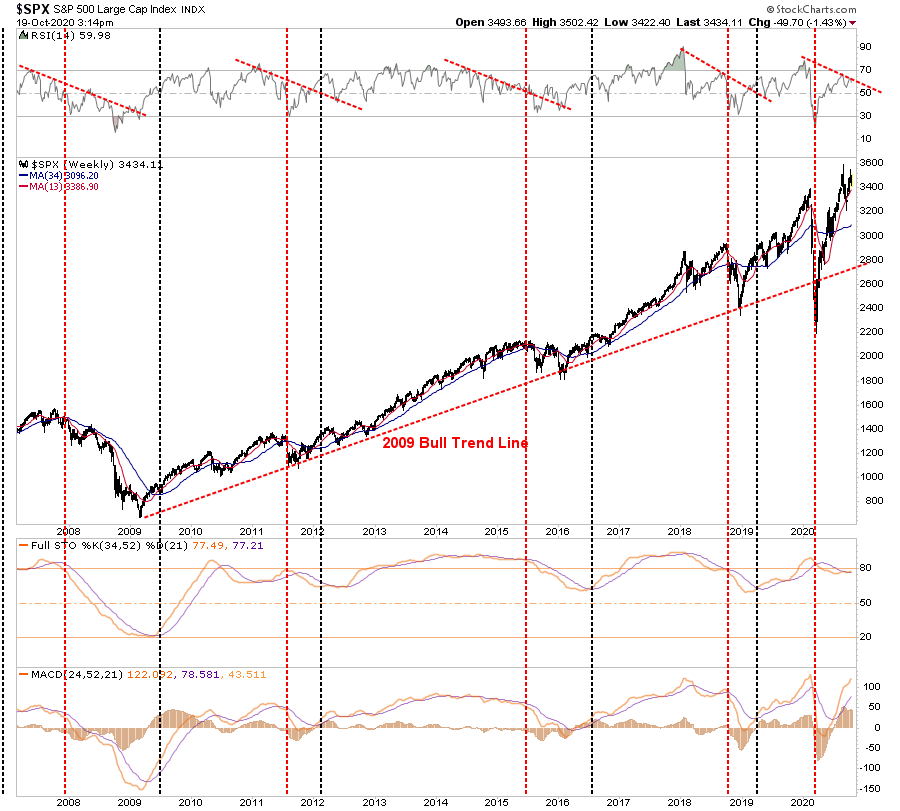
With the current deviation above the long-term bullish trend and a negatively diverging RSI, the risk of a bigger correction in 2021 has grown. The only two real questions that investors must consider:
- What will be the catalyst that starts the liquidation event; and,
- Will the Federal Reserve be able to “bailout” the markets a third time?
The monthly trends confirm the same.

Monthly Trends Remain Bearish
On a longer-term basis, we remain concerned about the dichotomy of signals from the market. RSI’s negative divergences also appear on a monthly basis, along with the number of stocks above their respective 200-dma and extreme monthly overbought conditions.
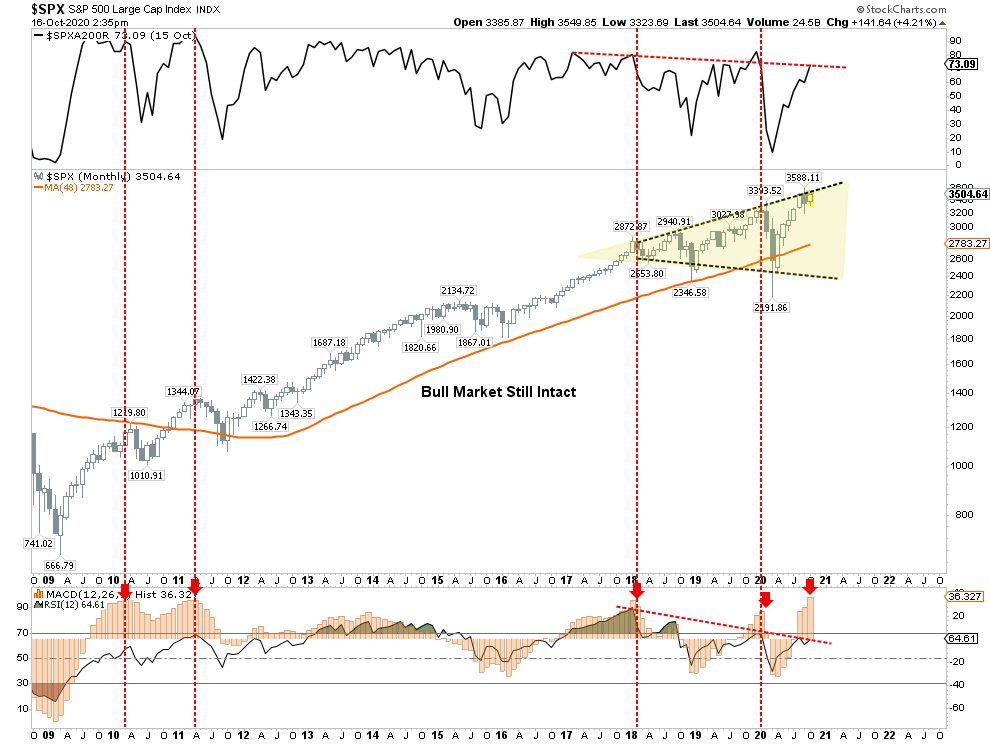
The previous extensions over the last decade have led to decent corrections and outright bear markets.

Hedging For Unknowns
Could this time be different? Sure, anything is possible. However, as investors, we want to remain focused on the “probabilities.”
What it won’t be is the “election.” Market participants have already “weighed and measured” the various outcomes of the election from a Biden “win” to a “blue wave.” Historically speaking, the markets quickly adapt to the next President and “price in” potential policy shifts.
The market likely has not fully priced in a “contested election” as we saw in 2000, which implies a 7-10% decline in the market.
There is no clear pathway for the markets currently, which is why we are beginning to evaluate our current holdings and starting to hedge for potential risks heading into the election.
Slow At First, Then All Of A Sudden
What all of this suggests is that “risk” is building in the markets.
However, risk builds slowly. Such is why the investment community often uses the analogy of “boiling a frog.” Turning up the heat slowly, frogs don’t realize the peril until it’s too late. The same is true for investors who make a series of mistakes as “risk” builds up slowly.
- Investors are slow to react to new information (they anchor), which initially leads to under-reaction but eventually shifts to over-reaction during late-cycle stages.
- The “herding” effect ultimately drives investors. A rising market leads to “justifications” to explain over-valued holdings. In other words, buying begets more buying.
- Lastly, as the markets turn, the “disposition” effect takes hold, and winners are sold to protect gains, but losers are held in the hopes of better prices later.
The end effect is not a pretty one.
When the buildup of “risk” is finally released, the explosion happens all at once, leaving investors paralyzed, trying to figure out what just happened. Unfortunately, by the time they realize they are the “frog,” it is too late to do anything about it.
Rules To Follow
Given that markets are still hovering within striking distance of all-time highs, there is no need to take action immediately. However, the continuing erosion of underlying fundamental and technical strength keeps the risk/reward ratio out of favor. As such, we suggest continuing to take actions to rebalance risk.
- Tighten up stop-loss levels to current support levels for each position.
- Hedge portfolios against major market declines.
- Take profits in positions that have been big winners.
- Sell laggards and losers.
- Raise cash and rebalance portfolios to target weightings.
As stated, the market’s long-term dynamics remain unfavorable, and the liquidity-fueled rally from the March lows have only exacerbated previous overvaluations. Could the market rise from current levels through the end of the year? Absolutely, and is something that we currently expect to happen.
However, we think 2021 may start the “payback” process as economics and fundamentals play catch up with reality.
But we will deal with that issue next year.


Lance Roberts is a Chief Portfolio Strategist/Economist for RIA Advisors. He is also the host of “The Lance Roberts Podcast” and Chief Editor of the “Real Investment Advice” website and author of “Real Investment Daily” blog and “Real Investment Report“. Follow Lance on Facebook, Twitter, Linked-In and YouTube
Customer Relationship Summary (Form CRS)
Also Read


