
Is a stock market rally coming? I think that is most likely the case. However, to understand why, we must review what we said at the beginning of July in “Complacency Seems Overly Complacent.”
With bullish optimism quickly returning to the market, the pressure to chase performance from the “Fear Of Missing Out” will continue to provide a “bid” under stocks. However, such does not remove the potential for a 5-10% correction. Such corrections are normal within any given year and will provide the best entry point to increase equity exposure near term.”
The chart below, via @TheMarketEar, shows the frequency of declines in each year from 1950 through the end of 2022.
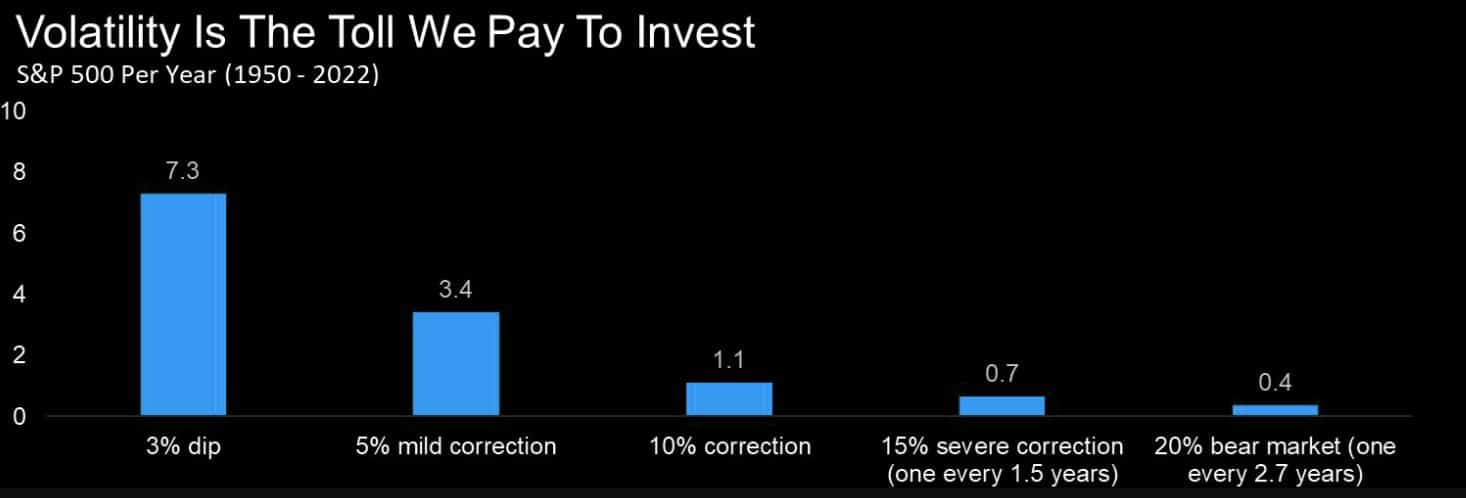
Since the beginning of August, the stock market has come under pressure. Concerns about higher interest rates, a downgrade of U.S. bonds, and an uptick in inflation spooked more bullish investors. The market has declined by roughly 5% from the recent peak through the end of last week.
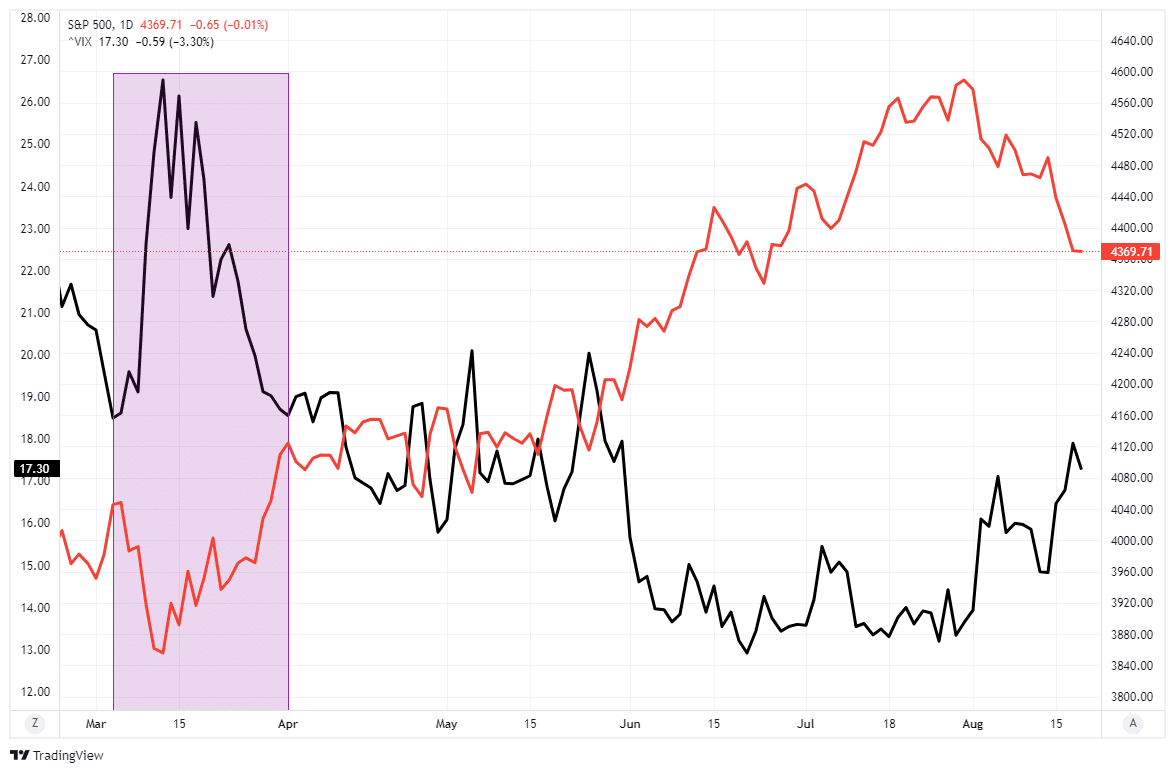
Notably, the correction was orderly, with no signs of financial stress. The following chart shows that volatility did rise somewhat as the stock market declined. However, during periods of “stress,” the volatility index tends to “spike” higher. You can see the difference between the current decline and March during the regional bank failures.
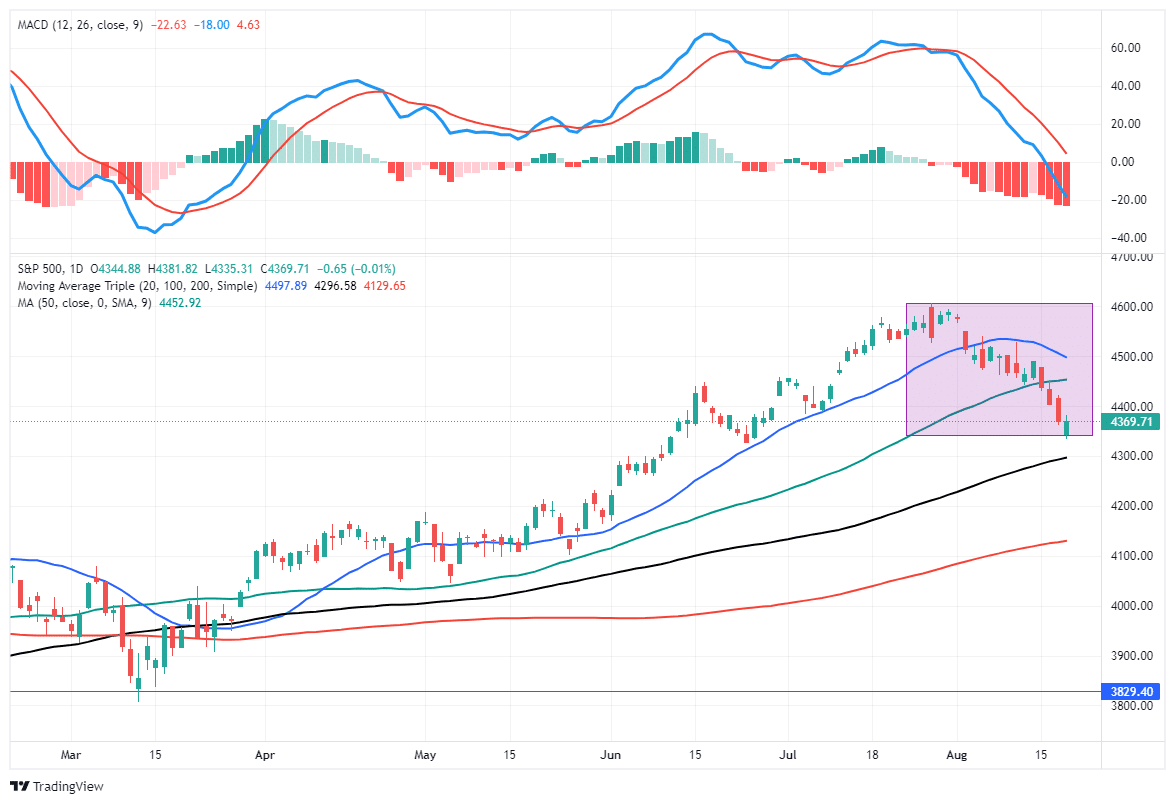
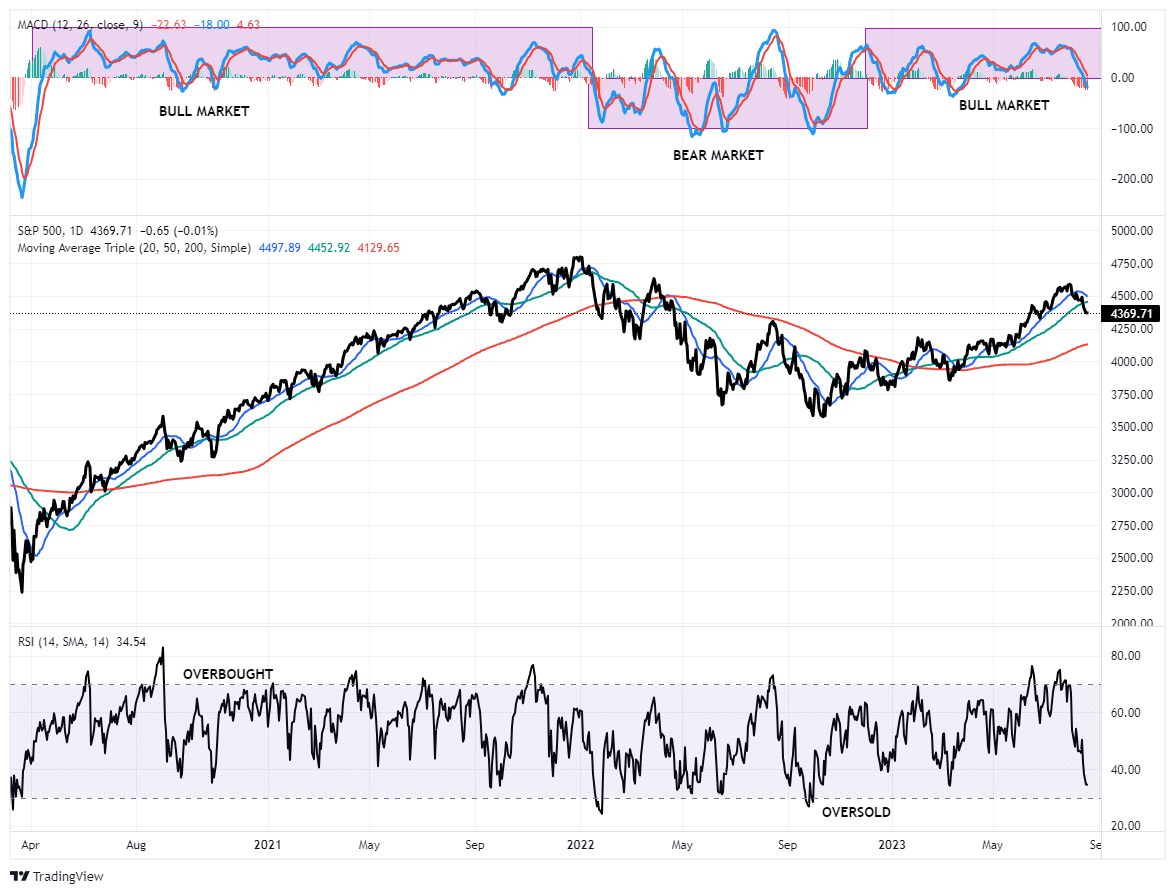
After two weeks of consistent selling pressure, the previous overbought and more exuberant sentiment levels have reversed. During more bullish market trends, technical indicators tend to bottom at more shallow levels. The chart below shows the Moving Average Convergence Divergence indicator (MACD), which measures the spread between two moving averages. Crosses of the two lines denote “buy” or “sell” signals for the stock market. Furthermore, the Relative Strength Index (RSI) has also reversed from above 70 to near 30. Such levels are often associated with short-term stock market bottoms.
However, it isn’t just the broad stock market readings suggesting a near-term rally is likely.

A Broad Sell-Off
We provide a broad swath of stock market analyses each week in the Bull Bear Report. I want to review some analysis suggesting the stock market could find a near-term bottom for a reflexive rally.
However, we first need an essential caveat.
- I am NOT suggesting the current corrective process is over.
- I AM suggesting that the current sell-off is getting a bit stretched, and a bounce is likely.
Our Daily Market Commentary has repeated the second point (Subscribe For Free Premarket Email).
“While I would expect a rally as soon as today, that rally will likely remain contained below the 50-DMA for now. It will be unsurprising for the market to work its way lower over the next month towards that lower level of support. Use rallies to rebalance risk as needed.”
With that caveat in place, the data in this past week’s Bull Bear Report supports the reflexive rally thesis. First, most major markets and sectors reached more extreme short-term oversold levels and are off recent highs. While there could be some additional selling pressure near-term, generally, a bounce occurs when most markets and sectors are nearing more oversold levels.
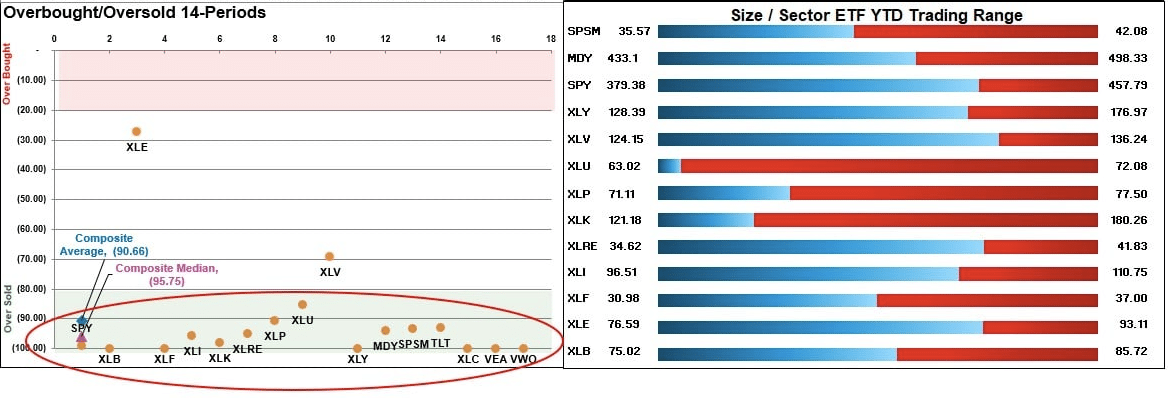
Secondly, analysis of market and sector performance relative to the broad market also provided clues. That analysis, which measures historical volatility, generates risk ranges we can use to determine optimal entry and exit points.
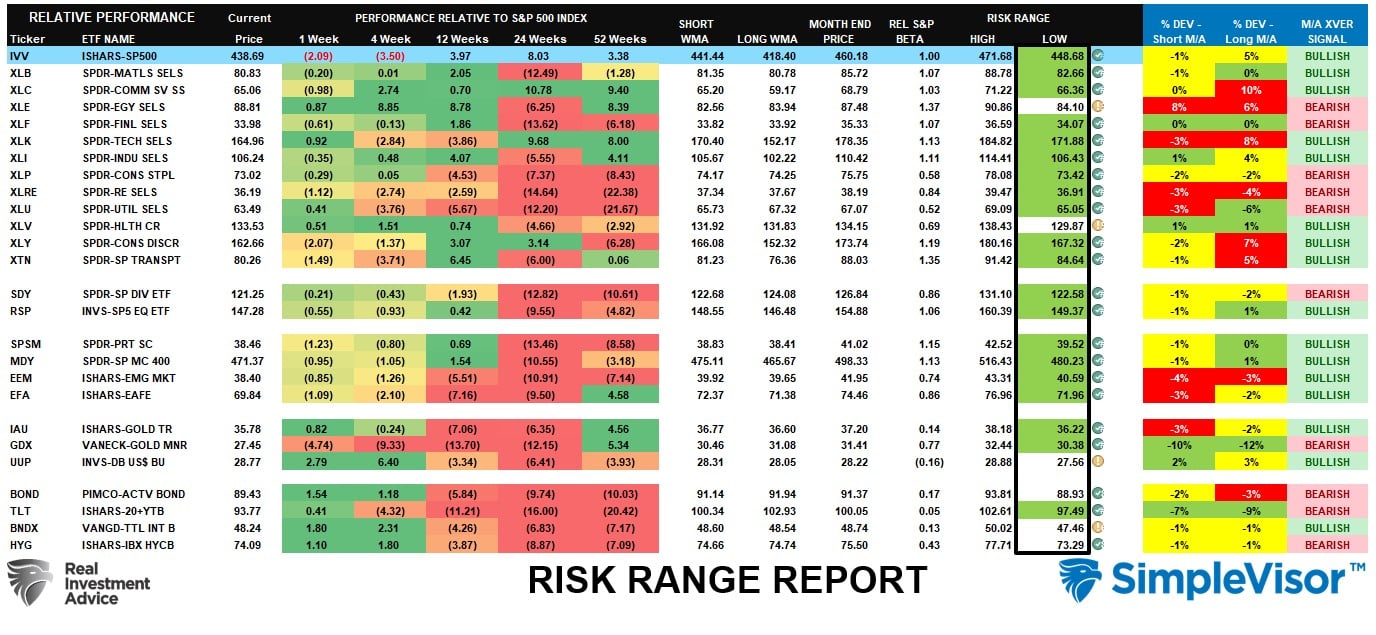
As shown, most markets and sectors are trading well below their normal risk ranges. Historically, when corrective periods have been very broad, as we have seen since the beginning of August, such usually provides a reflexive rally.
This analysis suggests a bounce over the next week or so. We recommend using that rally to rebalance portfolio risks, as we could see more corrective action in the historically weak month of September.
But one piece of analysis jumped out, suggesting where we should think about investing in 2024.

Where To Invest In 2024?
In November 2020, following a plunge in oil prices and a steep decline in Energy stock prices, we suggested that investing in energy stocks could be the place to be in 2021. That discussion was driven by the chart below, which showed the vast underperformance of Energy stocks relative to the rest of the broad market and sectors.
While Energy performed modestly in 2021, during the 2022 correction, performance exploded, with Energy being the market’s best-performing sector, while Communications, Discretionary, and Technology were among the worst. The same analysis used previously to expect a turn in Energy led us to write an article at the end of October 2022, questioning the broad view that “FANG Stocks Were Dead.”
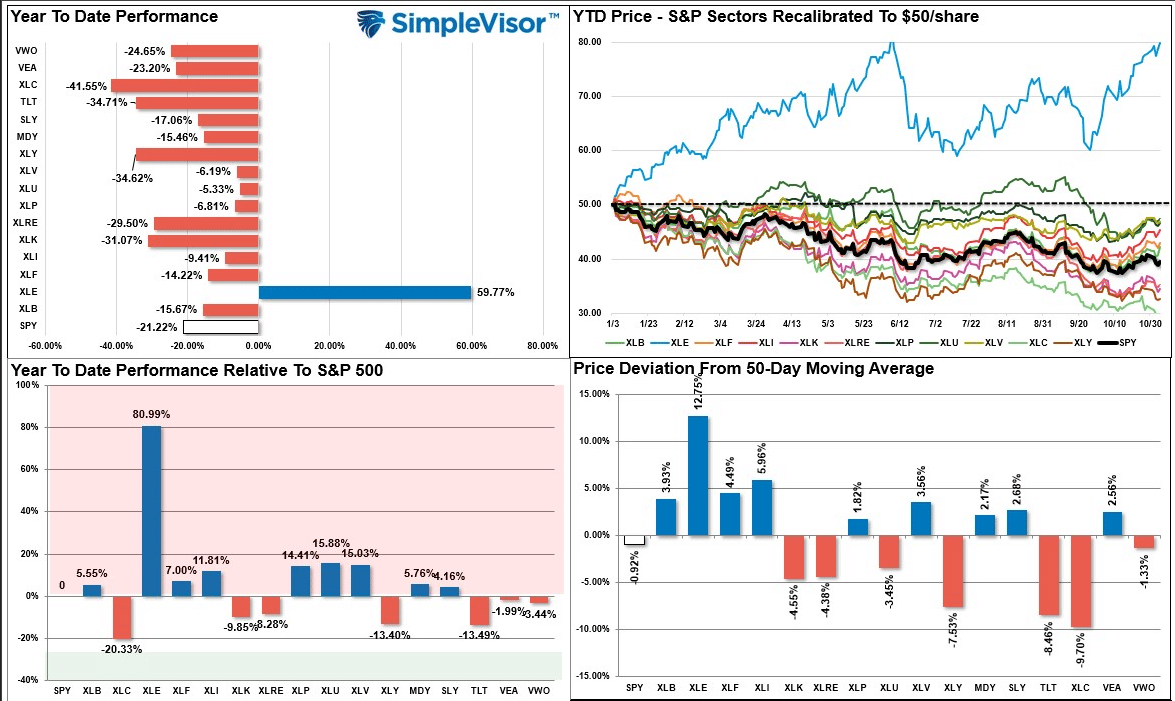
While this analysis is neither perfect nor timely, when there is an extreme over or underperformance of a market or sector in a given year, historically, that performance reverses in the next. The problem, as always, is the timing of the reversal.
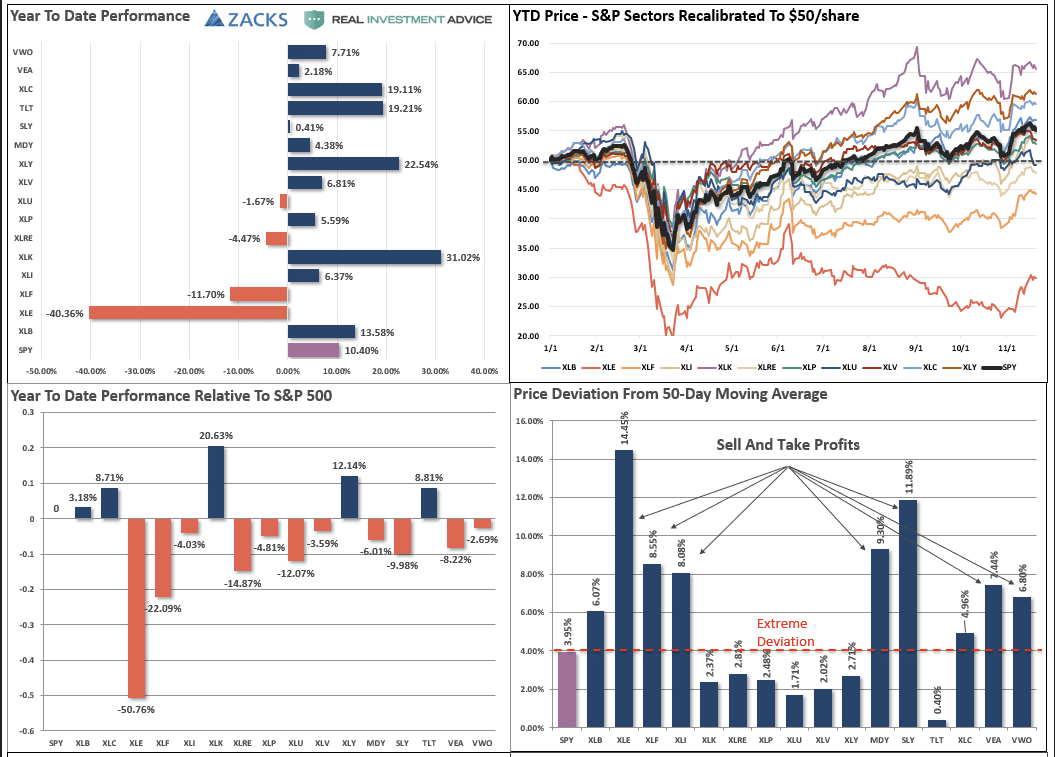
So what is the current market environment telling us where money could flow in 2024? In the recent performance analysis, several things should become apparent. The surge in the most hated sectors last year has been the main driver of this year’s broad market performance. If we strip out the performance of those three sectors, the market would be near flat on a year-to-date basis.
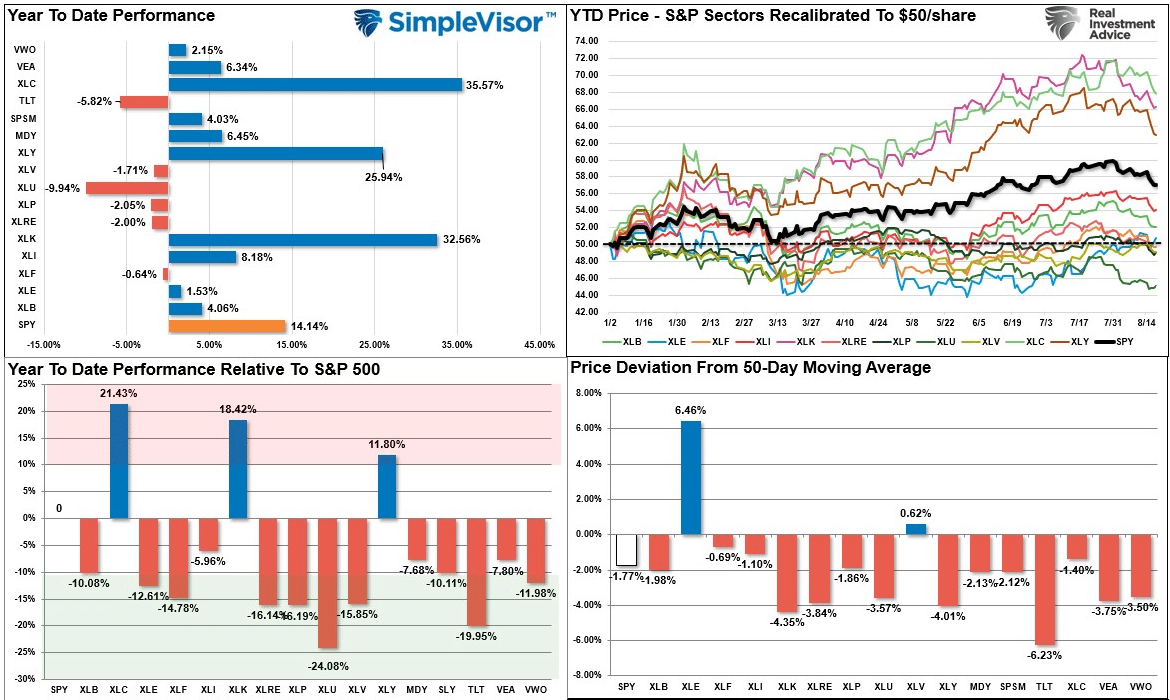
So, where is the potential for 2024? Given that Utilities, Staples, Real Estate, Financials, and Bonds are the biggest underperformers in 2023, those sectors could provide decent upside in the future. Of course, all those sectors have interest rates in common.
Therefore, as we begin to think about 2024 and 2025, the biggest driver of interest rates will be the Federal Reserve. As shown below, market participants anticipate a Fed “rate-cutting” cycle later next year. If such occurs, it will be because of weaker economic growth rates and falling inflation.
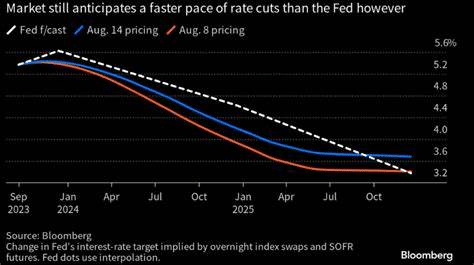
If such does indeed become the case, the rate decline will catalyze this year’s most hated sectors to shine again.
While there is a high degree of certainty this will occur, the timing is always tricky.
The current outperformance of Technology, Discretionary, and Communications will end. When it does, the money will flow to the areas presenting the most opportunity.
As hockey great Wayne Gretzky once said, “The key to winning is skating first to where the puck will be next.”

