
🔎 At a Glance
- Two-Month Market Rally: What Comes Next?
- Market Brief & Technical Review
- From Lance’s Desk: Stronger Dollar Trade: The Most Unexpected Macro Bet (Part 2) – RIA
- Market stats, screens, and risk indicators
🏛️ Market Brief – Rotation Snaps The Streak
The melt-up finally took a breather. After nine straight winning weeks, the S&P 500 closed lower, finishing Friday at 7,384, down about 2.6% on the week and roughly 3% below Tuesday’s record high of 7,609.78. The headline number buries the real story, because underneath it the market staged the sharpest rotation we’ve seen all year, with the Dow Jones Industrial Average tearing to a fresh record near 51,562 on Thursday even as the Nasdaq logged its worst day in nearly eight months. So the tape didn’t fall apart. It rotated.
The trigger was Broadcom. After the bell on Wednesday, the AI-chip bellwether beat on earnings, but guided next-quarter AI revenue below the lofty bar Wall Street had set, and CEO Hock Tan declined to raise the full-year target. The stock dropped roughly 14% on Thursday, and the Philadelphia Semiconductor Index fell 5.21%; AMD, Intel, and Micron were dragged down with it. We have warned for weeks that the rally’s narrowing leadership was its single biggest vulnerability, and this week the generals finally broke ranks.
Then Friday delivered the macro gut-check. The May jobs report printed 172,000 new positions, roughly double the 85,000 economists expected, with unemployment holding at 4.3% and prior months revised higher. Good news became bad news in a hurry. The 10-year Treasury yield jumped to 4.53%, its highest since May, the 30-year pushed back above 5%, and the last hopes for a 2026 rate cut evaporated. Markets now price no cuts this year, and a few strategists, including Deutsche Bank’s Henry Allen, think a hike is more likely than not.
The cross-asset tape remained oddly calm throughout it all. The VIX didn’t surge even as chips cratered, a sign the selling was rotational rather than systemic. West Texas Intermediate Crude held near $90, down about 3% on the session, on lingering Iran and Strait of Hormuz risk premium before slipping on ceasefire headlines. Meanwhile, Bitcoin suffered its worst week since February. Healthcare, Utilities, Real Estate, and Financials led the tape while Technology reversed.

For the week ahead, the question is whether this was a healthy rotation or the first real crack. I think this is the beginning of potentially a bit larger correction heading into this quarter-end rebalancing. However, Wednesday’s inflation report will go a long way toward answering it. A hot CPI landing on top of Friday’s hot jobs number would pour more fuel on the yield fire, and that’s the thread to watch.
📈Technical Backdrop – New Highs, Thinner Air
As we noted last week in Parabolic Semiconductor Rally: What Breaks The Trade?, Broadcom’s earnings were the single most important test for this advance, because the trade you can’t sustain forever is the one that snaps first. Broadcom delivered the catalyst. It beat on the quarter but guided next-quarter AI revenue to about $16 billion against the $17.2 billion the Street wanted, and the sell-the-news reaction was textbook for a stock priced for perfection. So, has the semiconductor rally ended? The parabolic phase has.
Step back from the noise. At Friday’s close of 7,384, the S&P 500 still sits about 3.2% above its rising 50-day moving average near 7,156 and roughly 7.7% above its 200-day average near 6,858, so the primary uptrend remains intact even after a hard week. The damage so far is to momentum, not to the trend itself.
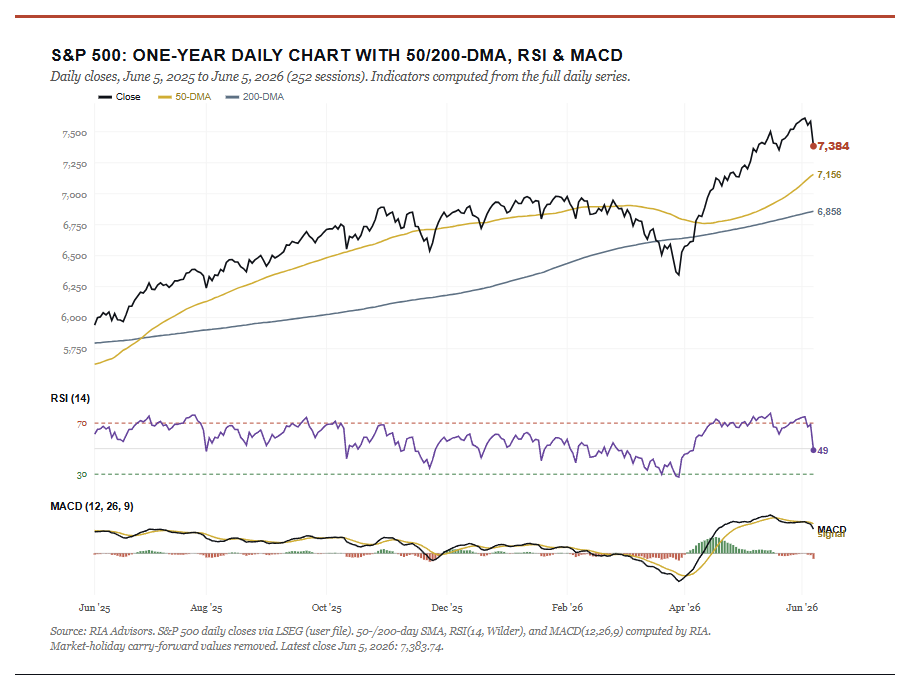
The momentum picture is where the warning signs live. The 14-day RSI tagged 75 at Tuesday’s record, deep into overbought territory, then collapsed to roughly 49 by Friday as the selling accelerated, a violent four-session reset from euphoria to neutral. Worse, the MACD has now crossed below its signal line with the histogram flipping negative, the classic loss-of-thrust that follows a vertical run. Breadth tells the same story. Only about 56% of S&P 500 members trade above their 50-day average, meaning this record was carried by a shrinking handful of names.
The chips are the tell. The Philadelphia Semiconductor Index fell 5.21% on Thursday, its worst session since early 2025, and Broadcom alone surrendered roughly 14% after an 88% run over the past year. When the generals retreat, and the troops are already thin, the index rarely powers straight back to new highs. It digests first.
For traders, the playbook is mechanical from here on out. Use any bounce to trim the most extended semiconductor and AI names back toward their respective target weights, and respect the levels that lie below, as many of these stocks are extremely deviated from their long-term means. However, for the board market, the table lays out the next support and resistance levels.
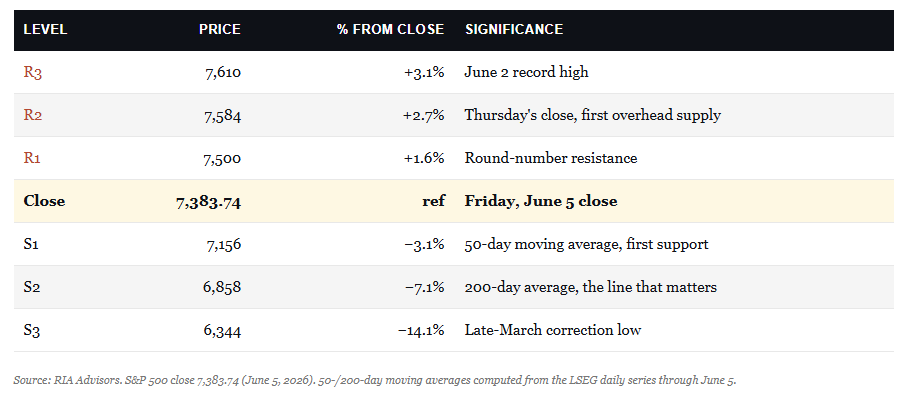
The level to watch into next week is 7,156. Hold the 50-day on the CPI print, and the dip buyers are likely to step back in, keeping this a correction within an uptrend rather than a top. Lose it, and the 200-day near 6,858 becomes the conversation.
🔑 Key Catalysts Next Week
Next week is all about one number. After Friday’s blowout jobs report reset the rate outlook, Wednesday’s May Consumer Price Index becomes the most important release on the calendar, because it will either confirm or quiet the inflation reacceleration that has driven yields higher all spring. Recall that headline CPI ran at 3.8% in April, up sharply from 2.4% in January, with energy doing much of the lifting as the Iran conflict kept oil prices high. A hot May print stacked on a hot jobs number would all but slam the door on a 2026 rate cut.
The inflation data is split into two parts. CPI hits on Wednesday morning, followed by the Producer Price Index on Thursday. After April’s startling 6% year-over-year PPI, the pipeline pressure in that report matters nearly as much as the headline consumer number. Both feed straight into the Fed’s thinking ahead of the June 16-17 meeting, the first chaired by Kevin Warsh.
The AI-capex story also gets two fresh tests. Oracle reports Wednesday after the close, and after Broadcom’s stumble, every line about cloud and AI infrastructure spending will be parsed for signs the buildout is cooling. Adobe follows on Thursday, offering a read on whether software is actually monetizing AI or merely spending on it.

The asymmetric risk sits squarely with CPI. A cool print buys the bulls room and pulls yields back off their highs. A hot one, landing on top of Friday’s jobs shock, hands the bears the catalyst they’ve been waiting for and puts that 50-day average at 7,140 directly in play.
Need Help With Your Investing Strategy?
Are you looking for comprehensive financial, insurance, and estate planning services? Need a risk-managed portfolio management strategy to grow and protect your savings? Whatever your needs are, we are here to help.

💰 Two-Month Market Rally Has Everyone Nervous
Over this past week, everyone wanted the answer to the same question. Is this rally about to break? As we discussed last week, Broadcom (AVGO) held the semiconductor hostage to its earnings. Its revenue miss may have sparked the correction we discussed, but we will need to see follow-through next week. For now, however, the S&P 500 had an amazing run of roughly 16% over April and May, and a record close of 7,599.96 on June 1. That run certainly has the bears pointing at the sheer speed of the move as proof that a reversal is coming. I understand the worry and have cautioned about the same over the last few weeks. This two-month market rally was fast and genuinely rare, but what is important now is what happens next.
Therefore, the question we will explore is why this two-month market rally looks so unusual.
Deutsche Bank’s Henry Allen put a number on the unease. A two-month market rally of 16% in the S&P 500 has occurred only 4 times since World War II. Three of them came straight off a recession low: April and May of 2020, after Covid, March and April of 2009, after the financial crisis, and January and February of 1975, after the first oil shock. Each was a coiled spring releasing.
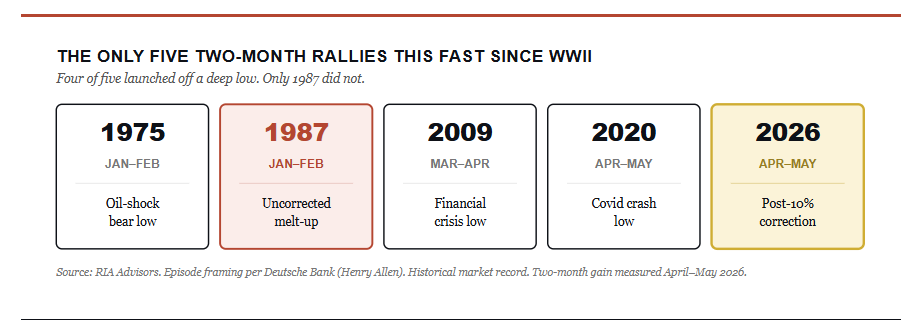
The fourth case is the one that keeps people up at night, the January and February of 1987, a few months before the Black Monday crash that October, when the index fell more than 20% in a single session. That’s the only non-recession example on the list. So the bear case writes itself. The one-time stocks ran this fast without a recession to bounce off of, and a historic crash followed within the year.
However, hold on for a second. While that story is clean and, albeit, frightening, it’s also incomplete.
The Analog Nobody Wants Is the Wrong Analog
Here’s the problem with that argument. Look at what actually preceded each rally, not just whether the word “recession” technically applies. The 2020, 2009, and 1975 surges all launched off deep, washed-out lows. Prices had already collapsed. The fast rally that followed was the recovery, the snap back from oversold panic toward something closer to fair value.
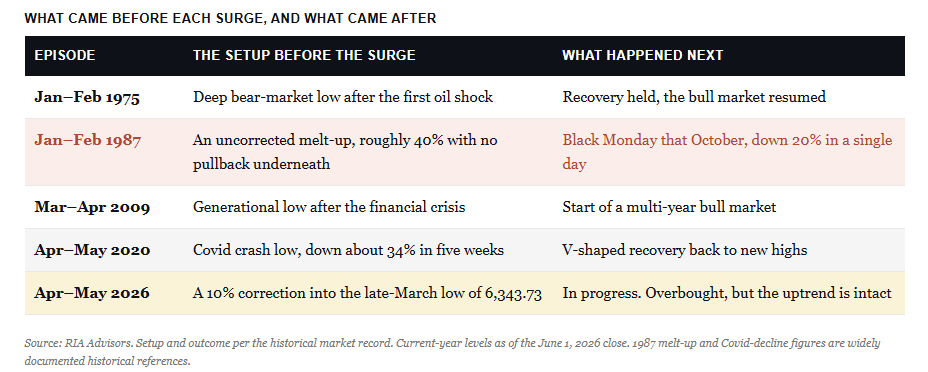
1987 was different in kind, not degree. Stocks had melted up roughly 40% into that August peak with no correction underneath them, valuations stretched and sentiment euphoric, so the speed of that advance was never a recovery from anything but the final vertical blow-off of a market that had simply refused to pause. That is why it broke. There was no real decline beforehand to justify the snapback.
So the right question isn’t whether a recession came first. The question is whether a real decline came first. On that test, 2026 looks nothing like 1987.
This two-month market rally launched off a genuine washout. The index fell about 10% into its late-March low of 6,343.73, and that drop came on the heels of the roughly 20% drawdown that bottomed back in April 2025. We didn’t melt up into this advance. We climbed out of a hole. That places the current move in the company of 2020 and 2009, not 1987. And the upside tail cuts the same way. Carson Investment Research found that when there was a two-month market rally that gained more than 20% since 1950, it went on to rise an average of 16% over the next six months and 31% over the next year.
Corrections Are Routine. The Big Ones Are Spaced Out.
Yes, a two-month market rally surely raises concerns. However, step back, and the fear starts to look misplaced. Since 1945, the S&P 500 has experienced 33 corrections of 10% or more on a closing basis, the most recent being this year’s slide from the January 27 peak of 6,980.75 to the late-March low. That’s the headline number worth sitting with. Thirty-three. A 10% drop is not some rare event you brace for once a decade. It’s the toll the market charges for the gains it hands out the rest of the time, and on average, those declines have run about 14% from peak to trough before the next leg up begins.
As we noted earlier this week in the Daily Market Commentary:
“Let’s start with what this two-month market rally actually is. The market ALREADY took its medicine this year. It fell roughly 10% to the early April low, and what we’ve seen since is a recovery, not an unanchored melt-up. That’s the pattern after most corrections. Since the end of World War II, the S&P 500 has booked 33 declines of 10% to 20% on a closing basis. The table tracks each one from the day the decline began, how long it took to bottom, and then the prize for sitting tight: the rally from that low to the next market peak, and how long that climb lasted.”
The typical correction cuts about 14% over roughly four months, and the rally off the low has historically run a median 34% over about 10 months before the next peak. This year’s advance is 19.8% in about two months. Fast, yes; however, by this table’s standard, it is still on the young side. As Bob Farrell’s Rule #4 reminds us, exponential moves usually run further than anyone expects before they roll over.

What matters more for today is the spacing. The deep declines, those that approach or breach 20%, tend to arrive years rather than months apart. We just cleared one in 2025 with the roughly 20% drawdown that bottomed that April, and it was the real washout of this cycle. The modest 10% dip this March was the routine variety stacked on top of it. Two genuinely deep corrections inside the span of a single year would break the historical pattern badly, and after a stretch like the one we’ve just been through, the base rate strongly favors the shallow kind next. That’s exactly what the moving averages are now setting up.
How Big a Pullback Would Actually Be Normal
None of that means that the two-month market rally can’t pause. Technically, it was overdue, and with RSI north of 73, the tape was stretched. So the correction that started Friday was not unexpected. With the market this far above its moving averages, a mean reversion was all but inevitable. As such, we need to pay attention to the moving averages, which are the guides to eventual corrections.
At the recent highs of ~7,600, the S&P sat about 7.7% above its 50-day average near 7,058 and about 11% above its 200-day average near 6,831. Those gaps are the whole story. A garden-variety pullback to the 50-day is a roughly 7% decline. A deeper flush all the way to the 200-day is about 10%, and even that holds above the March low, leaving the larger uptrend fully intact. On Friday, the market cleanly took out its first support at the 20-day moving average. That break, if not recovered by early next week, leaves the 50-day moving average as the next logical support level.
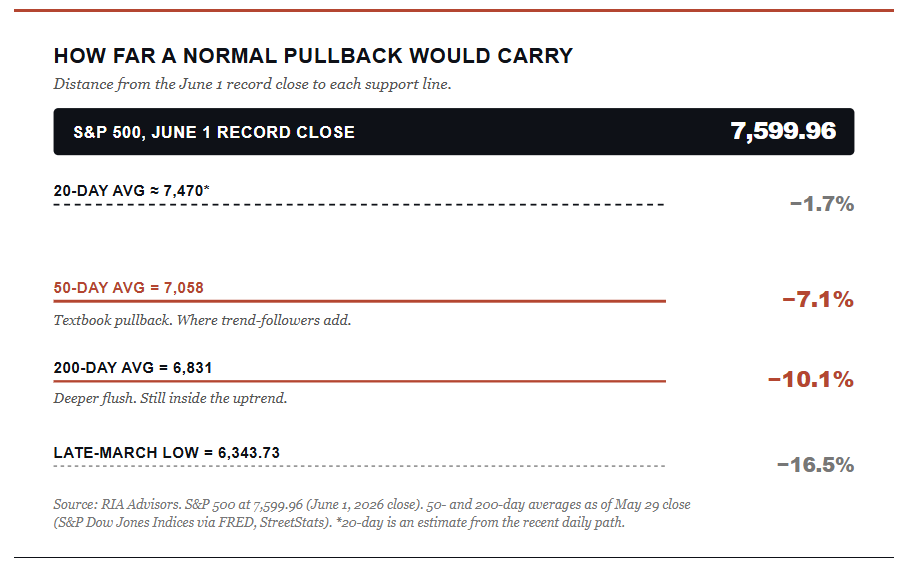
That maps cleanly onto the historical norm. The market corrects by 5% to 10% in almost every calendar year. Since we already booked the double-digit drop in March, the odds are against a second deep correction. Of course, nothing is ever absolute. I made that same point about what’s actually driving this rally two weeks ago. That was when the base case was a pullback toward the 20-day, not a breakdown. Back-to-back deep declines are the exception, not the rule.

A normal 5% to 8% pause here only takes us back to the 50-day. That’s the level trend-followers add to, not abandon.
What Should Investors Do Now
So where does that leave us? Make no mistake: I have repeatedly flagged the summer risk, and it may have arrived, though it is still early. When I wrote that summer 2026 looks risky in early May, the index sat near 7,125, breadth was hollow, and the entire advance rested on a handful of names. Even after a two-month market rally, those concerns remain the same. However, the internals are no healthier, with narrow leadership, stretched sentiment, and a tape on track for a fourth straight double-digit year, something we haven’t seen since the late-1990s run into the dot-com peak. Those are real risks, and they argue for discipline, not complacency.
But discipline is not the same as panic. As Bob Farrell’s Rule #9 reminds us, when all the experts and forecasts agree, something else is going to happen. Right now, the crowd is uniformly braced for a top, and everyone is watching the same overbought readings, the same narrow breadth, and the same calendar that says summer is treacherous, which is precisely the setup where the obvious trade tends to disappoint. That alone makes a violent crash less likely than the consensus fears. A routine mean-reverting pause is the higher-odds outcome.
Here’s the playbook. We continue to suggest trimming the most extended winners back toward their target weights. Also raising a little cash, and rebalancing in places where sector dispersion has stretched far too wide to ignore. Keep your core exposure. Don’t chase the names that have already tripled. The issue is NOT whether the bull market is still intact. The issue is what price you pay to chase it from here.
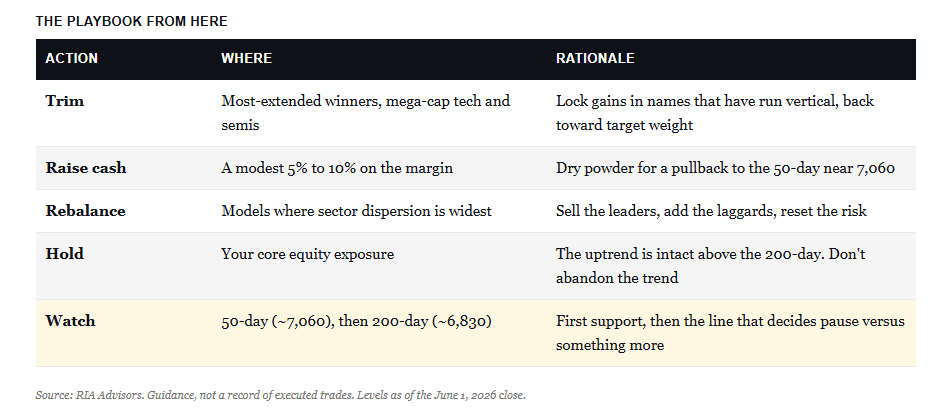
What are we watching into next week? The 50-day near 7,060 is the next support. Lose that, and the 200-DMA is the line that decides whether this is a healthy pause or a deeper correction. Until then, the math of this two-month market rally argues for a breather, not a peak. For more on telling the two apart, see our note on a correction versus a bear-market rally.
🖊️ From Lance’s Desk
This week’s #MacroView blog picks up on understanding the US Dollar. Specifically, it examines why the unexpected trade right now may simply be to go long the dollar.

Also Posted This Week:
- Quantum Computing: Hype Or The Real Deal? – RIA – by Michael Lebowitz
- Risk Management For Retirees: When To Reduce Exposure – RIA – by Lance Roberts
📹 Watch & Listen
A review of what is driving the S&P 500 index and why the Technology sector may be the most “at-risk” trade.
Subscribe To Our YouTube Channel To Get Notified Of All Our Videos
📊 Market Statistics & Analysis
Weekly technical overview across key sectors, risk indicators, and market internals

💸 Market & Sector X-Ray: Market Cracks Support
As noted last week, the massive bifurcation “historically suggests we could see a rather rapid internal market rotation (risk on to risk off).” Such is exactly what we saw at the end of this week, as Technology was sold off very sharply while defensive areas of the market offset some of that decline. Given the massive extensions in areas of the Technology market, more derisking is likely. Trade accordingly.

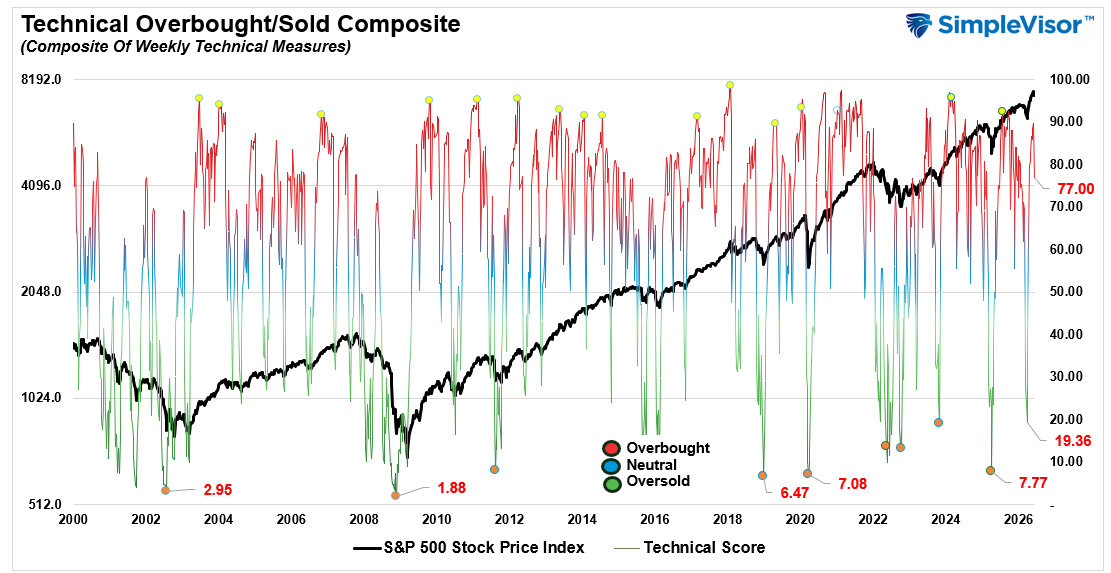
📐 Technical Composite: 77.0 – Correction From Overbought
As noted last week, “The markets remain extended, which continues to suggest monitoring risk exposures.” That correction process likely started this past week, and could have more to go before a more buyable entry point reveals itself.
🤑 Fear/Greed Index: 72.64 – Sell Off Trims Greed Profile
Unsurprisingly, the sell-off in the market last week reduced investor sentiment sharply from extreme greed to greed. As noted, there is likely more room in the current correction process, but this correction, at least at this juncture, remains a pullback in an ongoing uptrend.

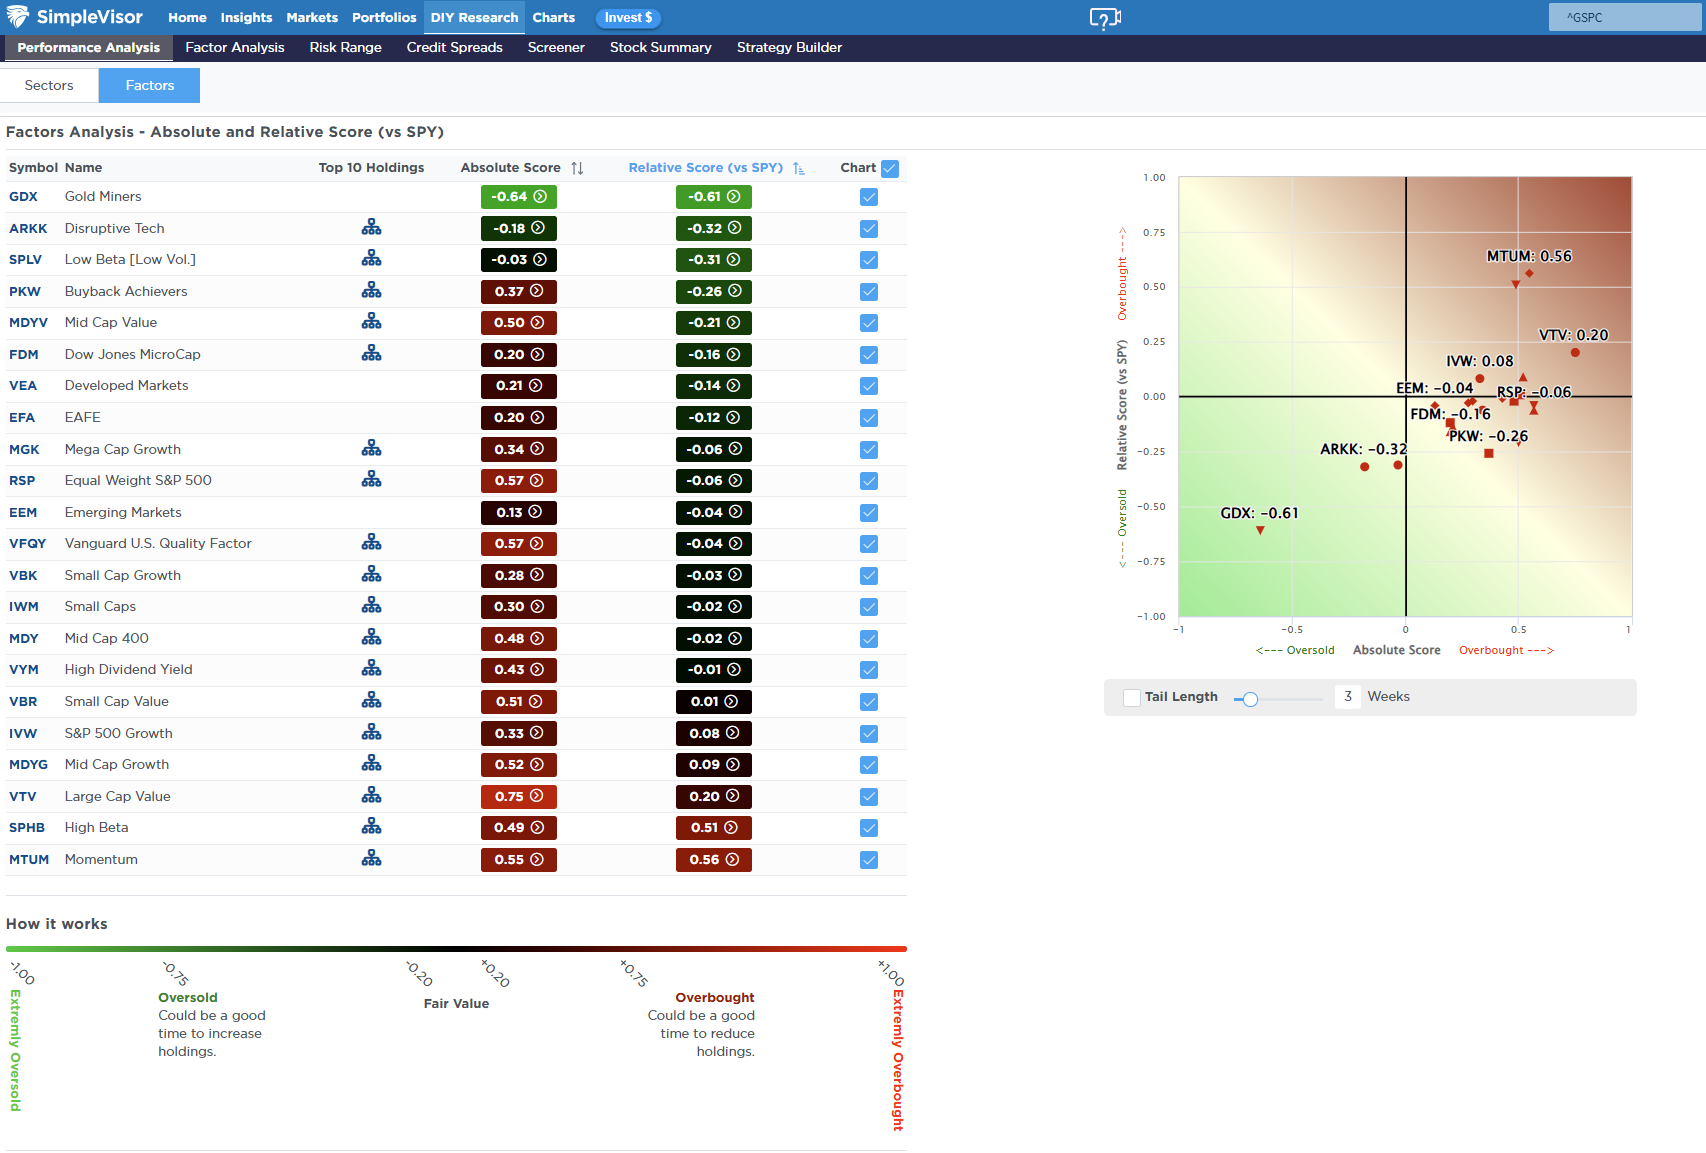
🔁 Relative Factor Performance
Last week, we noted that “Momentum accelerated along with S&P High Beta stocks to more extreme overbought conditions as money continues to chase just a handful of names. It remains the most overbought factor.” The correction that started last week, was inevitable and likely has more room to go as money rotates from risk-on to risk-off. Trade accordingly this next week and continue to control your risk exposures until we get a better entry point to increase exposures.
📊 MFBR Index (Money Flow/Breadth Ratio Indicator): 55% = Bullish
NEW! MFBR Index: The Money Flow Breadth Ratio (MFBR) model is a rules-based equity allocation framework that uses weekly S&P 500 money flow data to generate buy, sell, and neutral signals. The MFBR systematically adjusts portfolio equity exposure in response to the direction and persistence of institutional capital flows. It aims to reduce drawdowns while capturing the majority of market upside.
“”As of June 5, 2026, with the S&P 500 at 7,383.74, the Money Flow Breadth Ratio (MFBR) stands at 55% and rising. This places the indicator in the 50-60% range, triggering a NEUTRAL signal. The prior week reading was 55%, representing a 5% decline over the trailing four weeks. Despite Friday’s sell-off, the model currently recommends HOLDING exposure at 100%, a level that has remained since April 17, 2026 (7 weeks). This reflects a FLOW-OVERLAY OVERRIDE: the trailing 4-week net dollar flow has swung sharply positive (>$300B) after a deeply negative prior 4 weeks, a historically strong contrarian buy signal.”

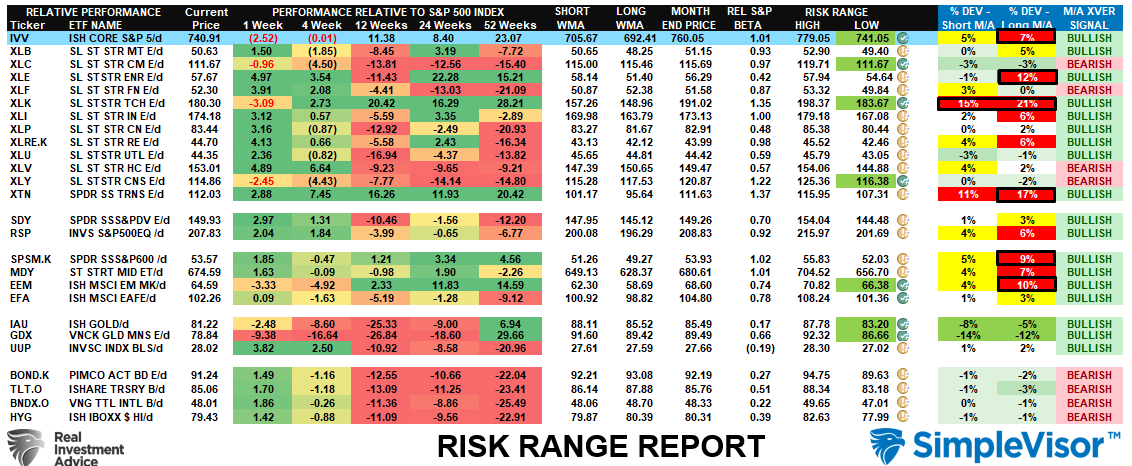
📊 Sector Model & Risk Ranges
As noted last week, “The broad market is very overbought and trading well above its normal monthly range, along with Technology, which has been responsible for the majority of the market’s recent advance. Technology is increasingly deviating from its short- and long-term means, and a reversal is becoming much more likely.” That correction came this past week, and the deviations started to reverse. Technology, Energy and Transportation are still well above long-term means, but those deviations are closing. As discussed previously, the risk of a rotation was elevated so the process of risk management paid dividends.
Have a great week.
Lance Roberts, CIO, RIA Advisors

