
There is plenty in the media about whether this recent market surge is driven by strong earnings and upwardly revised earnings estimates, or by market mechanics. While earnings have been impressive, the bulk of the fundamental performance has been driven by a handful of AI/technology companies. Similarly, while the broad market indexes have performed well, the bulk of the gains are coming from a relatively small handful of companies. For instance, seven of the last ten record highs have occurred on days when more stocks fell than rose. In a recent ZeroHedge article, UBS quantifies it bluntly:
In the period Monday open to Wednesday close, the S&P 500 has gained 45.32pts, a move entirely attributable to the Magnificent 7, which contributed +47.34pts — meaning the remaining ~495 constituents subtracted a net 2pts in aggregate.
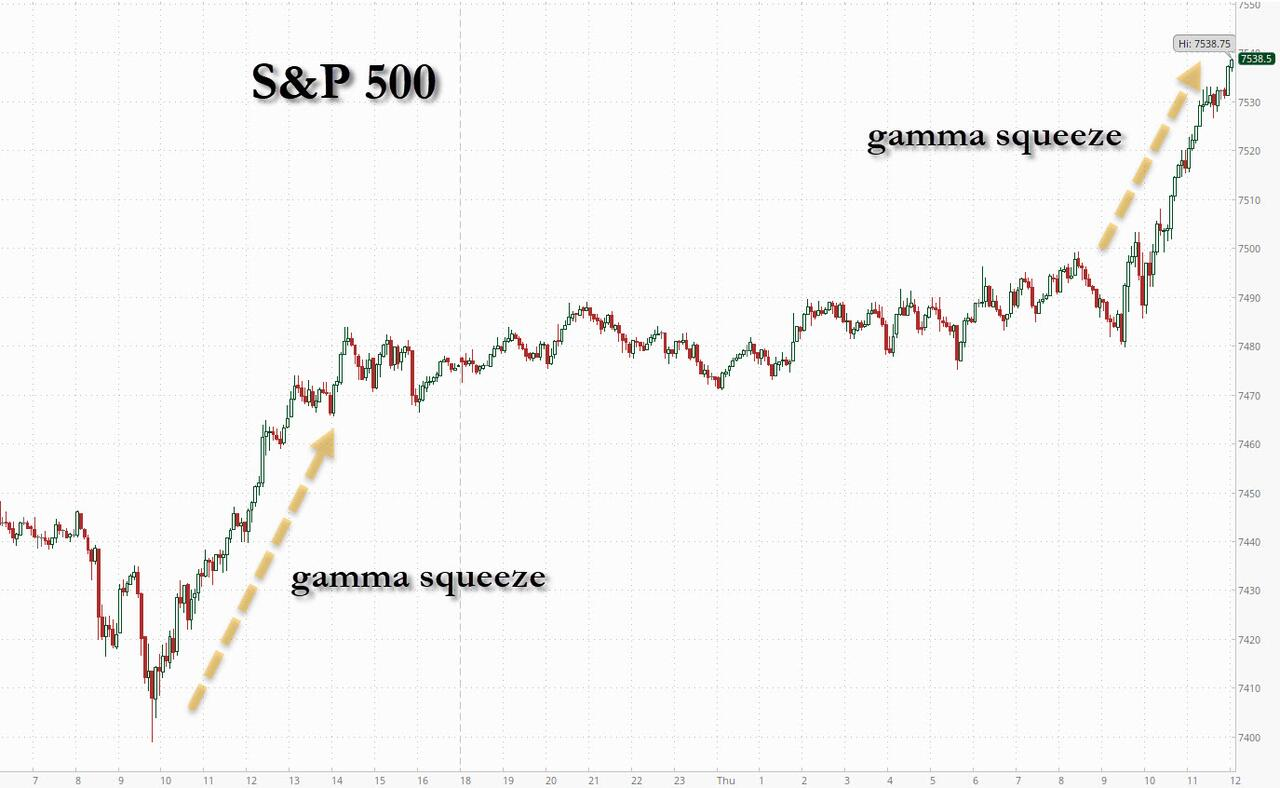
The poor market breadth and significant gains in some stocks, particularly semiconductor and hardware stocks, lead us to favor market mechanics as the primary driver of the rally. By market mechanics, we refer to momentum and heavy volumes in the options market. In our recent article, Gamma And Momentum: A Recipe For Spikes And Tears, we discuss how significant options trading volumes, coupled with option hedging mechanics, can create gamma squeezes that can have a potent impact on the market. To wit, per the ZeroHedge article, Goldman’s Delta-One desk said:
SPX gamma exposure has surged to one of the highest levels since 2021, making large downside moves mechanically harder into expiry, absent an exogenous shock. But rates remain the bogeyman.
In other words, performance-lagging funds and retail investors are piling into calls, thus forcing dealers to buy stock to hedge, which raises call prices and creates a self-reinforcing loop. Note that the Goldman quote above ends with “rates remain the bogeyman.“
With the 30-year UST yield above 5.00% and Japanese bond yields rising rapidly, could high yields be the culprit that reverses the market and forces the same mechanics that pushed prices higher to work in the opposite direction? As we wrote in our Gamma article, the same mechanics that drive prices higher can accelerate the decline. The question isn’t whether the gamma squeeze ends, it’s what triggers it.
What To Watch Today
Earnings
- No notable earnings releases
Economy

Market Trading Update
The S&P 500 closed Friday at 7,408.50, surrendering Thursday’s historic first close above 7,500 with a 1.24% decline. The semiconductor names that powered the rally became the source of Friday’s selling. Intel fell 5%, Micron 4%, AMD 3%, and Nvidia 4.4%. From a purely technical standpoint, Friday’s reversal was the first real distribution day in three weeks and the mean-reversion signal we have been flagging.
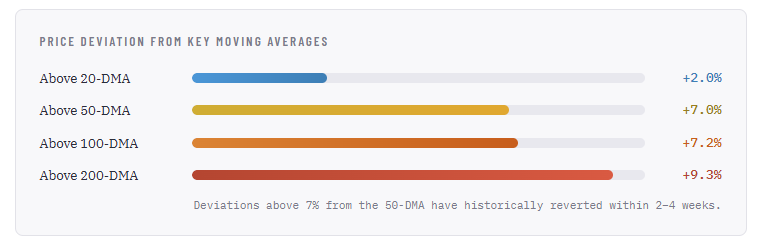
The deviation numbers are the story. At 7.0% above the 50-DMA (6,921) and 9.3% above the 200-DMA (6,780), the index is stretched to a degree that has preceded every meaningful pullback over the past two years. The RSI, however, tells a more nuanced story: at 67.15, it has already pulled back below the 70 overbought threshold. Friday’s selloff did real work in resetting the oscillator. The MACD, while still positive at +1.54, has narrowed significantly from the 40+ readings earlier in the week, with the signal line (148.10) now nearly converging with the MACD line. A bearish crossover is likely on Monday, even if the market stabilizes.
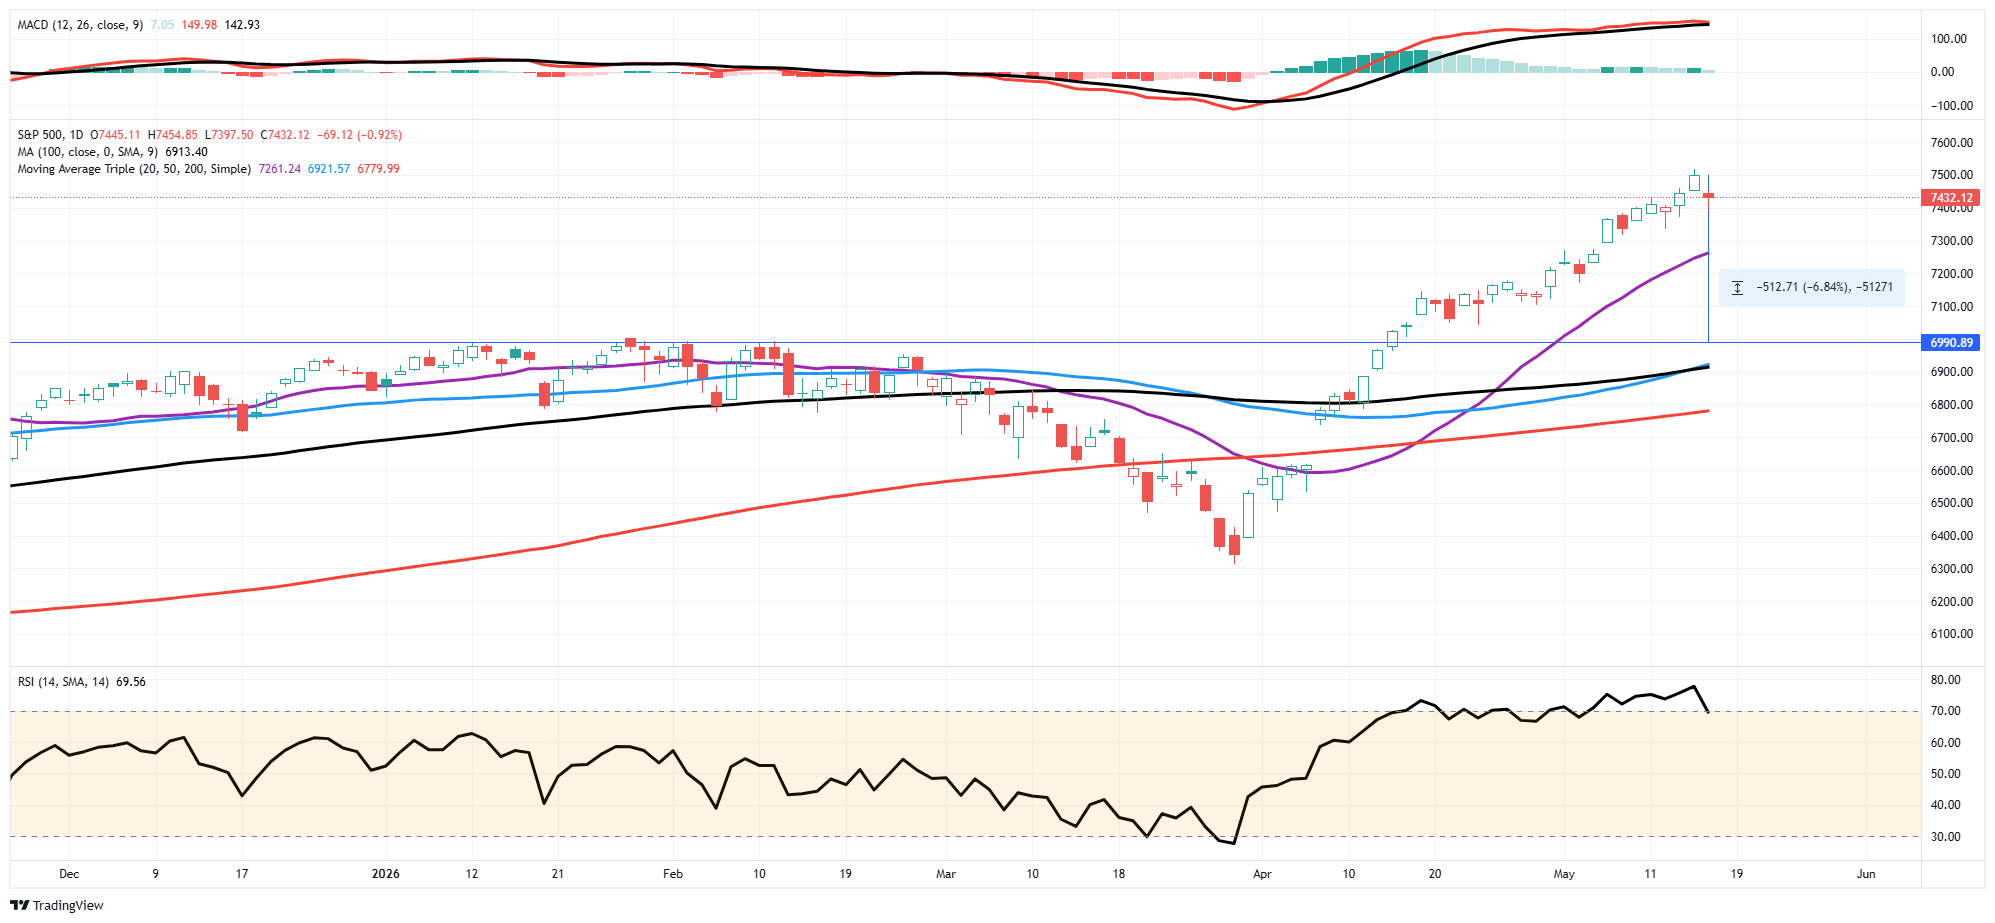
The erratic style rotation we discussed in this week’s Daily Market Commentary, value leading Monday, growth getting slapped Tuesday, then flipping again on Wednesday, intensified into Friday’s close. Single-stock implied volatility is running 2.5x the index VIX, meaning the calm headline masks violent sector-level moves. The gamma feedback loop driving the semiconductor surge works in reverse on the way down: when call flow dries up, market makers sell the underlying to flatten their books. Friday’s action in MU, AMD, INTC, and NVDA is the process beginning.
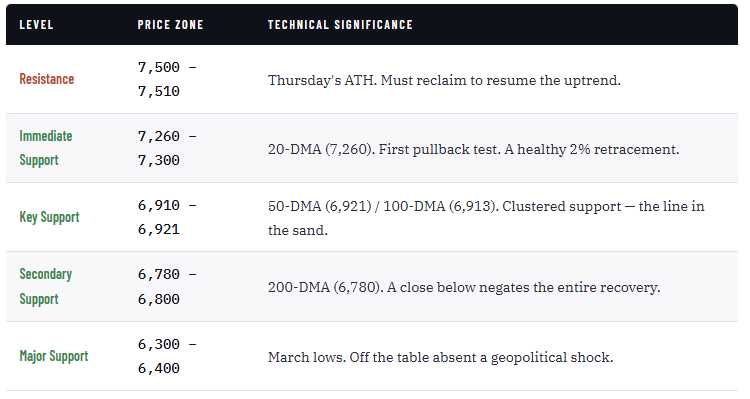
The bull case: the primary trend is up, the RSI has already pulled back below 70 without breaking any support, and the 20-DMA at 7,260 should attract dip buyers on an initial pullback.
The bear case: the 7% and 9.3% deviations above the 50- and 200-DMAs are extreme, the MACD is on the verge of a bearish crossover, and the gamma unwind in semiconductors has only just begun.
The base case is a pullback toward the 20-DMA (7,260), not a breakdown. A deeper correction to the 50/100-DMA cluster near 6,913–6,921 would represent a 6.6% decline from Friday’s close, painful but technically healthy. Use the 20-DMA as the near-term line: a close below opens 6,921 quickly. Trail stops, take profits in extended names, and use any test of the moving average cluster as an opportunity to add. Trade accordingly.

The Week Ahead
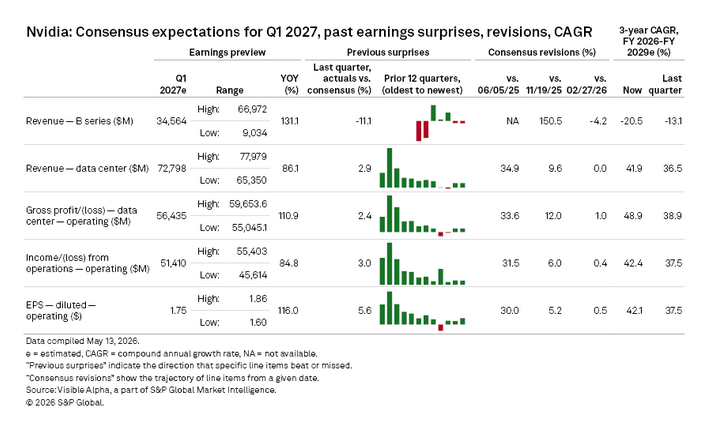
With little economic data due this week, the market will likely focus heavily on Nvidia’s earnings report on Wednesday. While their typical sales and earnings data, along with guidance, will be closely monitored, it will be interesting to see whether any comments from them support the recent rush into CPU semiconductor stocks or pour cold water on their recent ascent. The table below, courtesy of S&P Global, shows the consensus estimates for Nvidia’s key earnings measures.
The FOMC minutes from the last meeting will also be released on Wednesday. Given the three dissents at that meeting, the minutes may provide more detail on the Fed’s debate and, importantly, how the dissenters are balancing weak labor growth with higher inflation. Importantly, for the FOMC as a whole, do they view the recent inflation as transitory due to Iran, or is there a growing concern that there might be some stickiness to higher inflation even if the price of oil were to revert to pre-conflict levels?
The Stagflation Narrative: What Doomers Get Wrong Part II
The doomers have legitimate inputs. Supply chains are genuinely under pressure, and the dollar currently faces real structural headwinds. Central banks have been buying gold at a historic pace. Equity valuations in certain segments are stretched, and every one of those observations is defensible. However, the leap from those observations to “sell everything, go all-in on commodities, bonds are dead forever, the great reset is here,” is where the analysis ends and the storytelling begins.
I want to do two things here. First, I’ll score the stagflation narrative claim-by-claim. We will give credit where it’s earned and expose where the logic collapses. I’ll lay out what a sound investment framework actually looks like when the data, not the narrative, drives the decision. Moreover, why the boom-bust nature of commodity markets and the AI-driven capex cycle both fundamentally change where allocations belong.

Tweet of the Day
“Want to achieve better long-term success in managing your portfolio? Here are our 15-trading rules for managing market risks.”
Please subscribe to the daily commentary to receive these updates every morning before the opening bell.
If you found this blog useful, please send it to someone else, share it on social media, or contact us to set up a meeting.

