
At the start of the year, Wall Street voiced concern about Nvidia’s so-called Blackwell Cliff. The Blackwell Cliff is essentially an air pocket between demand for its current Blackwell chip generation and for its next platform, Vera Rubin. Specifically, the concern was that large hyperscalers would front-load Blackwell orders, leading to a pause in purchasing orders as they would have excess chips.
Based on Nvidia’s last earnings report, the data and executive commentary tell a different story. Blackwell’s backlog of 3.6 million units sold out through late-2026, with supply, not demand, remaining the binding constraint on Nvidia’s growth. Meanwhile, the new Vera Rubin generation of chips is already in its sampling phase, and first production shipments are expected to begin in Q3 2026, with volume ramping through Q4 2026 into 2027. The transition window, or potential Blackwell Cliff, is now measured in months, not years, as Wall Street worried.
At the recent GPU Technology Conference (GTC), Nvidia CEO Jensen Huang confirmed there are over $1 trillion in combined Blackwell and Vera Rubin purchase orders through 2027. That was double his $500 billion projection at the 2025 conference. The real risk for Nvidia investors is not the Blackwell Cliff but whether a $3 trillion market cap already prices in Huang’s lofty expectations for the next few years.

What To Watch Today
Earnings

Economy

Market Trading Update
Yesterday, we discussed the market internals behind the current market rally. While those internals suggest a correction is likely, and “everyone” seems to be expecting it, I wanted to delve into the history of 10%+ corrections (like the one we had in April) and what happens afterward statistically.
Let’s start with what this rally actually is. The market ALREADY took its medicine this year. It fell roughly 10% to the early April low, and what we’ve seen since is a recovery, not an unanchored melt-up. That’s the pattern after most corrections. Since the end of World War II, the S&P 500 has booked 33 declines of 10% to 20% on a closing basis. The table tracks each one from the day the decline began, how long it took to bottom, and then the prize for sitting tight: the rally from that low to the next market peak, and how long that climb lasted.

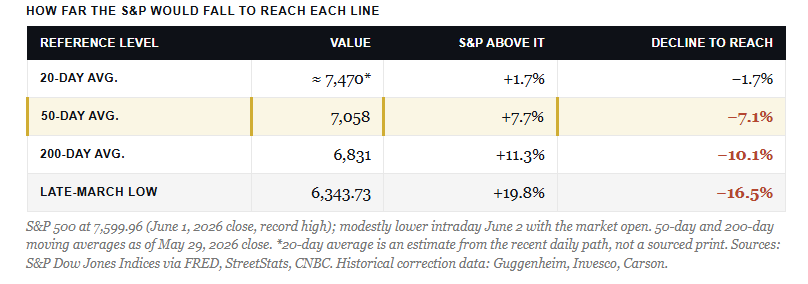
The typical correction cuts about 14% over roughly four months, and the rally off the low has historically run a median 34% over about 10 months before the next peak. This year’s advance is 19.8% in about two months. Fast, yes; however, by this table’s standard, it is still on the young side. As Bob Farrell’s Rule #4 reminds us, exponential moves usually run further than anyone expects before they roll over.
So how big would the feared pullback be? This is where the moving averages do the talking. At 7,600, the index sits about 7.5% above its 50-day average near 7,100 and about 11% above its 200-day average near 6,842. Those gaps are the answer. A garden-variety reversion to the 50-day is a 7% decline. A deeper flush all the way to the 200-day is a 10% decline, and even that holds above the March low and leaves the uptrend intact.
That maps cleanly onto the historical norm. The market corrects 5% to 10% in almost every calendar year, and since we’ve already booked the double-digit drop in March, the odds favor the shallow version next. The last genuinely deep decline, the roughly 20% drawdown that bottomed in April 2025, is already well behind us. Back-to-back deep corrections inside the same window are the exception, not the rule.

For investors, the market is trending positively, economic growth remains resilient, and earnings expectations are rising. The catalysts for a deeper correction are not readily present. As such, a normal 5% to 8% pause here only takes us to the 50-day. That’s the place where buyers will want to add exposure, not abandon it. However, given the market’s complacency, a 5-8% correction will “feel” much worse than it actually is. Don’t overreact.
Make no mistake, an overbought tape can pull back hard and fast, and an RSI north of 73 says we’re stretched. But stretched is not broken. The bottom line is that the math of this rally argues for a pause, not a peak.

Berkshire Gets A Deal On Alphabet’s Stock
Yesterday, Alphabet announced a hefty $80 billion capital raise to fund its rapidly expanding AI infrastructure. Buried in that announcement was a detail worth examining: Berkshire Hathaway committed $10 billion to the deal at a discount to Alphabet’s current market price. Berkshire purchased $5 billion of Class A shares at $358.81 and $5 billion of Class C shares at $348.20. For context, the stock closed that day at $376.37 and $372.58, respectively. Accordingly, those purchases were at a discount of approximately 6% on the Class A shares and nearly 8% on the Class C shares.
In private placements, a discount to the current stock price is not unusual. Large investors in significant, headline-worthy equity raises routinely negotiate discounts in exchange for certainty of execution and the reputational credibility they bring to a deal. Having Berkshire anchor the offering enhances the offering’s overall credibility in Alphabet’s mind.
For Berkshire, the purchase adds to its position, which it has been building rapidly over the past three quarters, making Alphabet one of the company’s largest holdings. The important takeaway here is not just that Berkshire added to its Google position. It is that Berkshire extracted a discount to do so, and Alphabet accepted those terms. When a well-regarded and disciplined capital allocator demands a margin of safety on a $10 billion investment, and the counterparty agrees, both sides are telling you they see some funding risk in the market.

Tweet of the Day

New UPDATED Trading Rules With Desktop Printout
“Want to achieve better long-term success in managing your portfolio? Here are our 15-trading rules for managing market risks.”
Please subscribe to the daily commentary to receive these updates every morning before the opening bell.
If you found this blog useful, please send it to someone else, share it on social media, or contact us to set up a meeting.

