Wall Street has piled into the dollar debasement story; however, as is always the case, when everyone is on one side of the trade, the other side becomes more compelling. In Part 1, we explored why Dollar Dominance Remains Alive and Well. Today, we will explore the stronger-dollar trade, the one macro trade that nobody is sized for.
The most crowded short position on Wall Street right now isn’t tech. It isn’t the S&P. It’s the U.S. dollar. Speculators piled into eight straight weeks of dollar selling earlier this year, and asset managers flipped to a net-short DXY position for the first time in months. Every macro fund I read is leaning the same way: a weaker dollar, higher gold, higher commodities, and debasement everywhere you look. The stronger dollar trade, the trade against that consensus, is the pain trade of 2026. Make no mistake. When everyone leans the same way, the unexpected move tends to come from the other side.
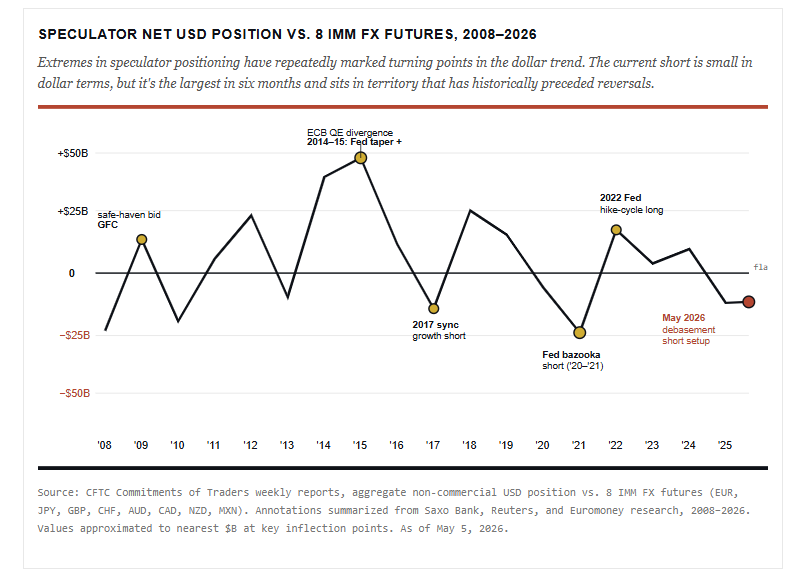
Positioning is the most useful tell in macro, because it tells you who is already wrong. Right now, almost everyone is on one side. Saxo’s COT review for early January showed the non-commercial dollar short across IMM FX futures running near $11.9 billion, the largest bearish bet in six months. Asset managers had flipped to net short DXY for the first time since mid-October, lining up with leveraged funds in a bearish view. As Bob Farrell’s Rule #9 reminds us, when all the experts and forecasts agree, something else is usually about to happen.
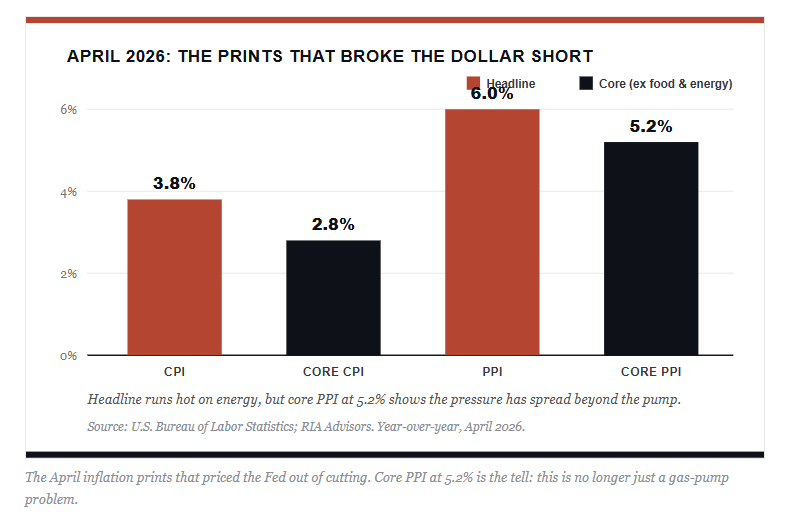
Here’s the problem with that argument. The debasement thesis assumed the Fed would cut. It assumed inflation would soften, and the euro, yen, and emerging-market currencies would catch a bid as global growth picked up. None of that has happened. April CPI ran 3.8%, the hottest since May 2023, and Producer prices (PPI) came in at 6% year over year, the fastest pace since 2022. Core PPI, excluding food and energy, hit 5.2%. Traders have priced out Fed cuts for all of 2026, and the odds of a year-end rate hike have climbed back to near 35% to 39%. The thesis behind the dollar short has fallen apart.

Now let me make the honest pushback on my own argument, because it’s the obvious counter. Most of that inflation spike is an oil shock. The US/Iran conflict that erupted in late February sent crude to four-year highs, and energy did the heavy lifting in both prints. Strip out food and energy, and core CPI sits at 2.8%, not 3.8%. So if you’re in the debasement camp, here’s your rebuttal: the inflation is temporary, oil rolls over, and the Fed cuts after all.
However, here is why I suspect that will turn out wrong. Look under the hood of the PPI, and you find that services drove roughly 60% of the April increase. That was the largest services gain since 2022, and core producer prices excluding food, energy, and trade ran 4.4% year over year. That is not a gas-pump story. That’s price pressure migrating into the broad economy, reflecting strong economic growth, and it doesn’t reverse the day crude does.
The dollar short needed two things: cooling inflation and Fed cuts. It’s getting NEITHER.

The Hawkish Pivot Behind a Stronger Dollar
Kevin Warsh’s confirmation as Fed Chair on May 13 cements the regime change, and the irony is worth sitting with. Trump picked Warsh expecting lower rates, and Warsh himself has said there’s room to ease. But he has spent the better part of a decade arguing against quantitative easing and for a smaller balance sheet, and he is walking into accelerating inflation that ties his hands. He may want to deliver the dovish gift the consensus assumed. However, the current data will not likely let him. Evercore ISI’s Krishna Guha noted that the April CPI release hands ammunition to the hawkish minority that thinks the next move could be up, not down.
Furthermore, Goldman has now pushed its rate-cut call out to December 2026 and March 2027, with just two quarter-point rate cuts. Those are almost a year away, against accelerating producer inflation, an oil shock, and a labor market that won’t crack. That is not a setup that produces a weaker dollar.
Lastly, the stronger dollar trade is only just beginning to stir. The index bounced from below 97 in late April to near 98.8 by mid-May, three sessions higher into the CPI print. Yet the dollar is still DOWN on the year, off roughly a percent and a half. That is the whole point. The trade hasn’t happened. The crowd is still short, the index is still red year to date, and the catalysts for a turn keep stacking up. This setup has room to run precisely because nobody is positioned for it.
I’ve been arguing for the better part of a year that the debasement crowd has the 1970s analog wrong. The reach for that playbook keeps surfacing on the macro circuit. The real yield picture is more complicated than either side of the trade wants to admit. Realized real yields, calculated as the nominal yield minus April’s 3.8% CPI print, sit at roughly +0.1% on the 2-year, +0.7% on the 10-year, and around +0.7% on the Fed funds rate. The 10-year TIPS-implied real yield is higher at 1.95%, reflecting forward inflation expectations rather than current realized prices. None of those numbers is punitive. However, they sit a world away from the 1970s, when real yields sank to negative 5%. The table below lays out the structural gaps that matter for the dollar. (Yields as of May 31, 2026; source: FRED H.15, U.S. Treasury, BLS CPI.)
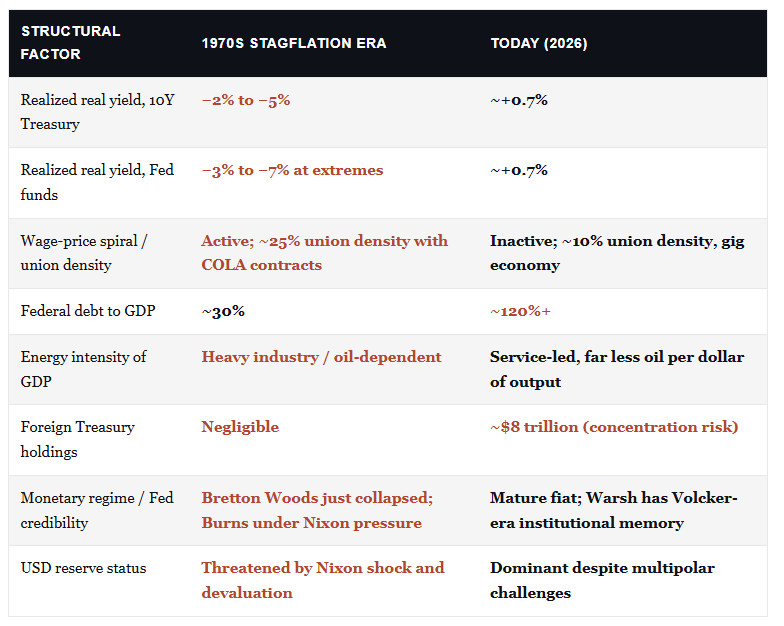
The bottom line on the analog. The debasement crowd is right that the U.S. fiscal picture rhymes with the 1970s in terms of debt and foreign Treasury concentration. However, the transmission mechanism that produced a 1970s-style dollar collapse, which was deeply negative real yields plus a wage-price spiral plus an oil-dependent industrial economy, simply doesn’t exist today. Without those three ingredients, the analog breaks.
What the Stronger Dollar Trade Means for Commodities
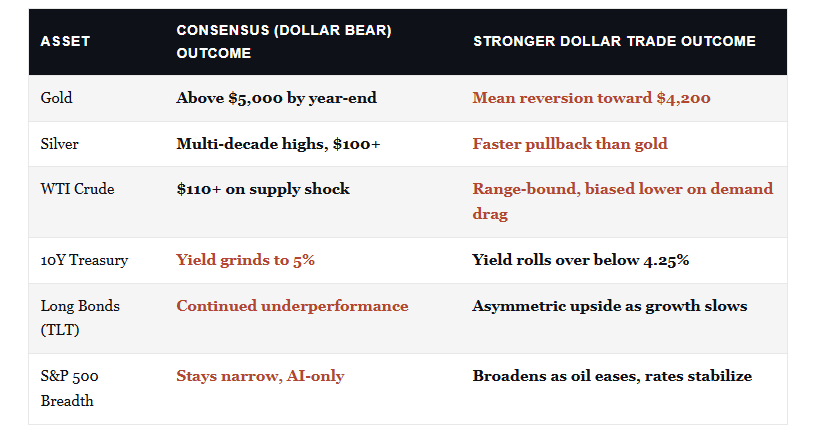
This is where the implications get sharp. Almost every dollar-denominated commodity has been priced for the opposite outcome. At the time of this writing, Gold sits around $4,569 an ounce, up more than $1,300 from a year ago, though already well off its January record above $5,600. Silver has pushed above $75, while WTI crude trades around $88/bbl with Brent above $91. The price action assumes a softer dollar, easier policy, and more debasement. Reverse the dollar setup, and the math runs the other way.
A stronger DXY puts immediate mechanical pressure on gold and silver. Both are priced in dollars and held by foreign buyers who become marginal sellers when their local currencies weaken against the greenback. Silver gets hit harder than gold, because its industrial demand softens at the margin when financial conditions tighten. However, Oil is the most interesting case. It’s torn between a real supply shock from the U.S.-Iran conflict and the price-suppressing effect of a firmer dollar plus slowing global demand.
Goldman’s delta-one desk argued this week that the market needs crude “sharply lower” to broaden equity participation beyond the Mag-7 leaders. A stronger dollar helps deliver exactly that, especially if Strait of Hormuz tensions ease. And here is the part that ties the whole thesis together. Even if oil rolls over, the services inflation we just walked through keeps the Fed sidelined. Yes, lower crude oil prices cool the headline number, but they do not free the Fed to cut. So the dollar keeps its support even as the commodity that started the inflation scare comes down.
The entire commodity supercycle thesis is built on a soft-dollar foundation. Pull the foundation out, and the trade reverses.
This is the part the gold-and-debasement crowd has backward. They argue that bonds and fiat are dead, and that the only refuge is hard assets. The reality is closer to the opposite.
A stronger dollar is the mechanism by which:
- Global tightening is transmitted.
- It drains liquidity from emerging markets,
- Raises the real cost of dollar-denominated debt for foreign issuers, and
- Slows global growth.
That slowdown eventually feeds back into U.S. inflation expectations and, with a lag, into Treasury yields.
The 30-year yield closed at 4.98% on May 11, just below the 5% line that BofA’s Michael Hartnett has flagged as the door to broader equity dysfunction. If financial conditions tighten enough to slow growth, that long-end yield falls rather than rises. Treasury bonds, beaten up for two straight years, would be the single largest beneficiary. The bond-as-stabilizer case hinges on exactly the dollar move the consensus says won’t happen.

How To Trade It
Let me steel-man the other side. The debasement story isn’t crazy. U.S. deficits are real, and the fiscal trajectory is ugly. Furthermore, foreign central banks are buying gold at the fastest pace in a generation, while Japan’s 30-year yield just hit 3.885%, the highest reading since the bond’s 1999 debut. The UK is in another gilt-market wobble after the Labor government’s troubles.
All of that is true.
Here’s what the debasement narrative gets wrong, though. Those problems exist everywhere, not just in the U.S. The euro has its own fiscal mess, the yen is dealing with its own bond market revolt, and the pound is under pressure from a political crisis. In a relative game, the dollar still has the best yield, the deepest capital markets, and a Fed that, however reluctantly, refuses to cut into accelerating inflation. The dollar wins the ugly-currency contest by default.
Therefore, if a stronger dollar trade persists, then a barbell approach to this setup makes the most sense. On one side, build dollar exposure directly through cash and short-duration Treasury bills, which yield north of 4% with no duration risk. On the other side, begin scaling into longer-duration Treasuries as the long end approaches 5% on the 30-year. TLT and similar long-duration vehicles are the asymmetric play if a stronger dollar tightens conditions enough to trigger a growth slowdown.
For commodity exposure, the case for trimming gold and silver is stronger than for adding. After a year-over-year gold gain north of $1,300, the easy money is in the rearview. Notice in the table above that the gold-silver ratio sits near 55, which is the middle of its historical range. Neither metal is dramatically cheap. For oil, hedge geopolitical tail risk with a small position rather than chasing the supply-shock narrative.
What does this mean for investors? Size to the consensus pain trade, not the consensus winners. The stronger-dollar trade is the macro setup that nobody is hedging. Therefore, it’s the setup most likely to produce the biggest portfolio surprise over the next two to four quarters.
Need A Different View?
If you’ve spent the last year piling into gold, commodities, and emerging markets on the debasement story, the next twelve months may not play out the way the brochure promised. However, that doesn’t mean the long-term picture is wrong; it just means the path will be far bumpier than consensus expects if the strong-dollar trade plays out. At RIA Advisors, we build portfolios to survive the path, not just to chase the destination. If you’d like a fresh look at how your current allocation maps against this risk, schedule a complimentary consultation today.
Sources
- U.S. Bureau of Labor Statistics, “Consumer Price Index, April 2026,” released May 12, 2026 (bls.gov/cpi). Headline CPI +3.8% y/y; core +2.8% y/y.
- U.S. Bureau of Labor Statistics, “Producer Price Indexes, April 2026,” released May 13, 2026 (bls.gov/ppi). Final demand +6.0% y/y; ex-food & energy +5.2% y/y; services drove ~60% of the monthly gain.
- CME FedWatch, year-end 2026 rate-hike probability, as of May 13, 2026 (≈30% post-CPI, ≈39% post-PPI).
- U.S. Senate roll-call vote / CNBC, “Kevin Warsh wins Senate confirmation as Fed chair,” May 13, 2026 (54–45).
- Saxo Bank, COT Forex & Commodities Review, January 2026; Forex.com FX futures positioning, citing CFTC, CME, and LSEG data.
- Evercore ISI commentary on the April CPI release, May 13, 2026.
- Goldman Sachs published research on Fed rate-cut timing (December 2026 / March 2027); Goldman delta-one desk commentary, week of May 11, 2026.
- FRED (Federal Reserve Bank of St. Louis), 30-Year Treasury Constant Maturity (DGS30), 4.98% on May 11, 2026; effective federal funds target range 3.50%–3.75%.
- Trading Economics / Yahoo Finance, U.S. Dollar Index daily quotes, as of May 14, 2026; gold, silver, WTI, and Brent spot quotes, May 13–14, 2026.
- Bank of America, Michael Hartnett, “Flow Show,” on the 5% 30-year-yield threshold.
- Bank of Japan / Japan Ministry of Finance, 30-year JGB yield, May 2026.

