
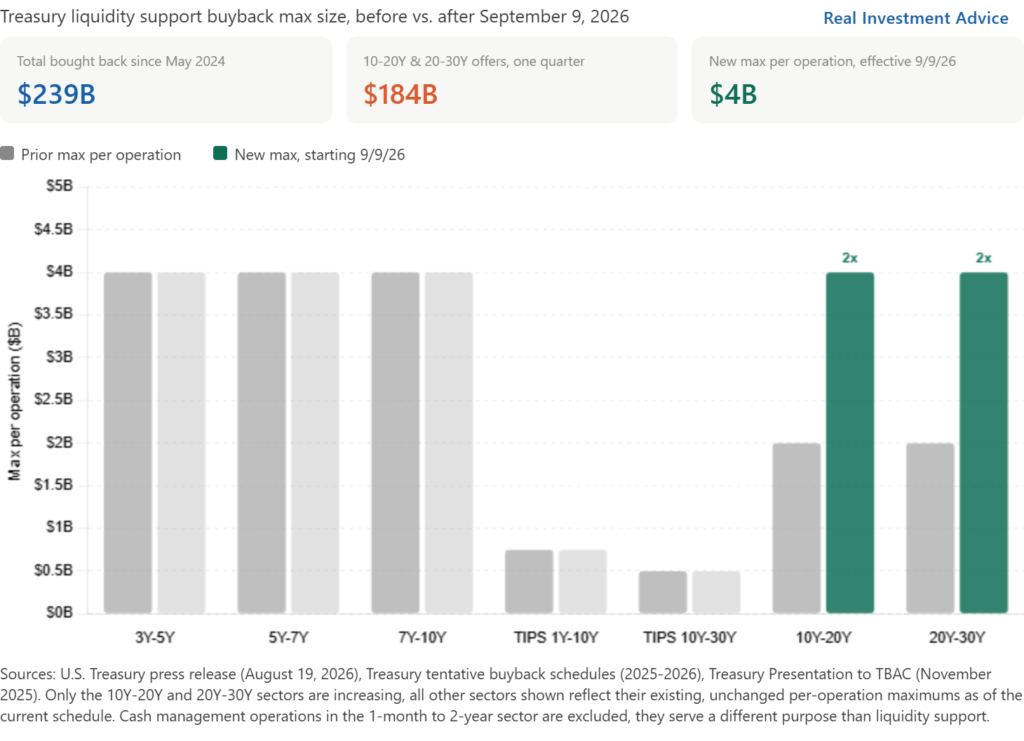
The U.S. Treasury announced yesterday that it will at least double its liquidity-supporting buyback operations for Treasury notes and bonds with 10 or more years to maturity. The current per-operation cap of $2 billion will rise to at least $4 billion, effective September 9, 2026, and remains in place through November 4. While very close to the midterm elections, the action may appear political, but the date marks the end of the Treasury refunding cycle.
The Treasury frames buybacks as a debt management tool, not a stimulus measure. In these buyback operations, the Treasury will purchase longer-maturity, less liquid bonds from the market, using cash raised through new debt issuance, to smooth out kinks in the yield curve. The action helps the Treasury market function more efficiently.
Treasury framed the increase as a response to demand rather than a policy shift, claiming “the significant volume of high-quality offers Treasury routinely receives in longer-dated buyback operations” as evidence of “consistent strong sponsorship from market participants.” Basically, when the Treasury has offered to buy back long bonds, dealers and investors have shown up in size wanting to sell, and Treasury is now willing to absorb twice as much as they were.
While Treasury claims it’s a market management operation, the timing is notable given the pressure on the long end of the yield curve, with the 30-year yield touching its highest level since 2007. Many pundits will deem this action to be QE. In that sense, it essentially manipulates markets like the Fed’s QE operations. However, it doesn’t change the total supply of debt or the money supply. The action isn’t an outright purchase like QE, but an asset swap: issuing shorter-term debt to buy longer-term debt.
What To Watch Today
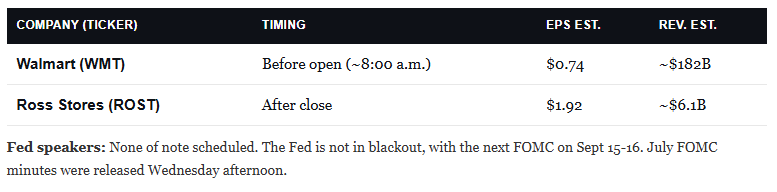
Earnings
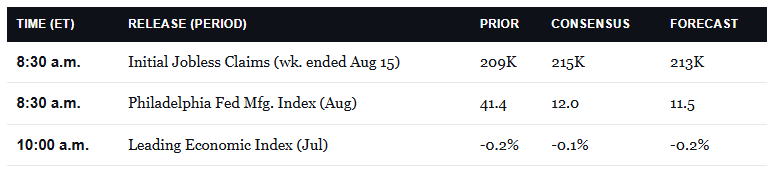
Economy
Market Trading Update
Yesterday, we made the buy-the-dip case on the other side of the market, walking through why oversold bonds favored a tradeable bounce. Today, the momentum trade forces the same question in reverse. After a selloff, then a rally, it is under pressure again. Do you buy this dip, or wait?
Let’s start with the price action. The iShares MSCI USA Momentum ETF (MTUM), the cleanest proxy for the trade, closed Tuesday at $311.81 and trades lower again as I write, near $307.50 by late Wednesday morning. That’s back below its 50-day average of $316.12, capping a familiar three-act pattern. Momentum peaked June 22 at $345.22, then bled almost 18% into the July 29 low of $283.11. It rallied back to $322.07 by Monday, recovering nearly two-thirds of the drop. Then the bounce stalled right at the 50-day and rolled over, off about 4.5% in two sessions.
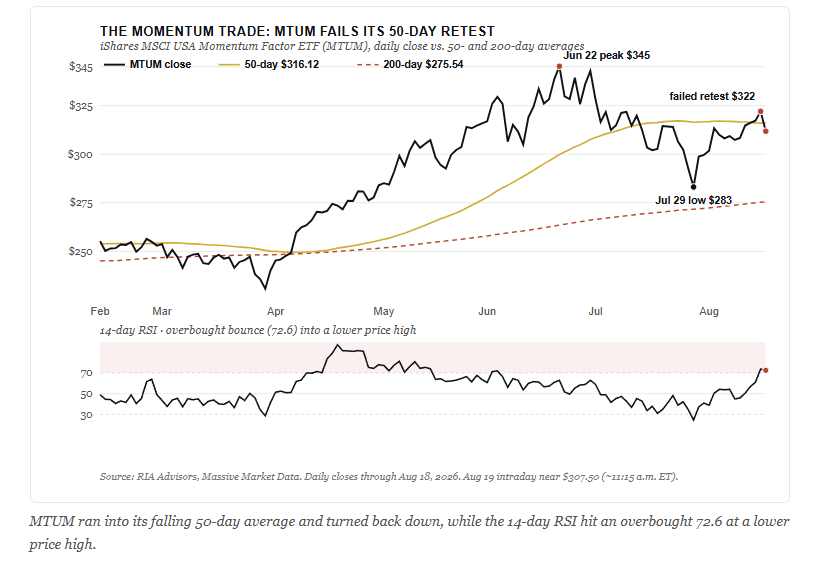
The previous rally pushed the 14-day RSI to 72.6 at Tuesday’s close, an overbought reading, yet the price never reclaimed its old high. A lower high against an overbought momentum gauge is the signature of a failed retest, not a fresh breakout, and increases short-term risk.
Also, notice how far momentum remains above its rising 200-day average near $275.50, roughly 11% above even after this pullback. Exponential moves, as we saw previously, can run further than you think, and the eventual unwind of a crowded winner tends to also travel further in reverse.
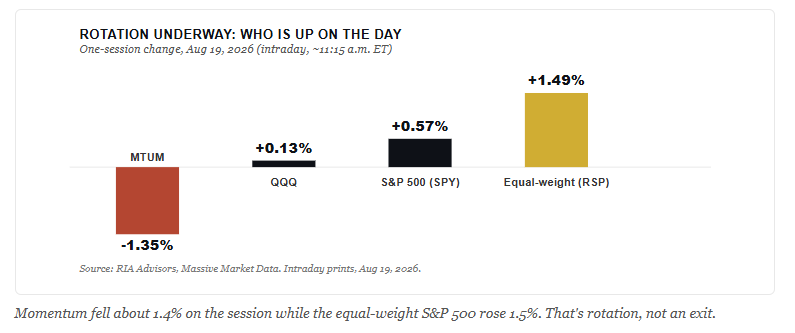
Momentum fell about 1.4% Wednesday while the equal-weight S&P (RSP) gained 1.5% and the cap-weight index held green. That rotation is important as money isn’t leaving stocks; it’s just rotating out of the crowded leaders into other areas of the market. Now layer on the August 21 gamma cliff we flagged yesterday, where Friday’s options expire, the dealer hedging that muffled volatility fades, and the window of weakness lands right as these names roll.
So, buy or wait? In our opinion, you wait. The place to add is pretty well defined. If MTUM can reclaim $316, it flips the structure back to higher levels. A flush toward the July low near $283, or the 200-day near $275, pays far better risk-reward. Be patient, and let the market tell you where it is heading to next.

Crack Spreads Are Soaring: What It Means
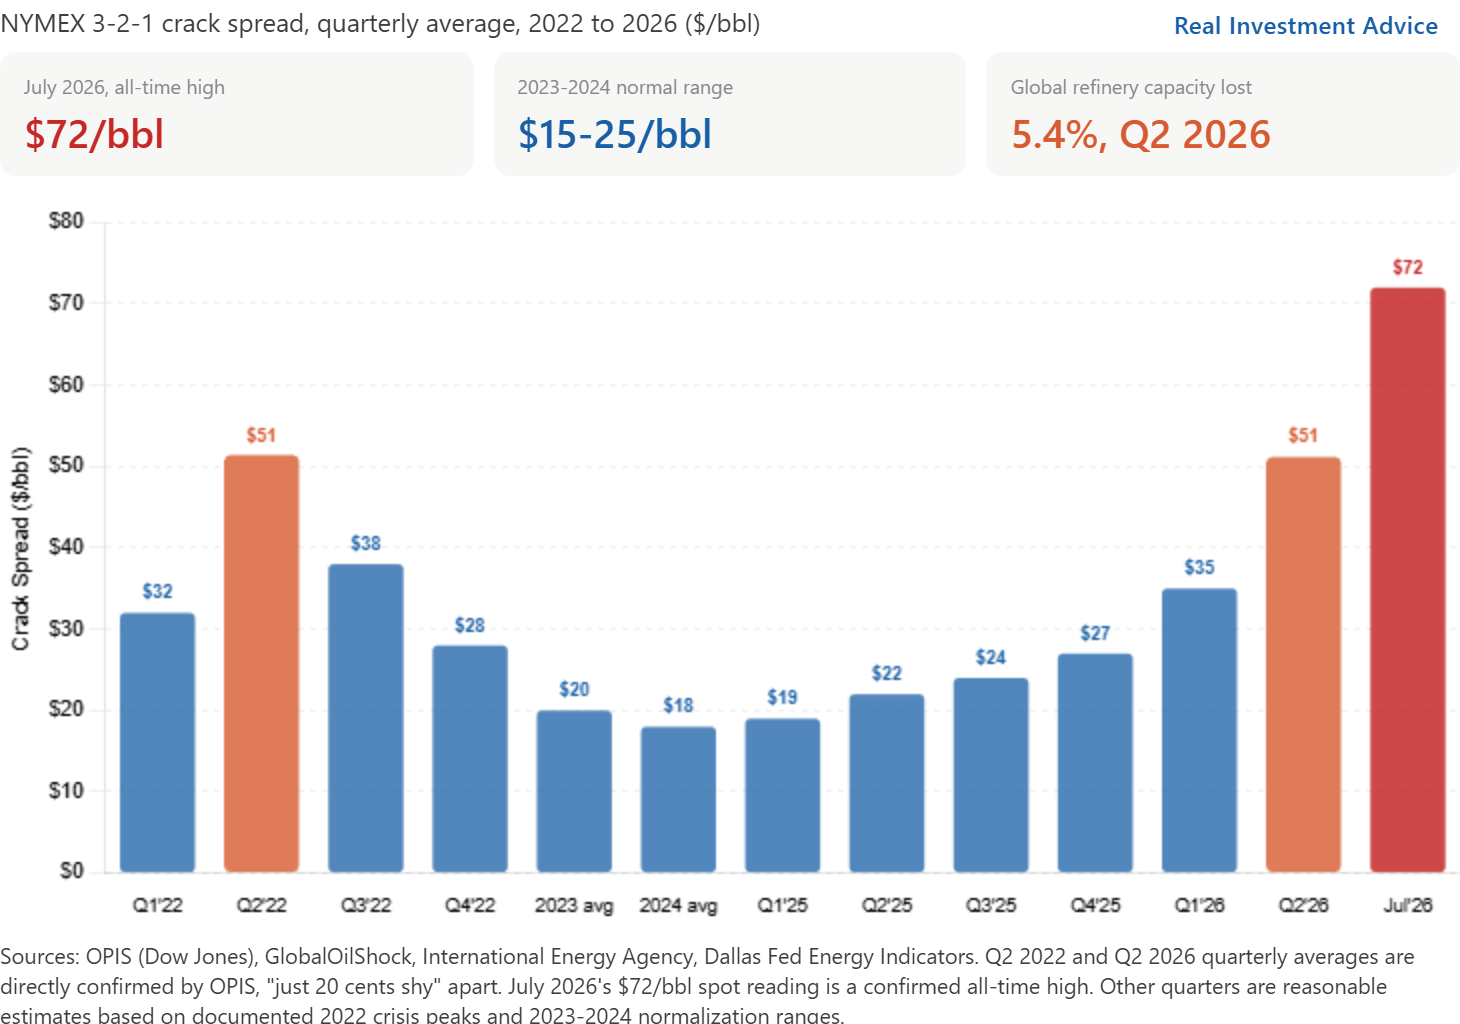
The crack spread measures the profit margin refiners earn turning crude oil into finished fuels like gasoline and diesel. Essentially, it measures the difference between what a barrel of crude costs and what the refined products from it sell for. The most widely watched version, the 3-2-1 spread, just hit an all-time high of $72 per barrel on NYMEX, according to OPIS, as we show below.
The driver of high crack spreads is a refining bottleneck, with little to do with high crude prices or supply issues. The IEA estimates permanent plant closures and war-related damage have cut global refinery output by 4.5 million barrels per day, equating to 5.4% of capacity. Further, Ukrainian strikes on Russian refineries and new sanctions have forced Russia to suspend diesel exports, accounting for a loss of approximately 0.8 to 1.0 million barrels per day. Dallas Fed data shows Gulf Coast utilization rates are running near capacity (93% to 95%), meaning refiners have little room left to produce more even as margins soar.
The largest domestic refiners, Marathon Petroleum and Valero, have each nearly doubled in 2026, and Phillips 66 is up 66%.
The economic impact is more important than refiner profits. Crack spreads tend to lead retail gasoline and diesel prices by four to eight weeks. Diesel prices also have a big impact on agriculture, shipping, and freight. All that said, refining bottlenecks can self-correct rapidly once outages clear. But with winter heating demand approaching and capacity already near its ceiling, diesel costs are a real, underappreciated inflation risk into year-end as well as a negative economic growth threat.
Three Percent Real TIPS Yields: Boring But Valuable
Would you consider investing in a bond that earns more than three percent after accounting for inflation? What if that security has zero chance of default?
Such an opportunity exists today in US Treasury Inflation-Protected Securities (TIPS).
One more question: Would your answer change if the expected real return on stocks over the next ten years was well below three percent?


Tweet of the Day
New UPDATED Trading Rules With Desktop Printout
“Want to achieve better long-term success in managing your portfolio? Here are our 15-trading rules for managing market risks.”
Please subscribe to the daily commentary to receive these updates every morning before the opening bell.
If you found this blog useful, please send it to someone else, share it on social media, or contact us to set up a meeting.