
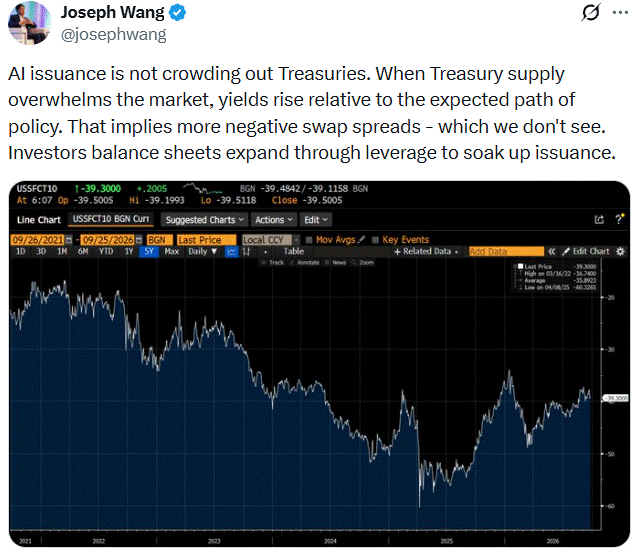
Monday’s Tweet of the Day in the Daily Commentary highlighted rising swap spreads and noted that Treasury issuance is not the problem many pundits make it out to be. Swap spreads are a great gauge for the health and liquidity of the US Treasury market, so it’s worth appreciating the Tweet below.
A swap spread is the fixed rate on an interest rate swap minus the Treasury yield of the same maturity. As the graph shows, swap spreads have been negative for years, currently sitting around negative 39 basis points. At first glance, that doesn’t make sense since swaps have bank counterparty risk and Treasuries are risk-free. So why would Treasury yields be higher than riskier swap yields?
The answer is balance sheet capacity. Owning bonds requires banks to hold capital. A swap is a derivatives contract that consumes little capital. When debt supply is heavy relative to available bank balance sheets, bonds tend to cheapen against swaps to offset the regulatory costs of holding them.
If Treasury and AI-related debt issuance were overwhelming the market, swap spreads would be declining deeper into negative territory. Instead, the opposite has been happening. Spreads bottomed near negative 60 in April 2025 and have recovered somewhat. This suggests bond absorption got easier, not harder, despite heavy Treasury issuance and recent AI borrowing.
Two caveats to consider. The five-year average is negative 36, so today sits slightly below normal rather than above it. Treasury buybacks have been reducing the spread as they rely on more bill issuance while buying back off-the-run issues that can clog dealer inventory. Also bear in mind that swap spreads measure whether the market can clear the supply but nothing about the yield the market is willing to pay for it.
What To Watch Today
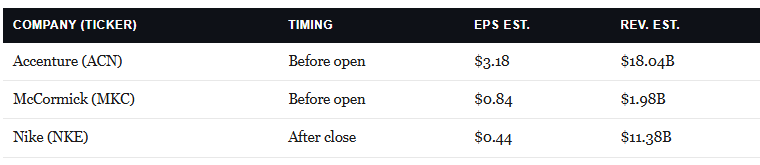
Earnings
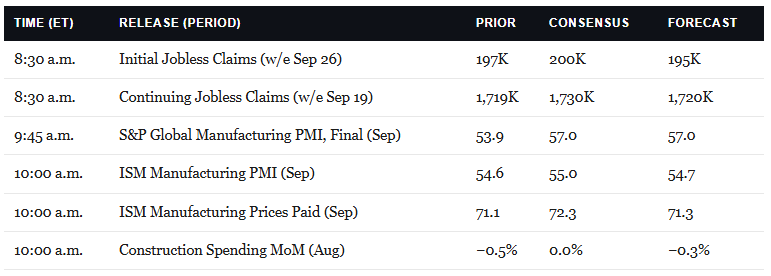
Economy
Market Trading Update
Yesterday, we laid out the seasonal case for a strong fourth quarter, noting that October has been the best month of midterm years since 1950, averaging a 3.0% gain. Today, Goldman Sachs one-delta desk head Rich Privorotsky adds a “wall of worry” checklist that supports that view. Seasonality, high real rates, cautious sentiment, the midterms, and oil all made his list. His conclusion is that the S&P 500 and Nasdaq sit on the verge of another breakout, and that it’s the kind of rally investors will remain “poorly subscribed to.”
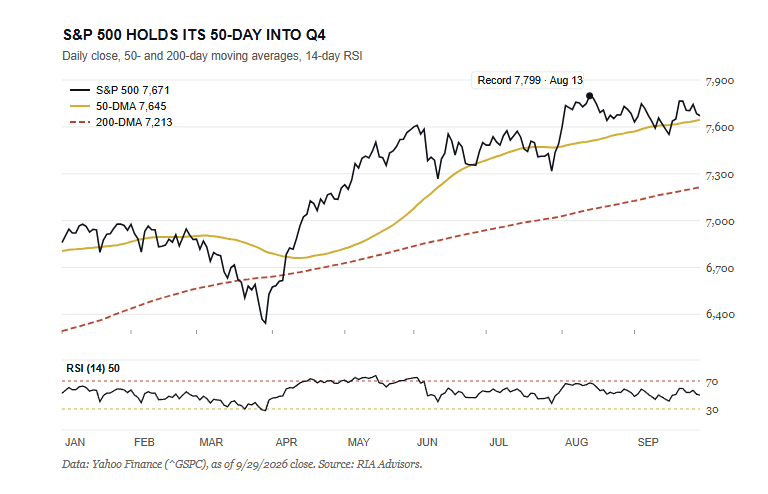
Let’s check his list against the tape. The S&P 500 closed Tuesday at 7,671, about 1.6% below the August 13 record of 7,799. The index is holding just above its 50-day moving average at 7,645 and sits 6.3% above the rising 200-day average at 7,213. The September 16 dip to 7,552 briefly broke the 50-day, and buyers stepped in. RSI sits at a neutral 50, and the MACD buy signal we noted yesterday remains intact, if narrowing. That’s a market that has worked off its September seasonal weakness without breaking anything.
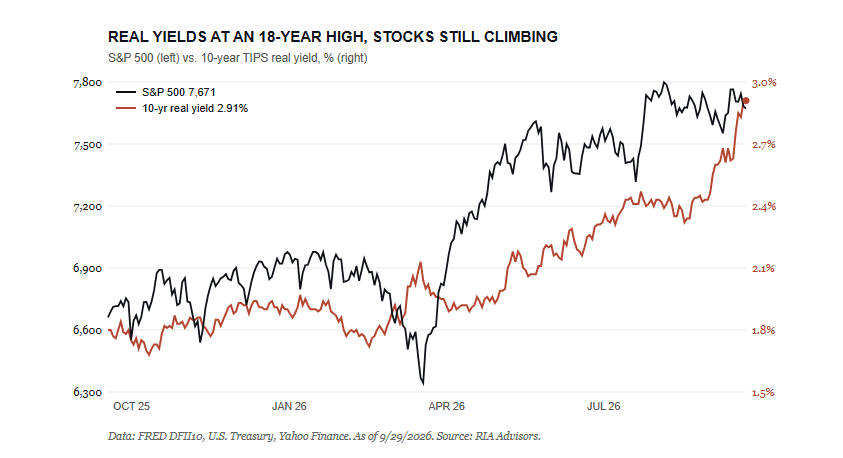
Only one item on the list is NOT a mood. The 10-year real yield, per Treasury’s TIPS curve, hit 2.91% on Tuesday. That’s the highest level since November 2008, up 47 basis points in September alone. As shown below, stocks and real yields have climbed together all year. Privorotsky argues that “agentic” AI adoption will prove structurally disinflationary and positive for equities. Maybe so. But a 2.9% real yield raises the hurdle every valuation has to clear, and that pressure lands first on the parts of the market without an AI story.
You can already see it in the internals. Since August 31, the cap-weighted S&P 500 ETF (SPY) slipped 0.4% while the equal-weighted RSP fell 4.5%. Financials (XLF) dropped 6.4%. Meanwhile, the semiconductor ETF (SMH) gained 9.0%, and TSMC, which Privorotsky calls the “mothership” of global hardware, rose 10.0%. The rally is real, but a narrow group is carrying it.
Oil is the one worry that has eased, with WTI near $91, down from a six-month high near $113. Sentiment remains cautious, which is typically bullish from a contrarian view. Bob Farrell’s Rule #9 reminds us that when everyone agrees, something else happens. Right now, the agreement is that this rally can’t work. Such is the nature of a market that climbs on doubt.
What does all this mean? Well, the setup for Q4, as noted yesterday, has improved. Therefore, we want to stay invested for the seasonal tailwind and let the wall of worry do its job, but we manage risk at the line.
Let’s revisit the numbers to watch from yesterday’s post.
The 50-day at 7,645 is the first test. A close below the September low of 7,552 is our signal to reduce equity risk.
The wall of worry is climbable. Falling off it is what hurts.

October Rate Hike Odds Slide On Better Inflation Data
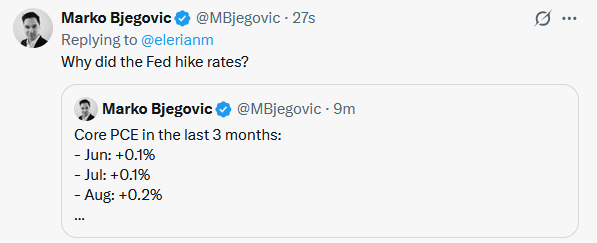
The PCE price index rose 0.3% as expected, but the core index rose by 0.2%, a tenth below expectations. Furthermore, both figures were revised 0.1% lower to 0.1% each. Year-over-year core PCE was 3.4% versus expectations of 3.8%; however, the BEA revised its calculations, accounting for 0.2% to 0.3% of the 0.4% gap. As the graphic below shows, the Kalshi odds of a rate hike fell appreciably right after the data was released.
The economy got more good news as second-quarter GDP was revised from 1.5% to 2.2%, and ADP reported a gain of 90k jobs in August, more than double the rate ADP had been reporting in prior months. Overall, the data points to cooling inflation and an economy that remains resilient. All that said, the recent rate hike and months of rising bond yields will take time to affect the economy.

From TINA To TIGA, Diversification Pays Again
For more than a decade following the Financial Crisis, one acronym embodied the investment landscape: TINA, “there is no alternative.” The logic behind TINA was that the Fed and most other developed nations’ central banks held interest rates near zero and even below zero in some cases. As a result, Treasury, corporate, municipal, and international bond yields were extremely low for a decade. Thus, stocks, reasonably valued after the financial crisis, offered a clearer path to meaningful returns.
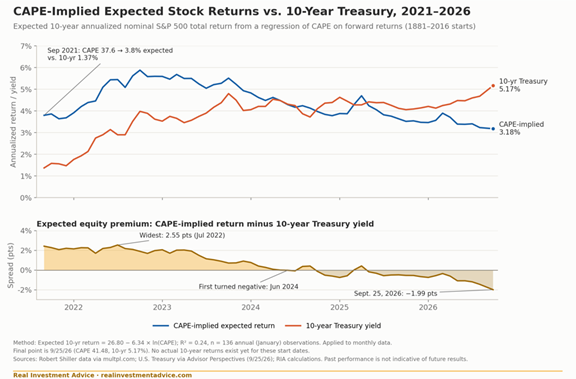
Today, TINA logic is less compelling. Risk-free 5-year and longer Treasury notes and bonds yield over 5%, and investment-grade corporate bonds yield even more. At the same time, stock valuations sit near record levels, implying weak forward returns. The acronym that best describes today’s market is TIGA, “there is a good alternative.”

Tweet of the Day
Trading Rules With Desktop Printout
“Want to achieve better long-term success in managing your portfolio? Here are our 15-trading rules for managing market risks.”
Please subscribe to the daily commentary to receive these updates every morning before the opening bell.
If you found this blog useful, please send it to someone else, share it on social media, or contact us to set up a meeting.