
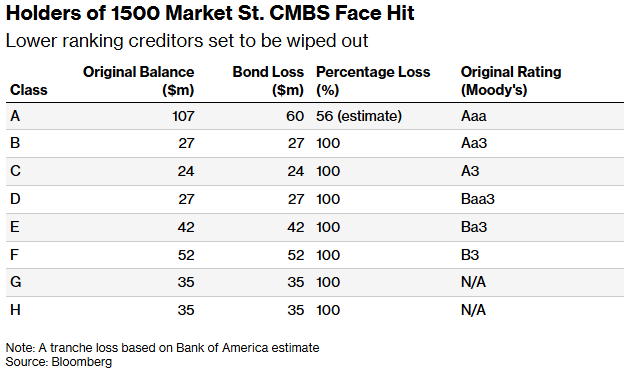
Pimco faces losses of more than $35 million on a commercial mortgage bond tied to Philadelphia’s Centre Square office towers, according to Bloomberg. The complex was appraised at $471 million in 2019. Last month, a judge approved its sale for $70 million. That 85% drop pushes CMBS losses to the very top of the capital stack. Strategists expect the once AAA-rated slice to recover roughly 44 cents on the dollar, while seven junior tranches lose everything.
The path from $471 million to $70 million is a familiar one. The towers were 93% leased when the loan went into a bond weeks before Covid. By the end of June, occupancy had fallen to 28%. The borrower couldn’t refinance when the loan matured in 2022, and the property went to foreclosure.
To be fair, one building does not define commercial real estate. Bloomberg notes that office leasing in New York and San Francisco has rebounded on AI-related demand. This deal was a single-asset, single-borrower bond, or SASB, backed by one mortgage on one property. There is no diversification to absorb a default. Still, CMBS losses at the senior level are getting less rare. This marks only the third AAA hit since the financial crisis. Bloomberg also counts more than 30 top-rated SASB slices trading below 85 cents on the dollar.
For investors, the lesson is about what a rating measures. A single-building deal with an AAA rating reflects structure, not diversification. As we show below, every tranche beneath the senior slice faces a total loss. Expect CMBS losses to keep climbing the capital stack as the refinancing wall arrives in a higher-for-longer rate environment.
What To Watch Today
Earnings

Economy
Market Trading Update
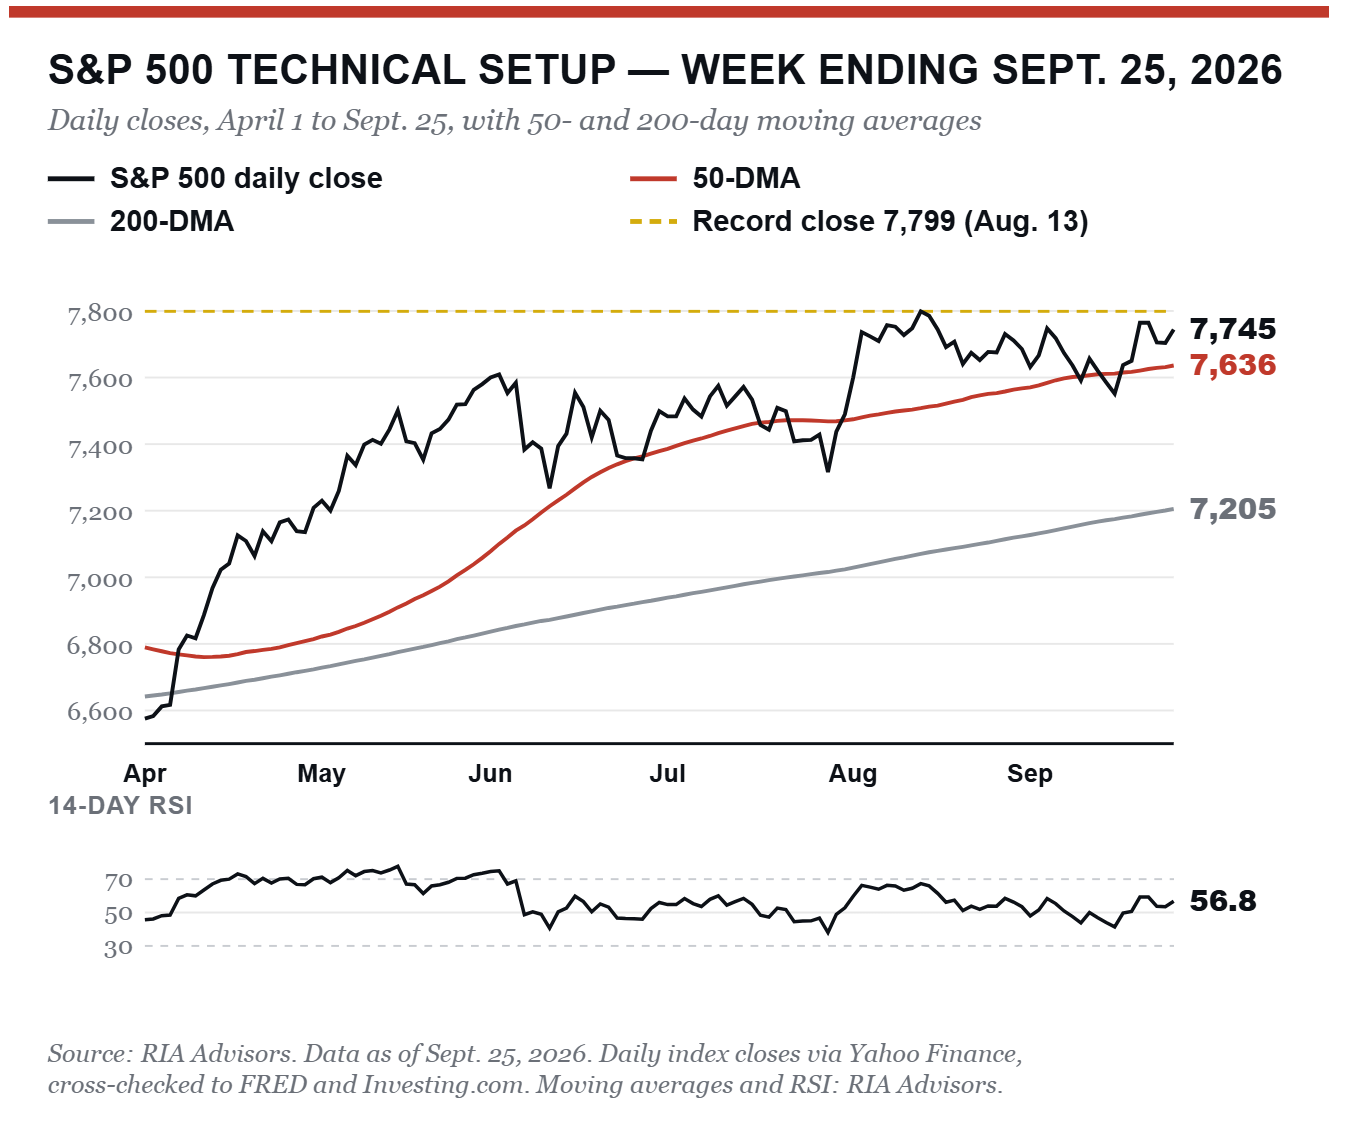
The S&P 500 closed last Friday at 7,744.64, up 1.2% for the week. It sits 1.4% above its 50-DMA at 7,636 and 7.5% above its 200-DMA at 7,205. The 20-DMA at 7,673 is rising just beneath the price. Since early August, the index has traded in a range between roughly 7,550 and 7,800 on a closing basis. Friday’s close put it back near the top of that range, less than 1% below the August 13 record. Holding near the highs while the 10-year pushed above 5.2% is constructive price action.
Last week, the market did most of its work on Monday. The index jumped 1.5% as AI names rallied and oil eased, gave back 0.75% on Wednesday as yields spiked, then added 0.5% on Friday. Buyers stepped in on each dip, and that matters. A market that refuses to break on bad news usually has more upside left.
Momentum improved meaningfully. The 14-day RSI climbed to 56.8 from 50.7 a week ago, neutral territory with plenty of room before overbought. The MACD crossed back above its signal line on Monday. It now reads +18.9 index points against a signal line of +10.8. That’s the first MACD buy signal since August 3, and it argues for a test of the record high. Resistance is well defined, though. The upper Bollinger Band sits near 7,791, almost exactly on top of the record close, so the 7,790 to 7,800 zone is where sellers are most likely to show up.
Here’s the problem. Price momentum improved while participation narrowed. The equal-weight index fell 1.1% this week as the cap-weighted index gained 1.2%. Small caps slipped 0.8%, and seven of 11 sectors finished lower. A rally led by one sector can run for a while. It’s fragile, though, because if technology stumbles there’s very little underneath to catch the index. The flip side is that the laggards are exactly where a broadening move would have to come from. Utilities and real estate were the most beaten-up groups on the week. They’re also the most sensitive to rates, so any pullback in yields would likely spark a sharp rotation into both.
The bond bears will say stocks can’t keep ignoring a 5.2% 10-year. They may be right eventually. The tape hasn’t agreed yet, and until it does, the trend deserves the benefit of the doubt.
For traders, the playbook is relatively straightforward. Don’t chase the index into the 7,790 to 7,800 zone. A closing break above 7,800 would open the 7,900 to 8,000 targets we laid out earlier this month. Pullbacks toward the 50-DMA near 7,640 are where we’d look to add exposure. On the other hand, a close below the September 16 low of 7,551.81 would break the range and put the 200-DMA near 7,205 in play. We continue to recommend rebalancing technology winners back to target weights into the current strength. Too much of this week’s gain came from a single sector.

The single level to watch this week is 7,800. A close above it confirms Monday’s MACD signal. A failure there, with such narrow breadth, keeps the index stuck in its range.

The Week Ahead
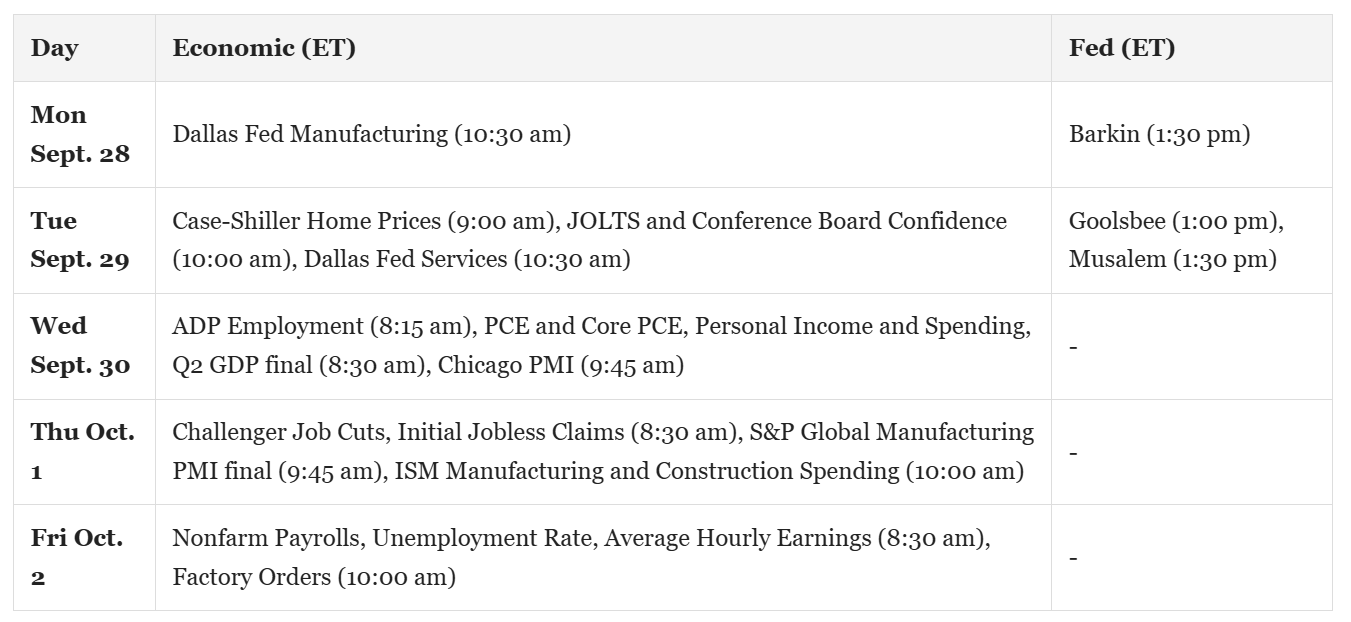
Two data points define this week. August PCE lands Wednesday morning, and the September employment report follows Friday. Both arrive before the October 27-28 FOMC meeting, and both carry more weight than usual. The Fed raised the funds rate a quarter point to 3.75%-4.00% on September 16, its first hike since 2023, on a unanimous vote. Futures now assign roughly 70% odds to another increase next month. The burden of proof has flipped. Data now has to argue against a hike rather than for one.
Core PCE held at 3.3% year over year in July and has not moved lower since spring. A repeat print keeps the October hike live. Friday’s payroll report matters just as much. August delivered 162,000 jobs against a 55,000 consensus, with unemployment steady at 4.1% and wages up 3.1% from a year ago. A second strong month removes the labor market as an argument for patience. Watch ADP on Wednesday and jobless claims Thursday for the setup.
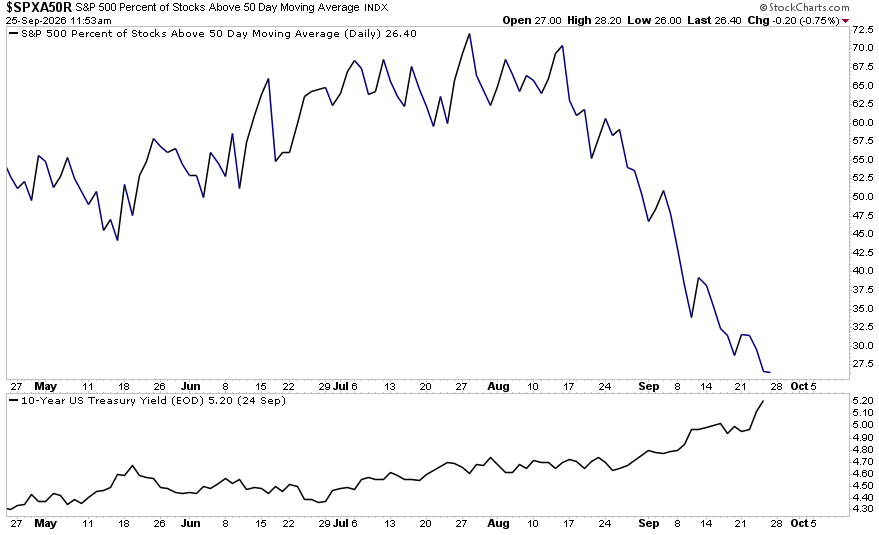
The bond market is the transmission mechanism, and it is already stressed. The 10-year touched 5.20% last week, a 19-year high, while the 30-year reached levels last seen in 2004. Breadth has thinned alongside it. Just 26% of S&P 500 members trade above their 50-day moving average, as we show below. Wednesday also closes the third quarter, so rebalancing flows will add noise. Earnings run thin. Micron reports Wednesday, Nike and Accenture Thursday, with Carnival and CarMax opening the week Tuesday. Nike’s guidance is the line worth reading for a view on the consumer.
Consumer Credit Stress: What The Data Really Shows
Dismissing the meme doesn’t mean the consumer is fine. Parts of the consumer are cracking. The stress is REAL. It just isn’t spread evenly across the system, and the aggregate delinquency chart hides that. Dig below the surface, and you find a household sector splitting in two, with the top half spending comfortably and the bottom half running on fumes.
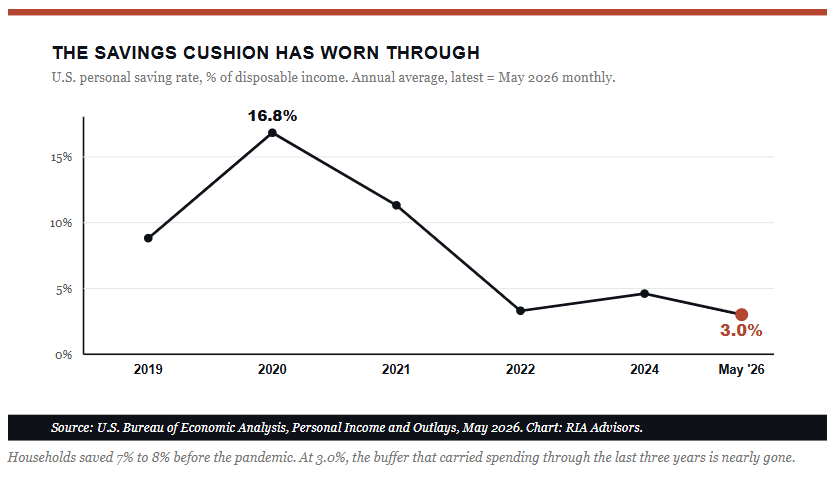
The savings data gives us the clearest read into what is actually happening. In July, the personal saving rate fell to 3.0% of disposable income, with total personal saving of $712.0 billion, according to the Bureau of Economic Analysis. Put that in context. For most of the decade before the pandemic, households saved 7% to 8% of income. The rate spiked above 16% in 2020 when stimulus landed, and there was nowhere to spend it. It has bled lower ever since. A 3.0% print is near the lowest reading in 20 years.

Tweet of the Day
New UPDATED Trading Rules With Desktop Printout
“Want to achieve better long-term success in managing your portfolio? Here are our 15-trading rules for managing market risks.”
Please subscribe to the daily commentary to receive these updates every morning before the opening bell.
If you found this blog useful, please send it to someone else, share it on social media, or contact us to set up a meeting.