
The headlines have never sounded scarier, and the market keeps setting records, which is exactly why investor optimism wins over a full cycle, and why your own behavior is the real risk.
Hope is not an investment strategy. Every advisor has said some version of that line, and it holds up. You cannot pray for a higher portfolio. Ben Carlson made the sharper point in a previous piece that while “hope is not a strategy, investor optimism absolutely is.1″ I will take it a step further. Understanding why investor optimism wins over a full market cycle is one of the most underrated edges an investor can own, and it has almost nothing to do with waving pom-poms.
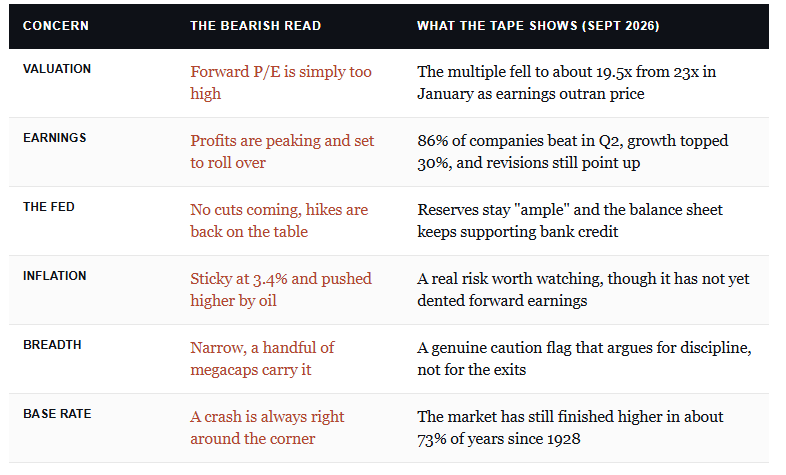
Look at the “wall of worry” investors have climbed in 2026. Inflation is sticky, with the headline rate back at 3.4% in August. The Federal Reserve is on hold and may raise rates rather than cut them. The ten-year Treasury yield sits near 4.8%. A summer scare over artificial intelligence dragged the Nasdaq to the edge of a correction.
Pick your headline of concern, and yet, the S&P 500 has closed at a record 27 times this year and trades up roughly 13% for 2026.2 So either the market is dangerously naive, or the permabears keep missing something structural. Having watched cycles since the late 1980s, I can tell you it is almost always the latter.
Markets Price Known Risks Faster Than You Can React
The most important thing to remember is that the markets are discounting machines. They do not trade on what is happening now. They trade on what is expected to happen next, measured against what is already priced in. Make no mistake, this is the piece most investors get backward.
By the time a risk is on every front page and trending in your feed, it has stopped being news. It became a consensus. And consensus is already “priced in.”
- The debt and the deficit? Investors have read those same headlines for the better part of 15 years.
- Market concentration? Discussed to death on every earnings call.
- When the summer AI panic hit, entire sectors sold off in days, then buyers returned, and the index pushed to new records.
Such is the nature of a market that reprices risk faster than any individual can click “sell.” As Bob Farrell always reminds us, when all the experts and forecasts agree, something else tends to happen.
This is also why trading the headlines is often a fool’s errand. Investors often think they have found an “edge” in some scary article, but it vanishes almost as soon as it was published. The crowd’s certainty is the contrarian’s opening, and the market knew it long before you finished reading.
Stocks Follow Earnings, And The Multiple Just Proved It
Here is the second pillar, which determines where prices go next. Over any horizon that matters, stocks follow earnings, specifically the market’s best estimate of profits over the coming year. Until something dents that outlook, the path of least resistance is higher.
Okay, so what is the outlook for earnings today? Booming. The second-quarter 2026 reporting season was one of the strongest in years, with 86% of S&P 500 companies beating estimates and profit growth north of 30%.3 Analysts, naturally, respond by increasing the bar, not lowering it.
Here is the part that the valuation bears cannot square. As the index kept setting records this year, the forward price-to-earnings multiple actually FELL, from about 23 times in January to under 20 times now.3 The multiple did not expand. Earnings did the heavy lifting, and they outran the share prices chasing them.
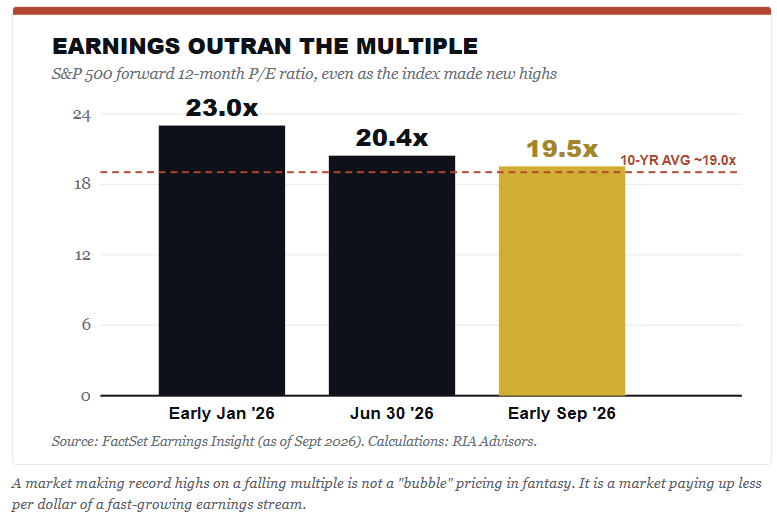
Take a moment and re-read that bolded point again, because it reframes the whole valuation debate by the bears. A record-high index trading on a shrinking multiple is the opposite of 1999. The engine driving the market here is profits, not a multiple expansion built on hope. That does not make stocks cheap. It does mean the “this time is different” bubble label gets harder to pin on this tape.
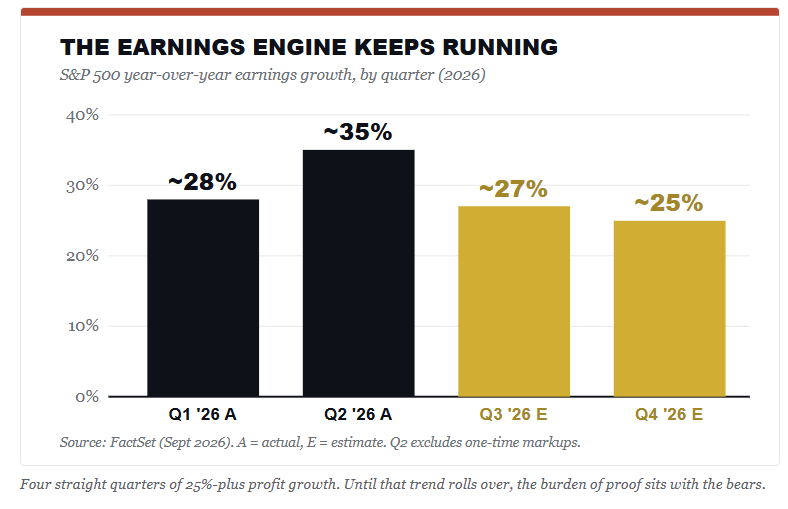
Naturally, this analysis cuts both ways, which is critical to remember. In the future, the day will come when forward estimates roll over in earnest. “When” that happens is the day that investor optimism turns dangerous. That is the signal I watch far more closely than any geopolitical headline. Right now, the revision trend still points upward, so we stay constructive and stay awake.
Liquidity Is King, Even With The Fed On Hold
The third pillar gets the least attention and may matter the most. Liquidity is king. The markets are a function of money hunting for a home, and there is still plenty of it in the system.
Here is the twist that most mainstream commentary misses in 2026. The Fed is not cutting rates but has held the funds rate at 3.50%-3.75% for most of this year and, in September, increased rates for the first time in three years.4
Yet at the same July meeting, the FOMC reaffirmed its policy of keeping bank reserves “ample,” and it continues to add Treasury bills to the balance sheet to do it.5 Those two facts sit in different buckets. The price of money can increase while the quantity of reserves continues to grow. When the Fed adds reserves, it expands the banking system’s capacity to lend, and that credit feeds the real economy regardless of where the funds rate sits.
You can watch it happen in the plumbing. The Fed’s overnight reverse repo facility, the place cash parks when it has nowhere better to sit, has drained from roughly $2.5 trillion at the end of 2022 to a rounding error today. That money did not vanish; rather, it rotated back into bank reserves, money-market funds, and the hunt for yield, and a good share of that hunt ends up in equities.
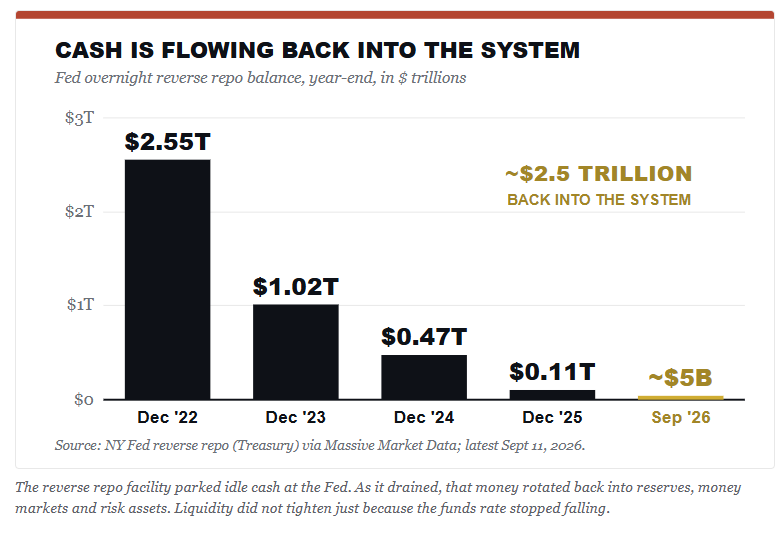
You are free to call it whatever you want, but money is the oxygen of a bull market. So long as reserves stay abundant and banks keep lending against them, the tape carries a tailwind, even with a central bank refusing to ease. This is why the “valuations are too high, so stocks must fall” argument has failed for years running. Valuation is a terrible timing tool. Liquidity is the variable that actually moves cash into equities, and it is flowing.

The Math Behind Why Investor Optimism Wins
The previous three points cover the overall plumbing behind that market, but there is one piece that ties them together, because it should change how you weigh risk itself. Permanent pessimism is exhausting and carries a negative expected return.
The reason is the market’s upward drift. Since 1928, the S&P 500 and its predecessors have finished the year higher in roughly 73% of all years, 65 up against 24 down.6 Sit with that number for a moment and seriously consider it if you are betting on the next major market correction.
To be structurally bearish is to bet, year after year, against an outcome that shows up three times in four. And the odds compound against the bear from there, because up years have delivered far larger average gains than down years have inflicted losses, and the year after an up year has finished higher about 75% of the time.7 The drift is real, it is powerful, and it grinds against anyone positioned for permanent catastrophe.
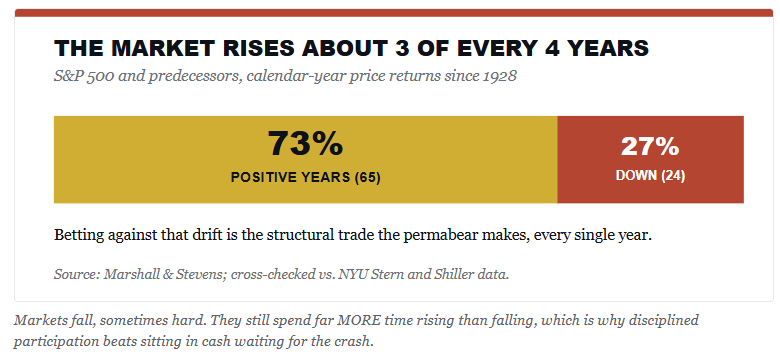
Do not mistake what we are discussing. We are not saying that “risk is a myth.” Risk is very real. But it says that the burden of proof sits with the bears. For those who maintain a steady state of investor optimism, the default positioning lines up with a century of data. The pessimist has to be right about the timing of a rare event, then right again about when to climb back in. That asymmetry is the arithmetic behind investor optimism’s win. The pessimist has to make two hard calls where the optimist makes none.
“Investor pessimism always sounds smarter. Investor optimism pays. Betting against human ingenuity has been a losing trade for a hundred years, and I don’t expect this year to be the exception.”
Where The Bears Are Right
Make no mistake, I am not suggesting the bears are NEVER right; they are, and the other side of this debate has real merit. Here is the rundown:
- Start with concentration. A handful of megacaps drive an outsized share of the gains, and
- Breadth has been narrow enough that Goldman’s own strategists flagged it as a caution signal.8
- The AI capital-spending boom could still prove a bubble, and the summer air pocket that nearly pushed the Nasdaq into a correction was a preview of how fast that trade can wobble.
- Inflation at 3.4% is not beaten
- A ten-year yield near 4.8% raises the bar every risk asset has to clear, and
- 38% of companies have guided the street lower for the year.3
Any one of these could be the thing that finally cracks forward earnings.
This all brings up the obvious question: “How do you square both sides at once?”
That concern is also spread throughout the more bearish media commentary. Valuations are elevated, the Fed might hike, breadth is thin, and you still expect investors to be optimistic? Yes, with one word attached. Discipline.
Being structurally optimistic has nothing to do with closing your eyes to risk. It means participating in the drift while managing the downside with rules instead of emotions. Have investor optimism regarding the direction, but be ruthless about risk. Those two live together comfortably. None of it changes the fact that optimism wins over a full cycle. It only changes how you express it.
The behavioral work I keep coming back to says it best with a rule I love.
“Be either a Bull or a Bear, but never be Hog. Bulls and Bears make money, but Hogs get slaughtered.”
Investor optimism keeps you in the game long enough for the drift to pay you. Discipline keeps you from getting carried out on a stretcher in one in four cases that bite.

The Real Enemy Is In The Mirror
Now we reach the part that actually decides your returns, and it is not the Fed or the earnings cycle. It is you. I have written before that the most dangerous element to your success as an investor is yourself, and the behavioral traits that sabotage investors are the single biggest reason people trail the very markets they own. I laid these out in detail in Behavioral Traits That Are Killing Your Portfolio Returns, and they map almost cleanly onto why pessimism feels so seductive.
Start with “confirmation bias.” We hunt for information that confirms what we already believe. If you are scared, every doom headline reads as proof, and you filter out the earnings beats and the liquidity data pointing the other way. A “permabear” does not analyze the market; he only collects evidence for a verdict he reached long ago. In simpler terms:
“Permabears are the smoke detectors that go off every time somebody makes toast. They are technically alert but useless for telling you the house is actually on fire.”
Then comes “herd bias.” When everyone around you is bearish, staying invested feels reckless and lonely, even when the data backs you. Howard Marks has made the point for years that being a contrarian hurts precisely because momentum makes the crowd look right for a while. Most people cannot sit with that discomfort, so they sell into fear and buy into euphoria. The exact reverse of what works.
“Probability neglect” closes the trap. We fixate on what is possible, a crash, a collapse, a once-in-a-generation shock, and ignore what is probable, which is that the market grinds higher in most years. A vivid, frightening possibility crowds out a boring, favorable probability. Such is how a 27% event ends up running a portfolio built for a 73% world. Knowledge is not the constraint here. Emotional discipline is.
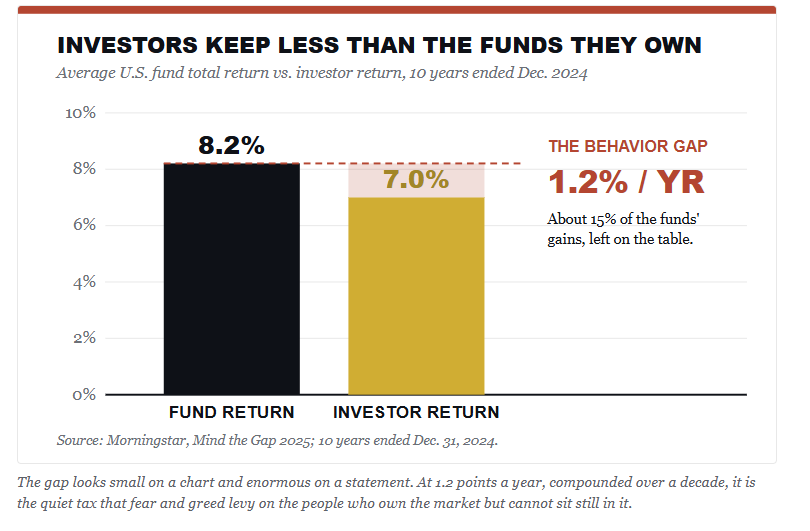
Put a number on it. Over the decade through 2024, the average dollar in US funds earned about 7% a year while the funds themselves returned 8.2%, a gap of roughly 1.2 points annually.9 That shortfall is the price of jumping in and out at the wrong moments, and it compounds into about 15% of the gains an investor could have kept. Researchers argue over how much of the gap is pure bad timing versus other factors, and that debate is fair. What nobody disputes is that the gap is real, it is persistent, and the slice driven by fear and greed is the slice you actually control.
What This Means For Your Portfolio
So what do you do with all of this? You build a process that lets optimism work without letting your emotions take the wheel. A few rules from that behavioral playbook carry most of the weight.
- Do more of what is working and less of what is not,
- Respect the trend until it clearly breaks.
- Expect corrections rather than fear them, because they are the toll you pay for the drift that rewards you three years in four.
- Control risk with sell levels set in advance, not with panic after the fact, and
- Turn off the television, because the headlines are engineered to trigger the very biases that cost you money.
I put a fuller version of this framework in 15 Investing Rules To Win The Long-Game, which pairs well with everything above.
The bottom line is this. Investor optimism is neither naivety nor a personality type. It is a probability-weighted reading of how markets actually behave. They discount risk quickly, follow earnings, run on liquidity, and drift higher far more often than not. That is the whole case for why optimism wins. The investor who internalizes it, then gets out of his own way, is built to capture the drift.
Sources & Notes
- Ben Carlson, “Optimism is an Investment Strategy,” A Wealth of Common Sense, Feb. 24, 2026.
- Record-high count and year-to-date return per Yahoo Finance / Motley Fool and CNN Business market coverage, Aug.-Sept. 2026. S&P 500 level anchored to the SPDR S&P 500 ETF (SPY) close of $764.29 on Sept. 11, 2026, and the Nasdaq-100 ETF (QQQ) close of $714.88, both pulled from Massive Market Data in session..
- FactSet Earnings Insight, Q2 2026 season updates and forward P/E, Aug.-Sept. 2026. Q2 growth of roughly 35% is shown, excluding one-time non-operating markups at Alphabet and Amazon, which lifted the headline figure higher. Forward P/E of about 19.5 compares with 20.4 on June 30 and roughly 23 in early January. Negative full-year guidance share of 38% per the same source.
- Federal Reserve, FOMC statement and minutes, July 28-29, 2026 (funds rate held at 3.50%-3.75%). Fed Funds futures pricing per StreetStats as of Sept. 10, 2026. August headline CPI of 3.4% per Trading Economics market data.
- The Federal Reserve Bank of New York and the July 2026 FOMC minutes reaffirm the policy of maintaining ample reserves through Treasury-bill purchases. Ten- and thirty-year Treasury yields (4.83% and 5.28%, Sept. 9, 2026) pulled in session from Massive Market Data.
- Marshall & Stevens historical S&P 500 study (65 positive years, 24 negative, since 1928, roughly 73%). Load-bearing statistic. Cross-checked against NYU Stern (Damodaran) and Robert Shiller annual return datasets, which agree on a positive-year frequency near 73% since 1928. The figure is sample-dependent and shifts a few points on different start dates, so the 1928 base is stated explicitly.
- Marshall & Stevens: following an up year, the index has finished positive in about 75% of cases (48 of 64) in the post-1928 sample.
- Goldman Sachs equity strategy research, 2026, noting narrow breadth and momentum as cautionary signals alongside a constructive earnings outlook.
- Morningstar, “Mind the Gap 2025”: the average dollar in U.S. funds earned 7.0% annually versus an 8.2% fund total return over the 10 years ended Dec. 31, 2024, a gap of 1.2 percentage points (about 15% of the gains). Corroborated by CNBC, Oct. 2025. Magnitude and cause are debated: a 2026 Financial Analysts Journal study (Fulkerson et al.) attributes only about 0.10% per year to pure timing, and Morningstar notes the gap reflects several factors, not behavior alone. DALBAR’s QAIB reports a larger gap on a different methodology; the more conservative Morningstar figure is used here.
Investor optimism was written on Sept. 12, 2026. This material is for informational and educational purposes only and is not investment advice or a recommendation to buy or sell any security. Past performance is no guarantee of future results. All market data is as of the dates noted and may have changed.