Higher Yields Flipped The Math In The Investors’ Favor
By RIA Team •September 30, 2026•6 min read
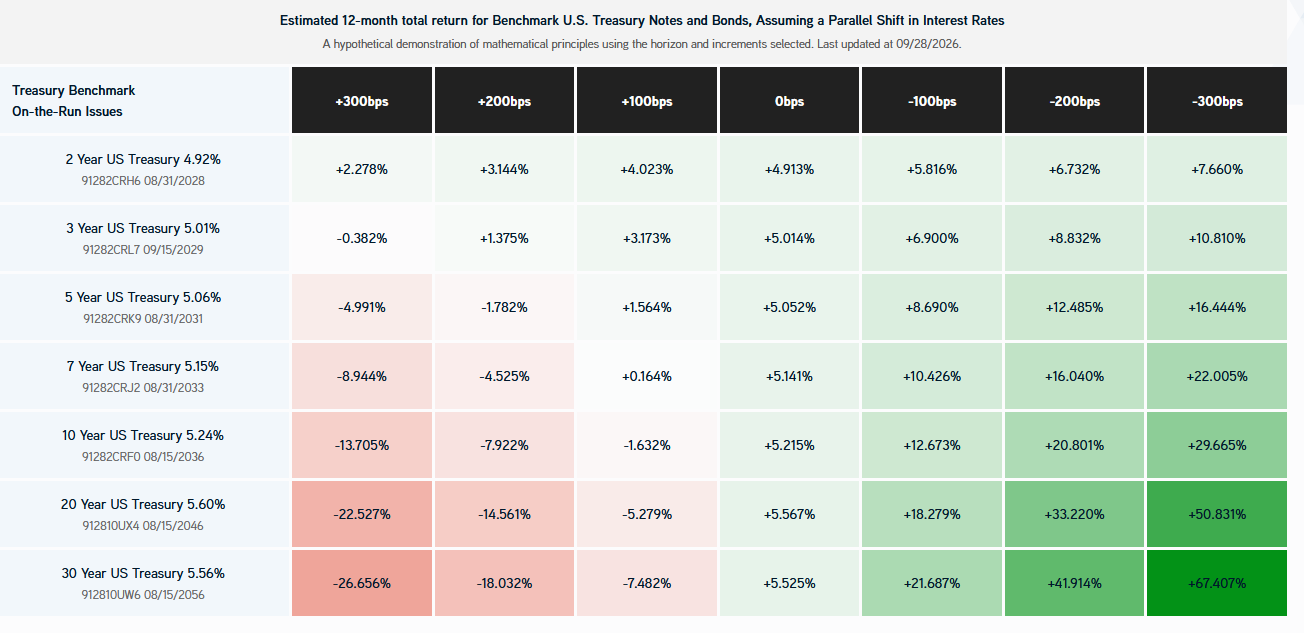
Will 5.00% be the approximate ceiling for Treasury yields? Maybe, maybe not, but for bond investors, the risk-reward math is becoming very enticing even if yields rise further. Today’s yields provide a loss cushion that did not exist three years ago, and a return asymmetry heavily in investors’ favor. To appreciate this concept, consider that a bond’s return over a specified period comes from the coupon earned and the change in the bond’s price. The price change equals the bond’s duration times the change in yield. The graphic below, courtesy of F/m Invest, shows that at today’s yields, the skew of potential one-year returns for one-, two-, and three-percent up- and down-changes in yields favors a positive outcome in many instances.
Three things stand out from the table:
The two-year note holder is well insured against losses, even if rates climb by more than three percent.
The five-year note still has a positive return unless yields rise to over 6.50%.
The ten-year offers a +12.67% return against a 1.63% loss for a one percent yield change up or down, respectively.
To better appreciate the math, consider that a 1.00% increase in the 5-year yield results in a -3.50% price change; however, the 5.00% coupon absorbs that price change and then some, leaving a total return of approximately +1.50 %. The same 1.00% move lower in yields returns 8.69%. If you think that yields are close to peaking, the skew on five- and ten-year notes offers an attractive risk-return profile. For those who are more pessimistic on bond yields, the two- and three-year notes are heavily tilted toward positive returns even if yields rise by nearly 3%.
What To Watch Today
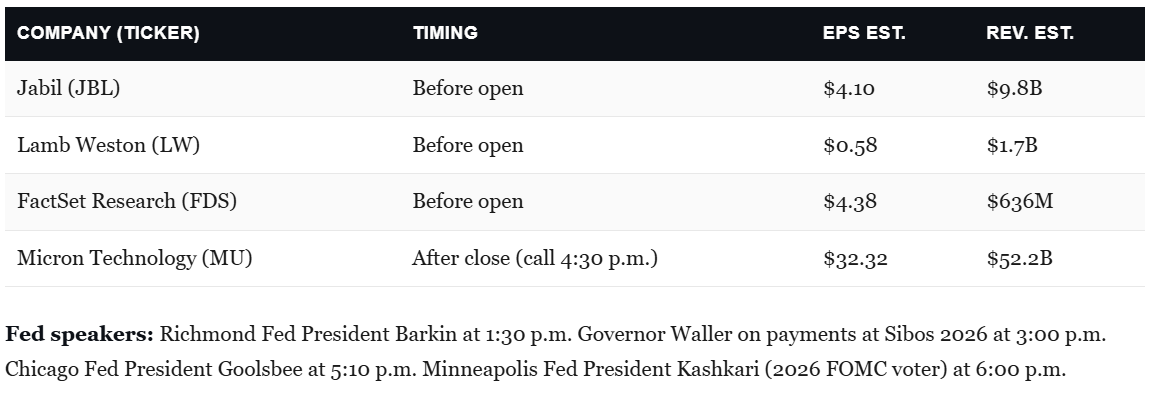
Earnings
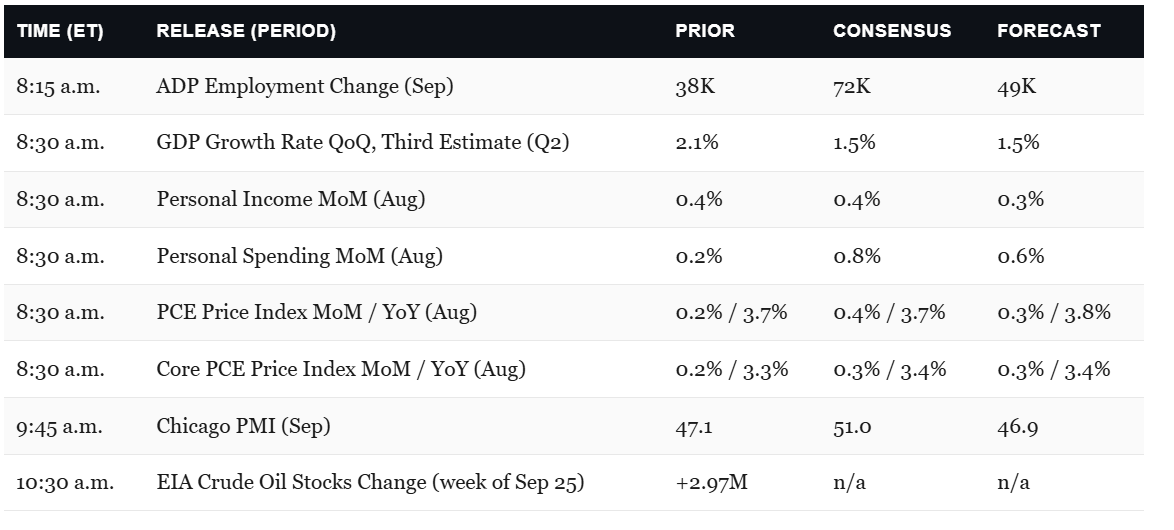
Economy
Market Trading Update
Yesterday, we discussed the MACD buy signal on the S&P 500 and why investors are hoarding cash heading into October in McDonald’s At Four-Year Lows Isn’t As Worrisome As Some Fear. Today, I want to focus on the dollar rally and gold prices. That relationship has done real damage to precious metals holders this month.
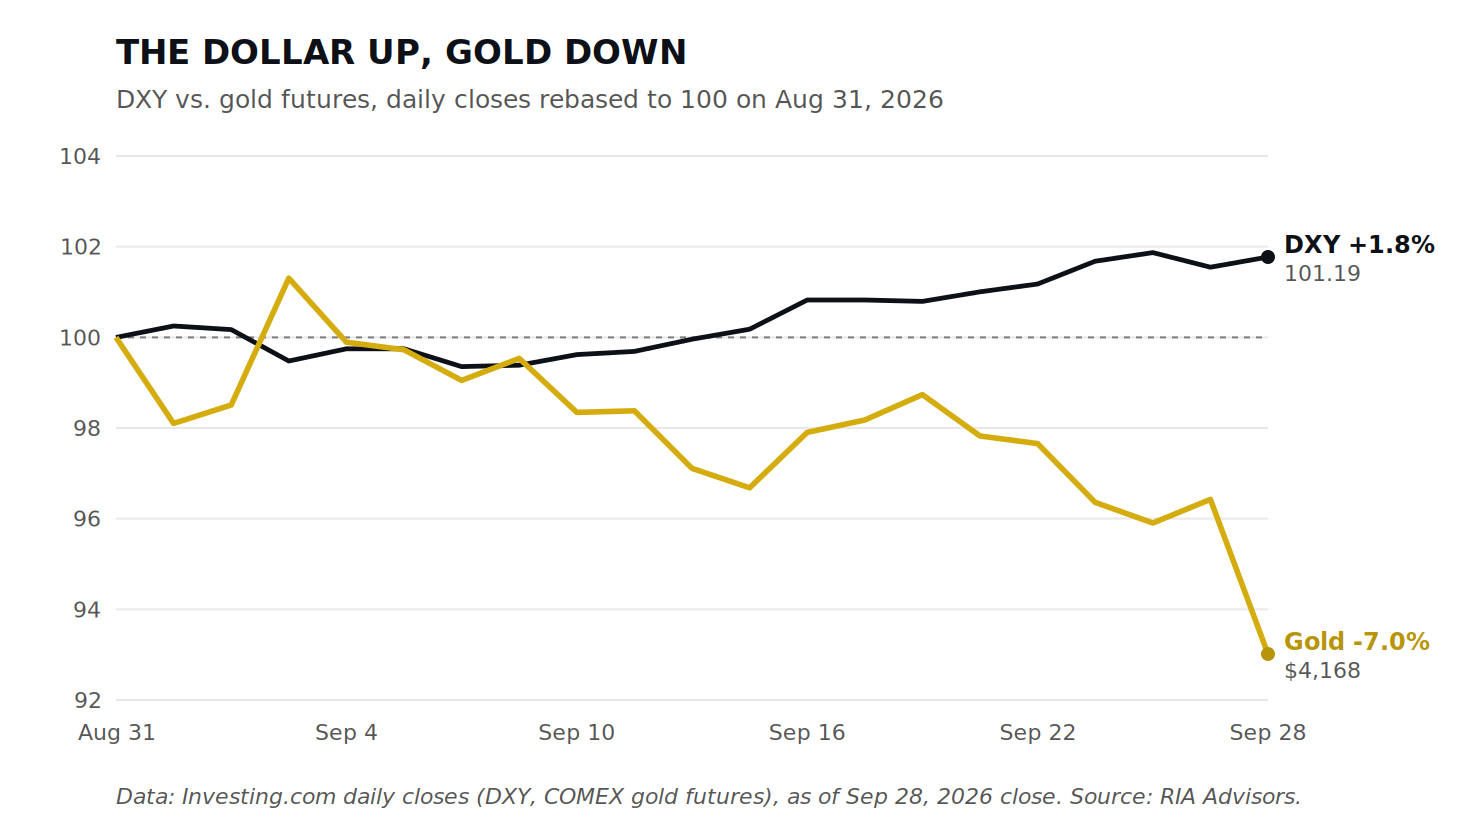
The move has been quiet but persistent. The dollar index (DXY) closed Monday at 101.19, up about 1.8% from 99.43 at the end of August and sitting near two-month highs. Over the same stretch, gold futures slid from $4,481 to $4,168. That’s a 7% decline, and half of it came on Monday alone. Notice in the chart below how cleanly the two lines have mirrored each other all month.
The driver isn’t a mystery. The 10-year Treasury yield pushed above 5.2% on Monday, its highest level since mid-2007. Markets now price roughly a 70% chance the Fed hikes in October. Gold pays no coupon. When Treasuries yield north of 5%, the “opportunity cost” of owning bullion rises, and a firmer dollar raises the price for every non-US buyer simultaneously.
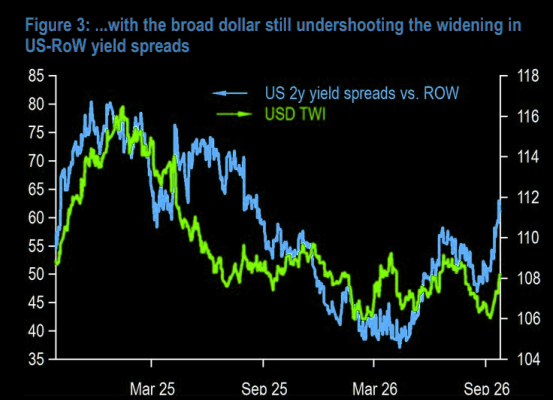
So, does the dollar have more room to run? JPMorgan thinks so. Their work shows that the US two-year yield spreads versus the rest of the world have widened sharply. Yet the broad dollar remains roughly 2% too weak relative to those spreads. The currency market is still catching up to the bond market.
Apply that 2% gap to the DXY, and the arithmetic points toward the 103 area. That’s my math, not a JPMorgan target. The counterweight is growth. JPMorgan ranks Europe and the UK at the top of its global growth screen, with the US in the bottom half, which explains why the currency has lagged. If the upcoming jobs data confirms US strength, I expect that gap could close.
For gold, that’s a headwind. Spot gold near $4,150 sits roughly 26% below its January record of $5,608. As we discussed previously, the parabolic spike in Gold prices heading into January was due for a correction, and the unwind is playing out as expected.
A skeptical reader will object that central bank buying and runaway deficits haven’t gone anywhere. That’s true. But the long-term thesis does NOT protect you from a short-term repricing when the dollar and yields move against you.
If you own gold, just realize the tape is working against you at the moment. Hold the metal as a hedge, not as a momentum trade, and tighten stops on the miners, which fall faster than the metal. Wait for the dollar to stall near 103, or for Fed pricing to peak, before adding again. Such is the nature of a crowded trade. The exit is always narrower than the entrance.
Consumer Confidence Slips
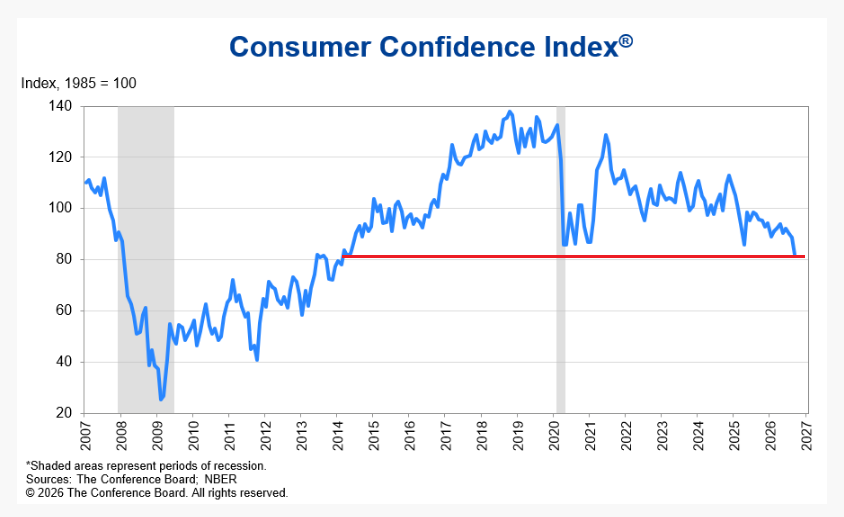
We have been leery of reading too much into the record lows in the University of Michigan Consumer Confidence data, as it has a significant political bias. However, yesterday’s Conference Board Consumer Confidence survey points to a continuing pessimistic trend. The consumer survey fell to its lowest level since 2014, as consumers increasingly worry about the economy and the labor market. While the report points to general inflationary concerns and, in particular, rising energy prices, consumer spending has remained resilient and the labor market stable. Bloomberg shares the following regarding the labor market:
The Conference Board survey showed the share of consumers who said jobs were plentiful fell to the lowest level since 2021, while the share saying jobs were hard to get rose. The difference between the two — a metric closely followed by economists — narrowed to the smallest in more than 5 1/2 years.
JOLTs
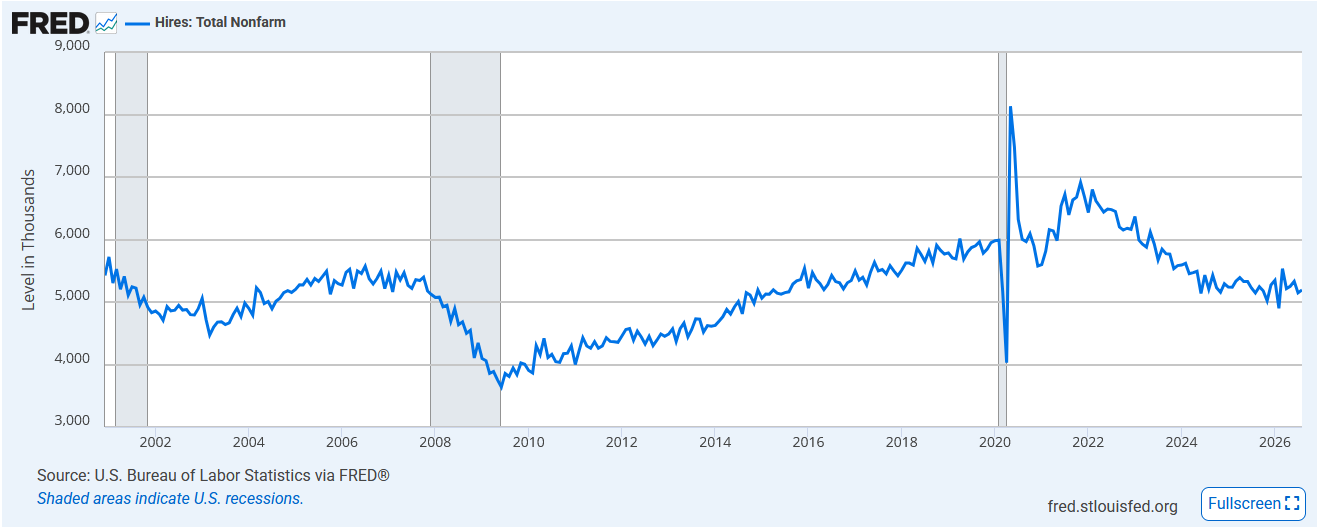
This morning’s JOLTS report for August showed a stagnant labor market. Job openings were little changed at 7.1 million, hires little changed at 5.2 million, and total separations unchanged at 5.1 million. That stability is generally good but presents more fragility than it appears.
Every component has stayed in a narrow band this year. Openings have hovered near 7.1 to 7.6 million, hiring between 3.2% and 3.4%, layoffs at 1.0%, and quits at 1.9%. A quits rate that low suggests workers don’t believe they can find better jobs. A low layoff rate says employers are not cutting. Neither is a sign of strength nor weakness.
Friday’s September employment report will be interesting if it shows strong job growth like last month. August payrolls rose 162,000, well above expectations, but JOLTS suggests that gain came from employee retention rather than expansion. A strong headline print alongside the weak hiring rate sitting at cycle lows would tell us the labor market is not necessarily growing as some might assume.