
A reader recently asked us: “Why are BDCs diverging from corporate junk bonds?” To his point, the graph below shows the ICE BOA index of BB and B yield spreads to Treasuries are at or near 30-year lows. At the same time, BDCs, which hold lower-rated credit loans to small and mid-sized companies, are trading in many cases at near-historical discounts to their NAVs. The answer is that “junk” is not a single market, and the ICE BOA indexes reflect a divide that partially helps explain the disconnect.
The top graph also shows that CCC junk bond spreads have diverged from their BB- and B-rated peers. The lower graph shows that this divergence is the largest in 30 years. BB spreads, the highest-quality junk, trade at 1.58%, just 22 basis points above their all-time low set in 1997 and in the 1st percentile of history. Single-B spreads, at 2.87%, sit in the 4th percentile. But CCC and lower spreads trade at 9.72%, the 52nd percentile, a full 558 basis points above their record low. Simply, investors have never paid this much for “quality” junk relative to distressed junk.
BDCs, publicly traded securities that hold private credit loans, trade at roughly 10-15% discounts to net asset value. The sector is generally down about 20-25% over the past year. Our reader notes the contradiction between BB- and B-rated bonds and BDCs. S&P’s credit estimates place most BDC borrowers at B- or lower, with a tail in CCC territory. Part two, in a lower section, examines the relationship and why it broke.

What To Watch Today
Earnings

Economy

Market Trading Update
Yesterday, we dug into IBM’s guidance miss and how quickly one mega-cap warning can sour the whole tape, as we covered here. Today I want to widen the lens to the group that has actually carried this rally, and the one with the most air underneath it: semiconductors.
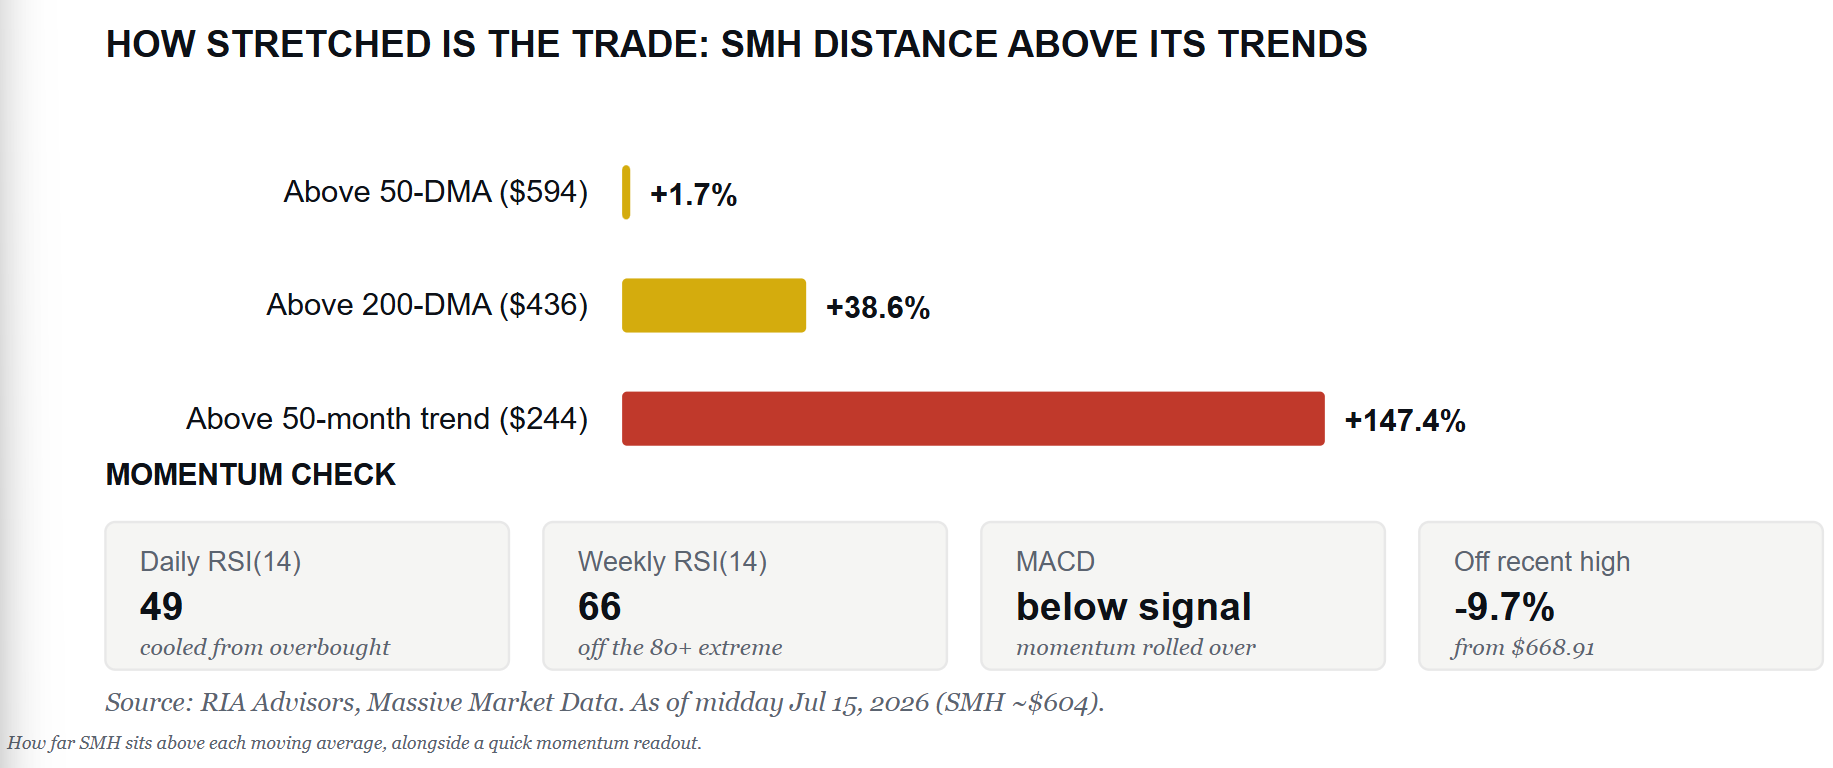
Start with the trend. At the time of this writing, the VanEck Semiconductor ETF (SMH) is trading near $604. That’s only about 1.7% above its 50-day moving average of $594. But it sits 38.6% above the rising 200-day near $436, and a remarkable 147% above its 50-month moving average of $244. That 50-month line has tracked the sector cleanly through every cycle since the fund’s inception. Price has rarely, if ever, been this far above it. Put it in trade terms. A garden-variety pullback to the 50-day is less than 2% away. A full reversion to the 200-day would be a 28% decline from here.

Here’s what matters. The move is already cooling. SMH is roughly 10% off its June closing high of $668.91. The 14-day RSI has slipped back into the high 40s from deeply overbought territory, the weekly RSI has eased into the mid-60s after printing above 80 at the peak, and the MACD has rolled below its signal line. Nvidia, the group’s bellwether, is trading near $211 has traded weakly, so leadership is narrowing rather than broadening. Momentum has cooled, not collapsed. The tape simply isn’t confirming new highs anymore.
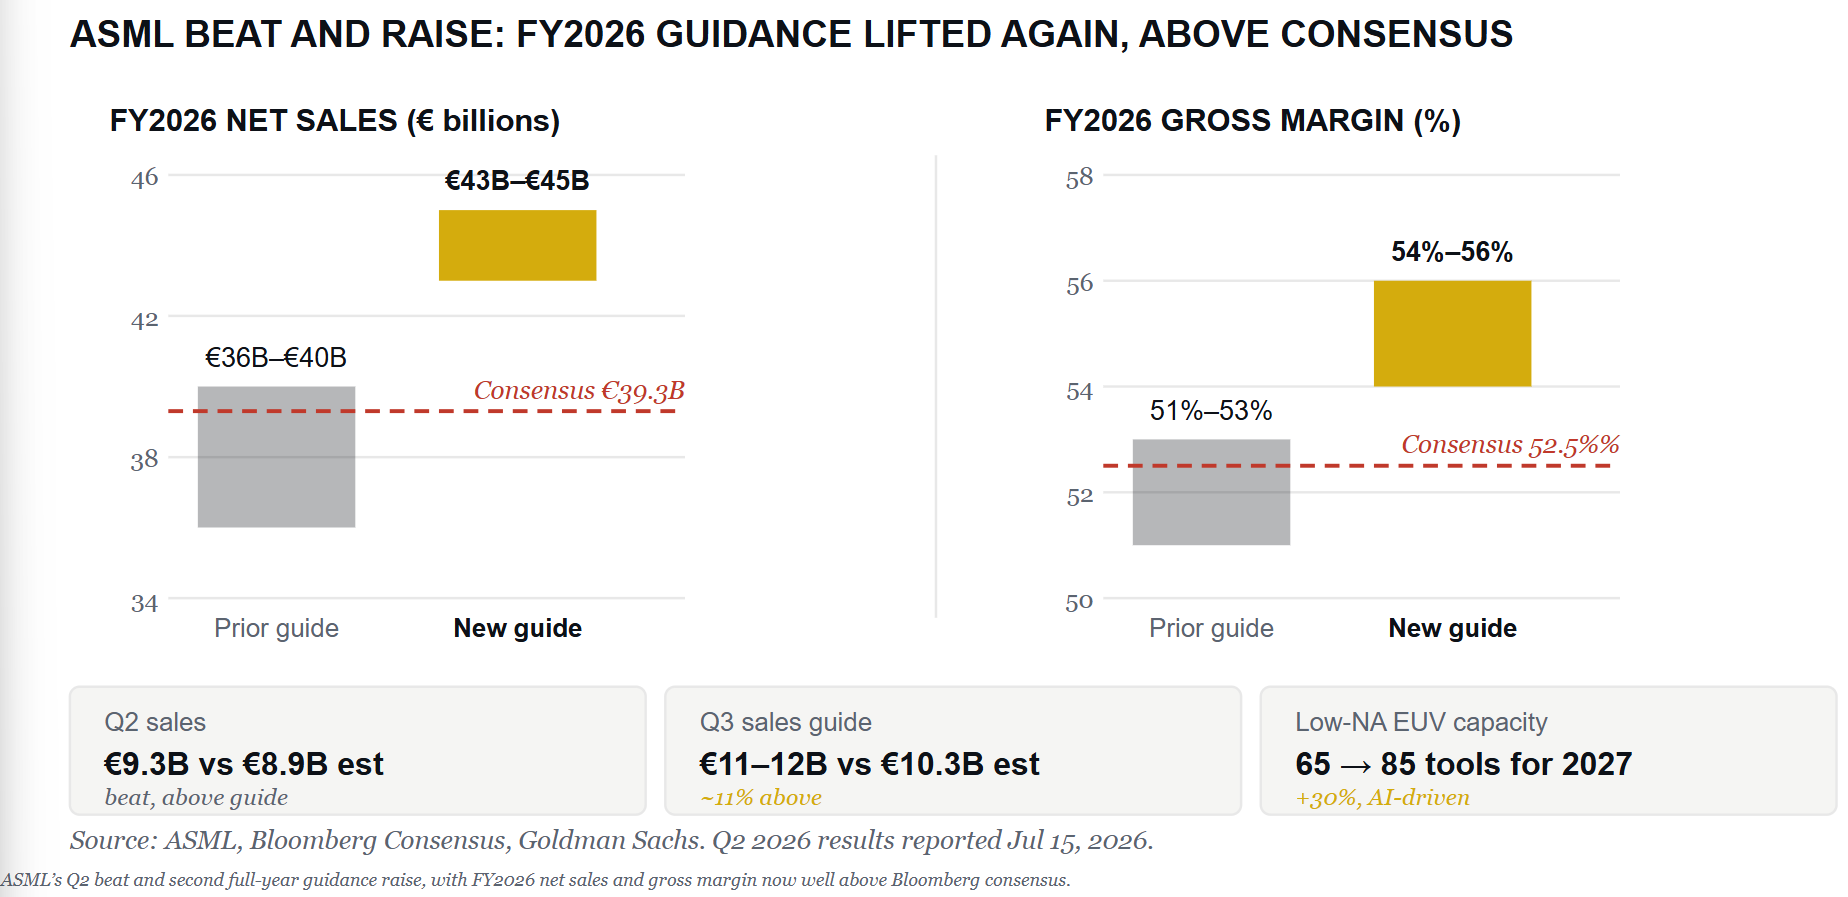
Parabolic moves run further than anyone expects, and then they don’t correct sideways; they correct hard. What breaks this trade isn’t the fundamentals, at least not yet. ASML made the bull case louder on Wednesday. It beat on the quarter and raised full-year revenue guidance to 43 to 45 billion euros, lifted its gross margin outlook toward 56%, and said it will expand low-NA EUV capacity by roughly 30% in 2027.
SK Hynix ADRs jumped 27% on Tuesday. Demand is clearly intact. That’s exactly the risk. When the news is this good and everyone already owns the trade, the price reflects it, and there’s little room left to surprise on the upside. TSMC reports before the bell this morning with a very high bar to clear, and, behind the scenes, the hyperscaler bond market is flashing signs of funding stress. Crowded positioning and valuation gravity do the rest.
This is NOT a call that the AI buildout is over. It’s risk management at a point where the asymmetry no longer favors holders. Trimming a parabolic winner isn’t a market call. The reward for riding the last leg of a move like this is small, and round-tripping the prior run is permanent damage. Keep semis at target weight, tighten the stops, and manage risk at the line, not after it breaks.

More On BDCs and High-Yield Bonds
In our lede, we showed the record bifurcation between higher- and lower-rated junk bonds. We believe that the divide partially explains why BDCs trade at steep NAV discounts despite tight credit spreads for some junk bonds.
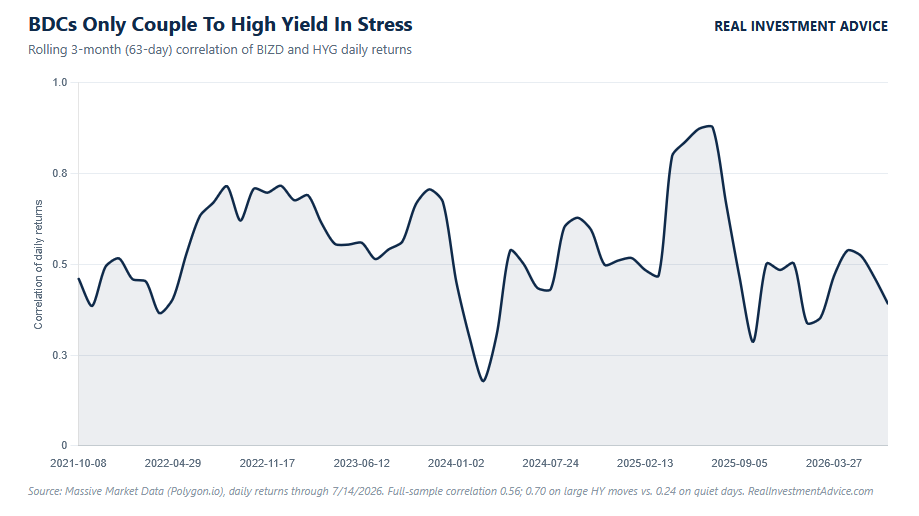
Over the last five years, BDCs (BIZD) and high-yield (HYG) show a correlation of 0.56, with no lead-lag relationship at any horizon. The correlation is somewhat regime-dependent. It’s 0.70 on large high-yield moves but just 0.24 on quiet days. Essentially, BDCs and junk are more correlated in volatile markets and less so in calmer ones.
There are four primary drivers to explain today’s divergence.
- S&P credit estimates rate most BDC borrowers at B- or lower, so BDCs tend to price off the CCC leg of the market.
- Tight spreads on the BDCs’ underlying loans are an earnings headwind for BDCs. It reduces net interest income, which pressures dividends.
- BDC NAV calculations are quarterly, so rising non-accruals and PIK income are prompting some investors to sell and front-run writedowns.
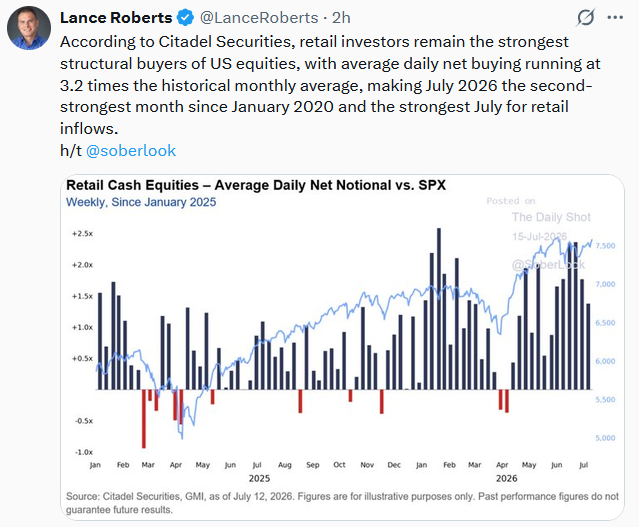
- Retail-driven BDC flows, irrational forecasts, and poor sentiment can dislocate spreads for periods.
Warning: if BB and B spreads finally widen from record tights, statistics say BDCs will recouple at high correlation on the way down. That said, BDCs have already priced in a much weaker credit market than higher-rated junk, so the convergence may not be as damaging as it would be if the divergence hadn’t existed.
Headwinds And Tailwinds: Minding The Market Weather
Market forecasting has more in common with hurricane forecasting than most investors appreciate. The goal when managing an investment portfolio is not to predict a single outcome but to understand the environment well enough to establish a range of possible outcomes.
When a hurricane is brewing, meteorologists don’t draw a single storm track forecast on the map; they draw a “cone of uncertainty” that contains dozens of possible paths. Over time, as more information is gathered, the cone tightens.
Some storms cause immense damage, while others prove much weaker than expected. Other once-threatening storms never reach land and peter away in the ocean. Which path materializes depends on many variables layered on top of each other. Like markets, it’s a dynamic process that is impossible to predict with certainty.
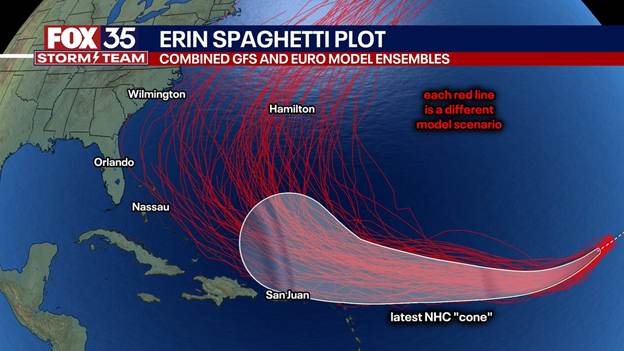
Investors face the same task as meteorologists. We must gauge the many forces acting on markets simultaneously and consider a slew of others that may or may not pressure markets in the future. Doing so efficiently provides us with a range of outcomes rather than relying on a single forecast.
With many headwinds arising, the job for investors right now is to closely track the environment and be ready to trim their sails if needed.

Tweet of the Day
New UPDATED Trading Rules With Desktop Printout
“Want to achieve better long-term success in managing your portfolio? Here are our 15-trading rules for managing market risks.”
Please subscribe to the daily commentary to receive these updates every morning before the opening bell.
If you found this blog useful, please send it to someone else, share it on social media, or contact us to set up a meeting.