
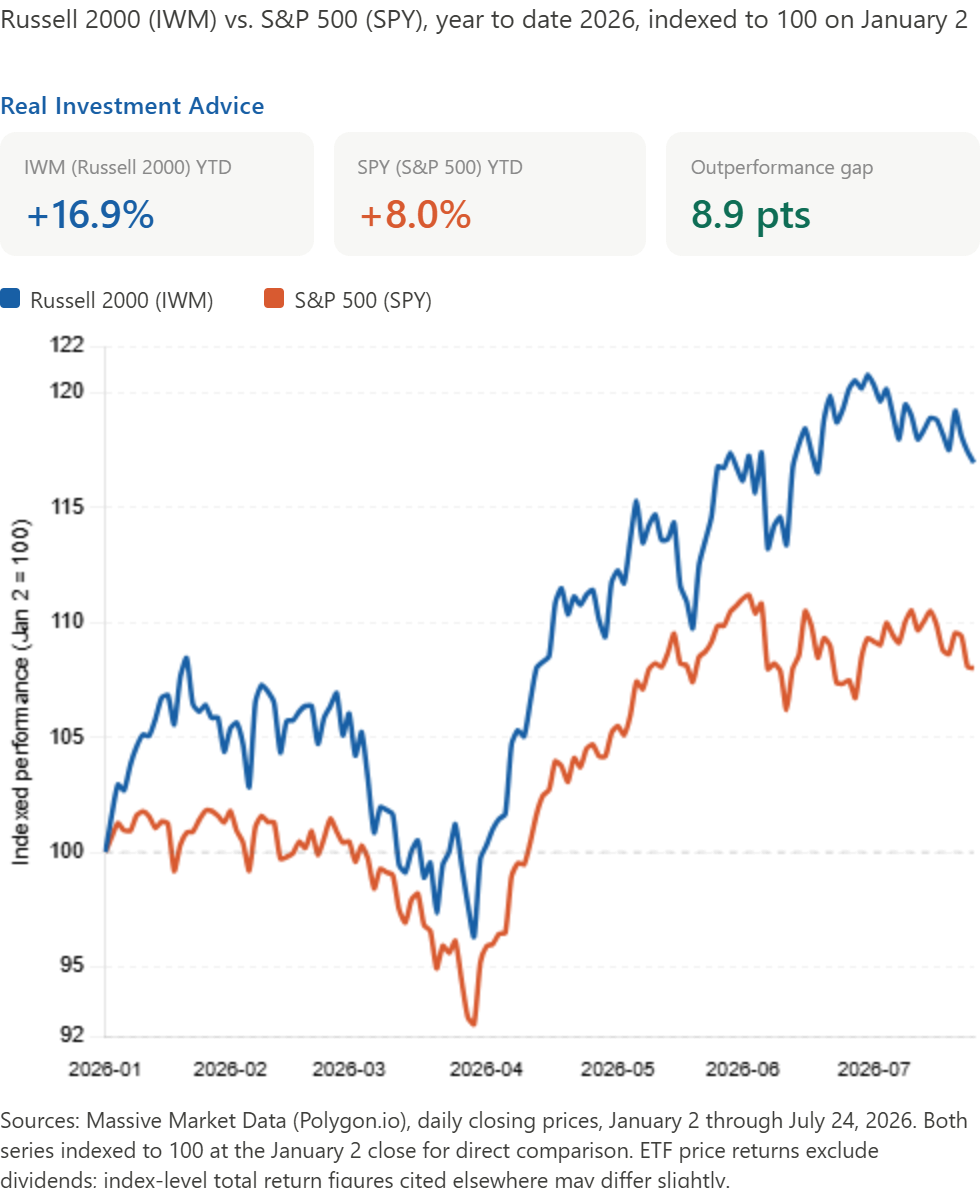
Thursday’s selloff, led by Alphabet down 7% and Tesla down nearly 15%, was a great example of a story that has been unfolding throughout most of the year. While the largest stocks led the market lower last Thursday, many other stocks, especially small caps, were flat to higher on the day. That divergence has been a defining feature of 2026.
This year, the most followed gauge of small caps, the Russell 2000, has gained roughly 17% year to date, on pace for its best annual performance since 2003. Over the same period, the S&P 500 has climbed by 8%, weighed down by the Magnificent Seven, which are up less than 5%. For the first time in a while, small caps are meaningfully outperforming megacap and other AI-related stocks.
Earnings forecasts are supportive of the outperformance of small caps. Consensus forecasts for Russell 2000 companies’ 2026 earnings growth have climbed to 38% from about 23% at the start of the year. Per LPL Financial: “reflecting growing optimism that profit growth is broadening beyond the largest technology companies.”
While performance has been good, the impact of higher rates is worth considering. Small caps carry more floating-rate debt and have greater refinancing needs than large-cap companies. To wit, Bank of America estimates every additional 25 basis point rate hike would reduce Russell 2000 operating earnings by roughly 2%.
A market that can absorb mega-cap underperformance without the average stock flinching is telling you that overall sentiment and conviction remain strong. It also highlights how flows are rapidly rotating from sector to sector or style factor to style factor.
What To Watch This Week

Market Trading Update
The S&P 500 spent most of the year riding above its 50-day moving average, and we have warned for the last couple of weeks that a break lower would be worth paying attention to. That break occurred on Thursday, as the index closed the week at 7,411.98, roughly 0.8% below the 50-DMA at 7,467, marking its first decisive break below that line in months.
Momentum has clearly rolled over. The 14-day RSI sits in the mid-40s, below the neutral 50 line but not yet oversold, suggesting there is room for further downside before the tape gets stretched. The MACD agrees with the signal line crossing bearish about a week ago, and the histogram keeps widening to the downside. This is what the early innings of a pullback look like, not the middle or the end.

One encouraging detail sits beneath the surface. The tight link between the hyperscalers and the semiconductors has broken down, and the chip complex actually held up on the week, even as the megacaps were sold. Decliners still outran advancers by roughly three to one on the New York Stock Exchange during Thursday’s rout. This was a real risk-off session, not a quiet drift. A theme that rotates internally behaves very differently from one that investors are abandoning wholesale.
The bigger trend is still intact. The 200-day moving average sits at 7,001, and the index remains almost 6% above it. A slide to the 50-DMA or even the July closing low near 7,354 would be entirely normal inside an ongoing uptrend. The line that matters is the 200-DMA. Lose that, and the conversation changes.

In our own models, we continue to hold the AI complex at target weight rather than above it. We are not adding to them, given next week’s hyperscaler prints; instead, we would rather let the reports clear and buy confirmation than pay up for a guess. That discipline has kept risk contained through every one of this year’s AI-driven air pockets.
Here is the setup for next week. First resistance is the 50-DMA at 7,467, then the early-July high near 7,566, and the record close at 7,612. On the downside, watch 7,354, then the June closing low at 7,266, and the 100-day average at 7,172. A close back above the 50-DMA would repair most of the technical damage. A close below 7,266 would put the 200-DMA in play and argue for a more defensive posture.

The Week Ahead
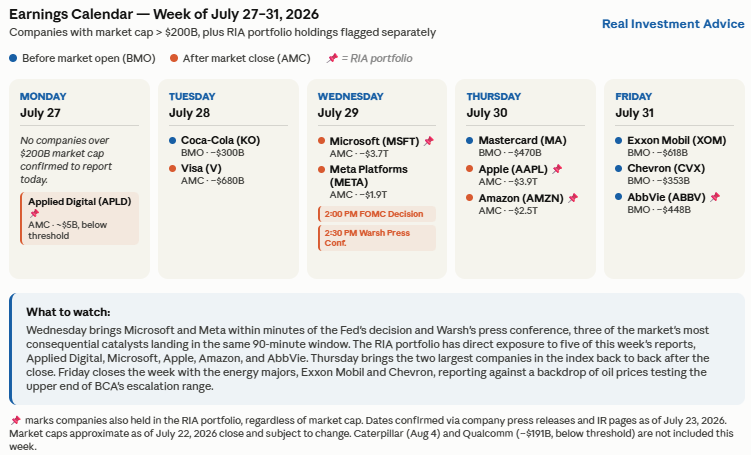
In addition to earnings from many of the largest S&P 500 companies and many other companies, this week will feature the potential for a plethora of market-moving news.
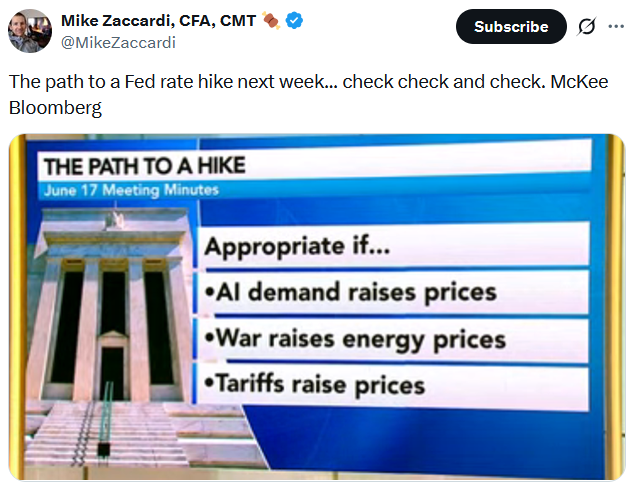
The Fed’s FOMC meeting concludes Wednesday, with the rate decision at 2:00 PM and Chair Warsh holding his press conference at 2:30 PM. The market puts the odds at 34% that they raise rates from the current 3.50% to 3.75% range. If they don’t increase the Fed Funds rate, the big question will be whether any members voted for a hike. It will also be interesting to see if Warsh’s view has become more hawkish with energy prices up over 20% in the last two weeks, or if the recent CPI and PPI data tamed his hawkish view.
On Thursday, we get our first look at the second-quarter GDP. The forecast is for 1.8% growth. Also that morning we get the PCE price index, the Fed’s preferred inflation gauge. The price index is expected to be flat on the month, after rising 0.4% last month. While PCE is released a day after the FOMC meeting, there is a good chance the Fed will have the data in hand when debating policy.
AI Capex Depreciation Risk Is The Catch To Record Earnings
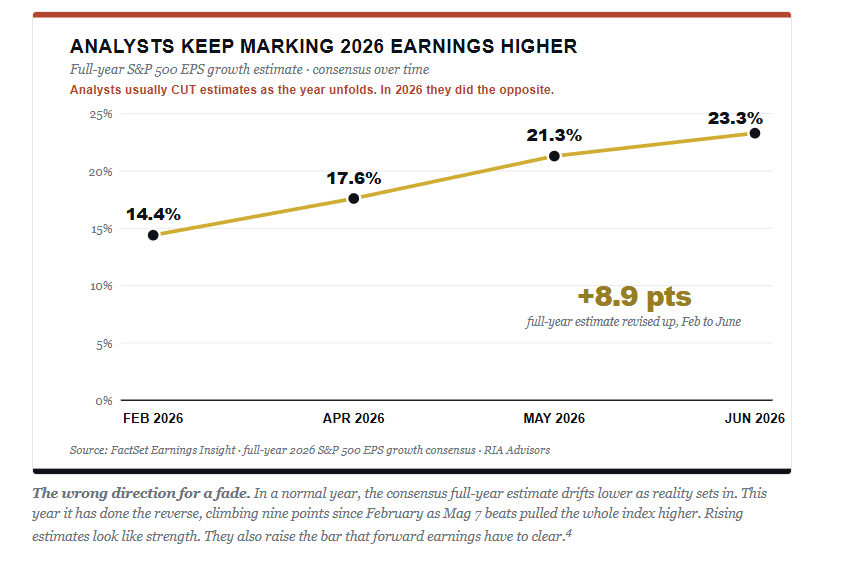
S&P 500 earnings are up more than 20% for a second straight quarter, and for once, Wall Street keeps raising its estimates instead of trimming them. Sounds great — until you look at what’s sitting just off the income statement. The five biggest AI hyperscalers are set to spend $760 billion on infrastructure this year while expensing barely a quarter of that. The rest doesn’t vanish. It’s a bill that’s already been run up and just hasn’t arrived yet.
We call it the “golden window,” and it’s the setup behind the market’s current confidence — chipmakers and buyers all looking strong at the same time, for reasons that won’t last. Free cash flow at those same companies is projected to crater 91% this year even as reported profits climb. The bull case needs a clean, on-schedule handoff from spending to revenue that these companies haven’t managed once yet. Here’s what happens when the window closes — and what it means for your portfolio.

Tweet of the Day
New UPDATED Trading Rules With Desktop Printout
“Want to achieve better long-term success in managing your portfolio? Here are our 15-trading rules for managing market risks.”
Please subscribe to the daily commentary to receive these updates every morning before the opening bell.
If you found this blog useful, please send it to someone else, share it on social media, or contact us to set up a meeting.