
Rationalizing high valuations won’t improve future return outcomes.
The reason I say this is because of a tweet from Tom McClellan recently:
Fundamentalists are worried about the SP500 at 21x earnings. But that is not the relevant price ratio. This is: pic.twitter.com/D0WZ3llZYF
— Tom McClellan (@McClellanOsc) June 2, 2020
While I have an immense amount of respect for Tom, the exercise of manipulating valuation measures can lead to false conclusions. Take the following chart.
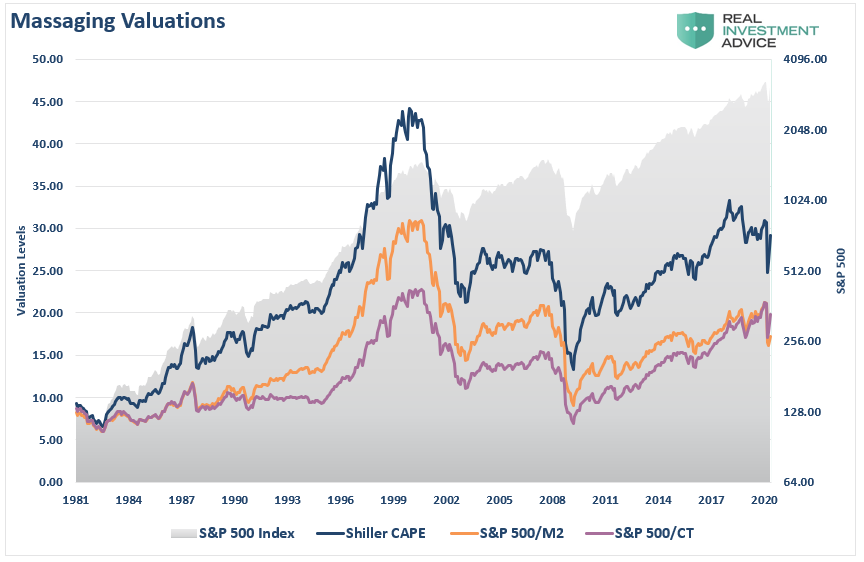
The dark blue line is Shiller’s CAPE measure as compared to Tom’s M2 measure and our CT measure. Clearly, both measures show the market is substantially cheaper than Shiller’s smoothed price to earnings model. Moreover, both the M2 and CT measures have a very high correlation of nearly 90%.
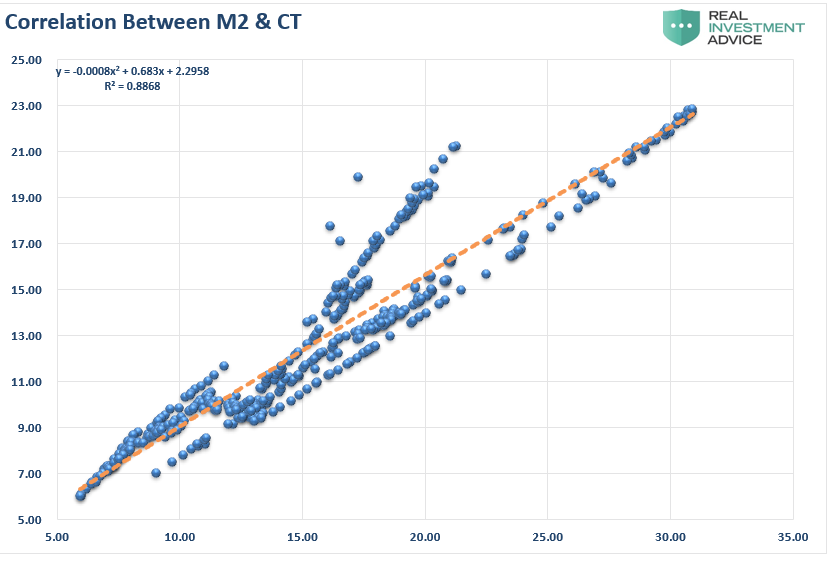
Therefore, investors can rationalize that by using either M2 or CT, stocks should have higher return rates in the future.
The problem is that the CT model has nothing to do with asset markets. It’s a measure of “College Tuition” expenditures. So, while there is a spurious correlation to both Shiller’s CAPE and M2, the measure has little to do with forward return expectations or current valuations.
Why is this important?
While valuations can seem passive over short periods of time, and they are indeed horrible market timing measures, they have everything to do with future outcomes.
“Price is what you pay, value is what you get.” – Warren Buffett.

Measuring Valuations The Correct Way
When discussing valuations it is important to maintain a proper perspective. Valuations are NOT a market timing device to tell you to buy or sell stocks. What valuations do provide is a framework for understanding forward returns over long periods of time.
Despite the markets outperformance over the last 10-years, such was due to the unprecedented monetary interventions by the Federal Reserve. Regardless, markets have a strong tendency to revert to their average performance over time, which is not nearly as much fun as it sounds.
As investors, our job is not only to invest for today but to understand the potential of long-term impacts.
When considering stock valuations, one should only use the past 12-months of reported earnings, known as GAAP earnings, which includes “all of the bad stuff.” The reason is that all analysis uses trailing GAAP earnings as the denominator. These are “known” earnings and makes valuation analysis more reliable.
Conversely, Wall Street analysts use operating earnings, or “earnings without all that bad stuff,” to deflate multiples using forward “guesses.” This method provides the rationalization for overpaying for assets during periods of excess valuations.
Importantly, using operating earnings also provides a faulty comparison between valuation models which are largely based on “known” trailing earnings.
However, this is where we must make an important distinction.

Starting Valuations Matter Most
When discussing valuations, the starting level when you begin your investment journey is the most critical. Such was a point discussed previously:
“The chart below shows the history of secular bull market periods going back to 1871 using data from Dr. Robert Shiller. You will notice that secular bull markets tend to begin with CAPE 10 valuations around 10x earnings or even less. They tend to end around 23-25x earnings or higher. (Over the long-term valuations do matter.) “
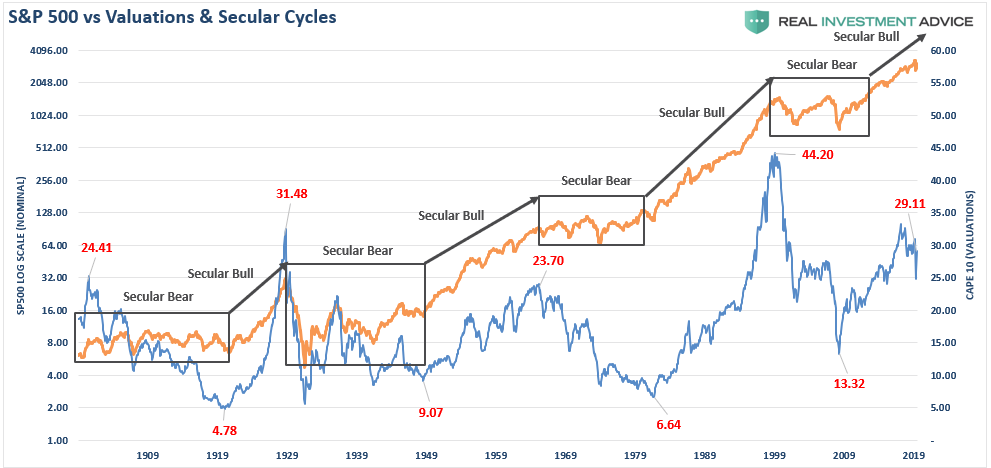
The two previous 20-year secular bull markets begin with valuations in single digits. At the end of the first decade of those secular advances, valuations were still trading below 20x. Currently, valuations are still hovering near 30x.
But that is just today. Over the next couple of quarters, the “E” is will drop markedly as the impact of the economic shutdown settles in. While it is hoped there will only be a mild-reduction in earnings, historically, they have reverted past the long-term exponential trend.
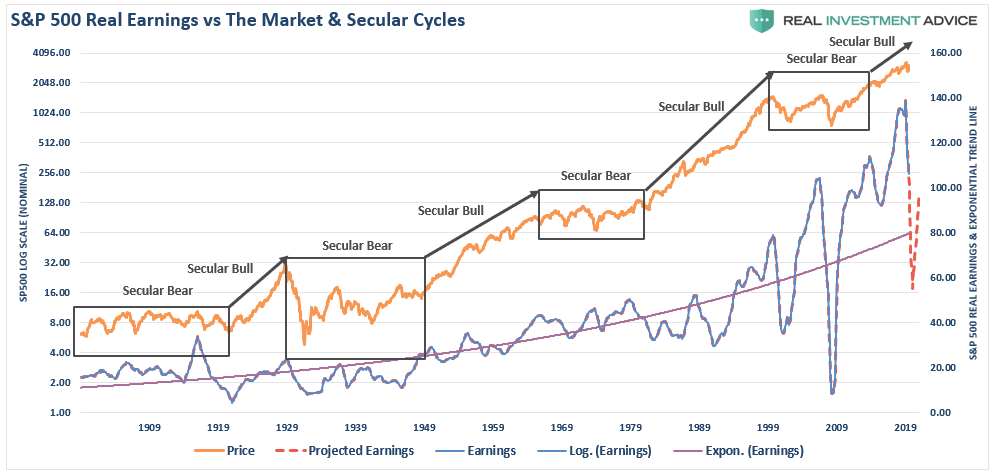
Given 13% unemployment rates and a recession of nearly 20%, earnings will likely revert toward $60/share. Such a decline will push current valuations to historically high levels assuming prices remain elevated.
The 1920-1929 secular advance most closely mimics the current 2010 cycle. While valuations started below 5x earnings in 1919, they eclipsed 30x earnings ten-years later in 1929. The rest, as they say, is history. Or rather, maybe “past is prologue” is more fitting.
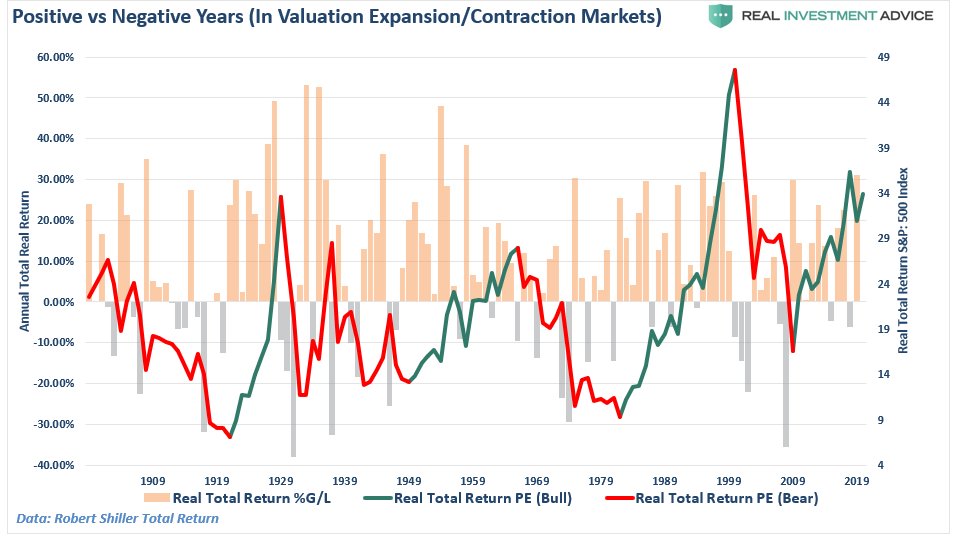
High Valuations & Low Returns
Another confusion when discussing future low rates of returns is misunderstanding each year will be a low return. That assumption is incorrect. What high valuations tend to dictate is the return for the entire period will be low.
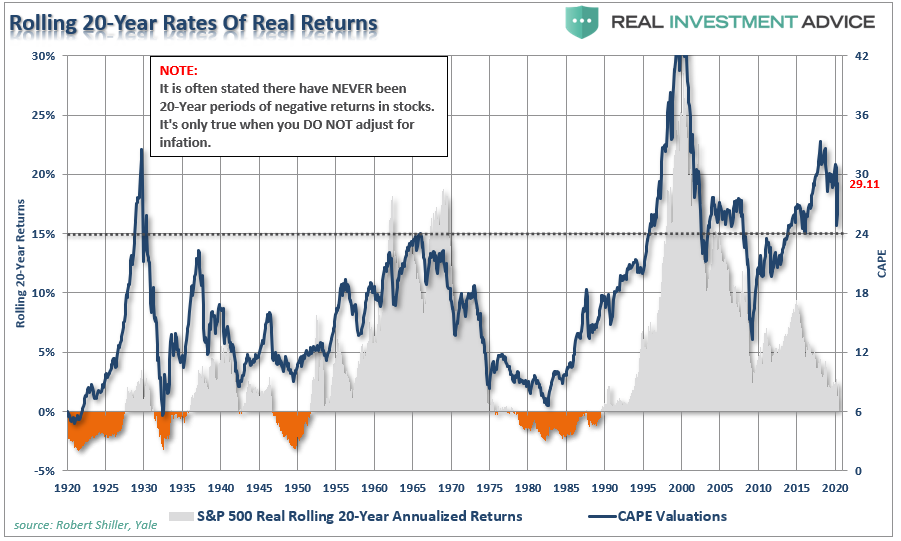
The chart below shows 10-year rolling REAL, inflation-adjusted returns in the markets. (Note: Spikes in 10-year returns, which occurred because the 50% decline in 2008 dropped out of the equation, has previously denoted peaks in forward annual returns.)

(Important note: Many advisers/analysts often pen that the market has never had a 10 or 20-year negative return. That is only on a nominal basis. Inflation must be included in the debate.)
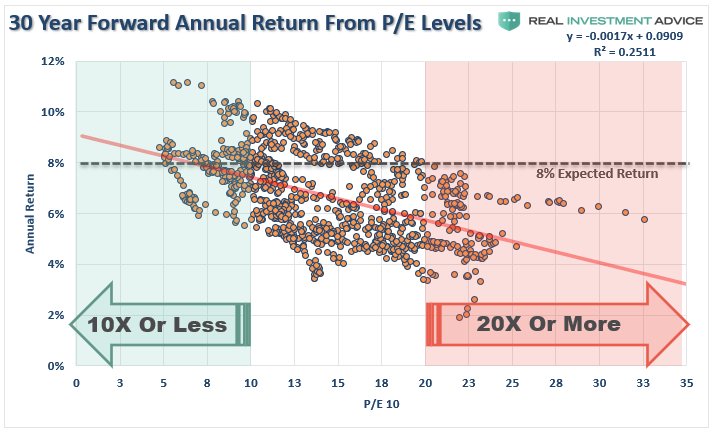
Even on a 30-year rolling return basis, high “starting valuations” suggest lower than expected rates of returns in the future.

There are two crucial points to take away from the data.
- There are several periods throughout history where market returns were not only low but negative. (Given that most people only have 20-30 functional years to save for retirement, a 20-year low return period can devastate those plans.)
- Periods of low returns follow periods of excessive market valuations and encompass the majority of negative return years. (Read more about this chart here)
“Importantly, it is worth noting that negative returns tend to cluster during periods of declining valuations. These ‘clusters’ of negative returns are what define ‘secular bear markets.’”
The Mistake Investors Make
The mistake investors repeatedly make is dismissing the data in the short-term because there is no immediate impact on price returns. As noted above, valuations by their very nature are HORRIBLE predictors of 12-month returns. Investors avoid any investment strategy which has such a focus. In the longer term, however, valuations are strong predictors of expected returns.
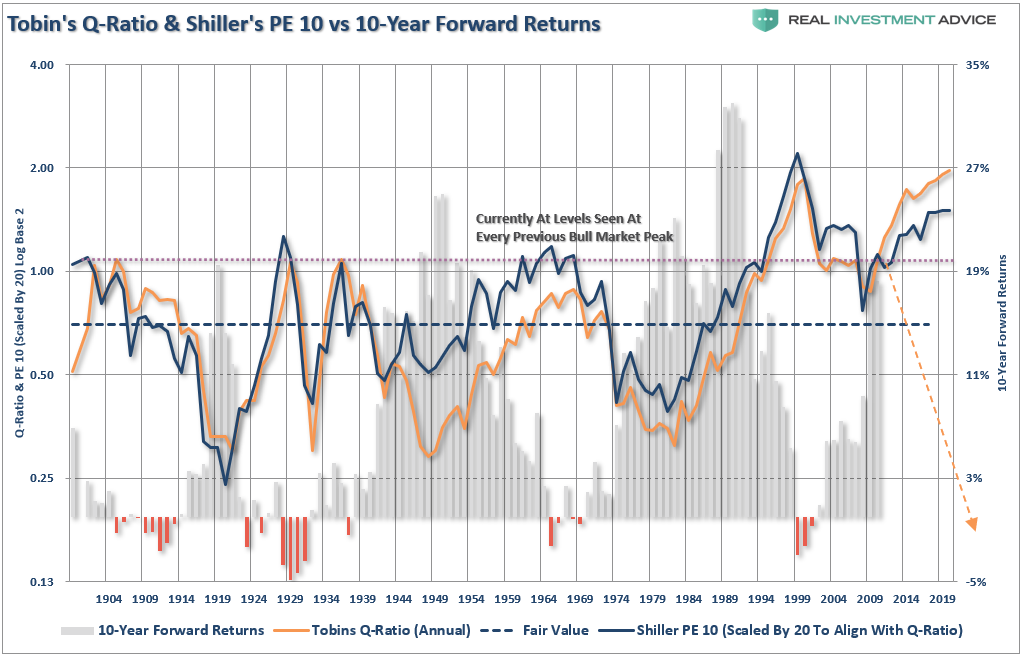
It isn’t just trailing valuations suggesting markets are overpriced and expensive. The chart below shows Dr. Robert Shiller’s cyclically adjusted P/E ratio compared with Tobin’s Q-ratio. The Q-ratio measures the “replacement cost” for the firms assets in the broad Wilshire 5000 index. (This measure has nothing to do with earnings.)
Unsurprisingly, Tobin’s Q is also at historically expensive valuations hitting the highest level since the peak in 2000. Furthermore, note forward 10-year returns do NOT improve from historically expensive levels, but decline sharply.
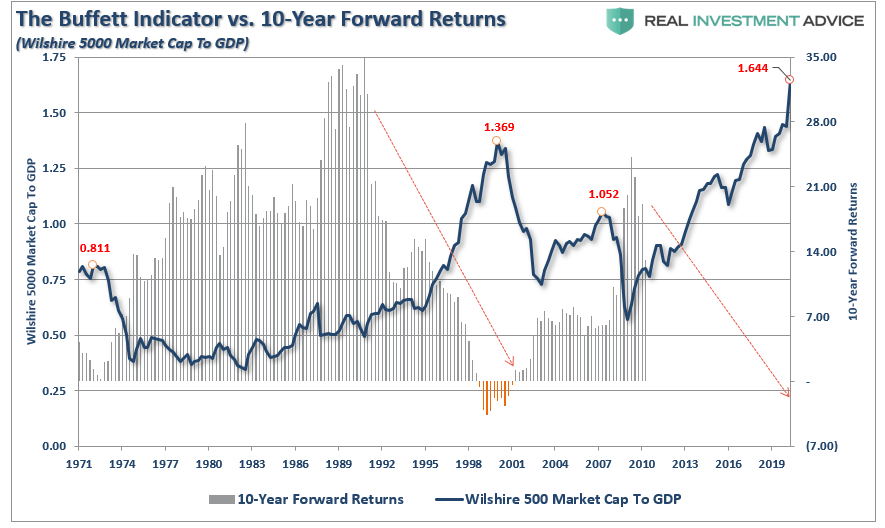
Warren Buffett’s favorite valuation measure also supports current valuation concerns (which may explain why he is sitting on $137 billion in cash.). The following measure is the price of the Wilshire 5000 market capitalization level divided by GDP. Given the stock market is not the economy, asset prices should reflect underlying economic growth rather than the “irrational exuberance” of investors.
(The analysis below includes the latest Atlanta Fed estimate for Q2-2020 GDP)
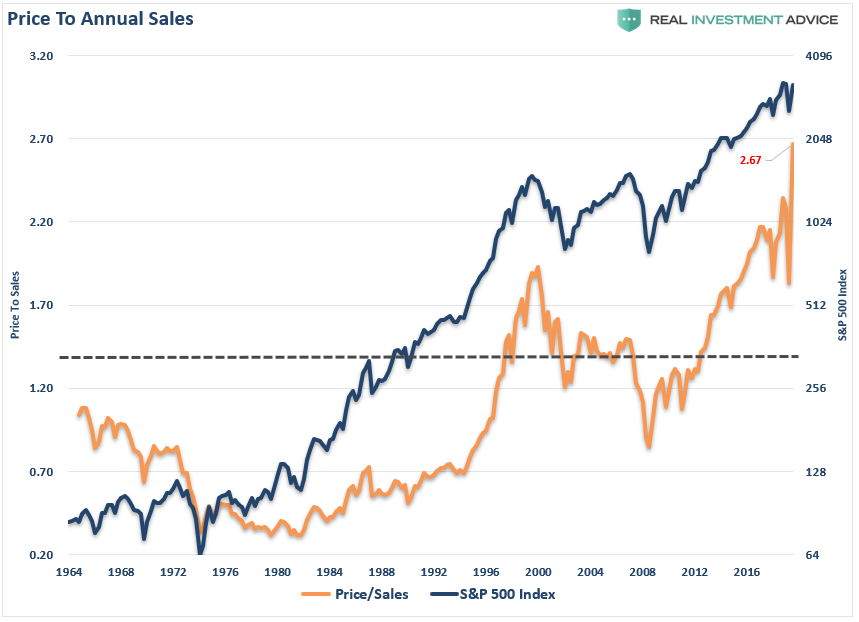
Lastly, one figure that is hard to fudge or manipulate is sales. Such is where corporations derive earnings and profitability. Given the coming drop in sales over the two quarters, the price-to-sales ratio will surge to historic heights. Like valuations, overpaying for revenue tends to have less desirable outcomes.
No matter how you analyze the data, the potential future outcomes for investors is likely to be less desirable than many hope.

Bull Now, Pay Later
In the short-term, the bull market continues as the flood of liquidity, and accommodative actions, from global Central Banks, has lulled investors into a state of complacency rarely seen historically. As Richard Thaler, the famous University of Chicago professor who won the Nobel Prize in economics once stated:
“We seem to be living in the riskiest moment of our lives, and yet the stock market seems to be napping. I admit to not understanding it. Nothing seems to spook the market.”
While market analysts continue to come up with a variety of rationalizations to justify high valuations, none of them hold up under real scrutiny. The problem is while Central Bank interventions boost asset prices in the short-term, over the long-term there is an inherently negative impact on economic growth. As such, it leads to the repetitive cycle of monetary policy.
- Monetary policy drags forward future consumption leaving a void in the future.
- Since monetary policy does not create self-sustaining economic growth, ever-larger amounts of liquidity are needed to maintain the same level of activity.
- The filling of the “gap” between fundamentals and reality leads to economic contraction.
- Job losses rise, wealth effect diminishes, and real wealth reduces.
- The middle class shrinks further.
- Central banks act to provide more liquidity to offset recessionary drag and restart economic growth by dragging forward future consumption.
- Wash, Rinse, Repeat.
If you don’t believe me, here is the evidence.
“Through the end of the Q1-2020, the stock market has returned almost 127.79% from the 2007 peak using quarterly data. Such is more than 3x the growth in GDP and 6.5x the increase in corporate revenue. (I have used SALES growth in the chart below as it is what happens at the top line of income statements and is not AS subject to manipulation.) “
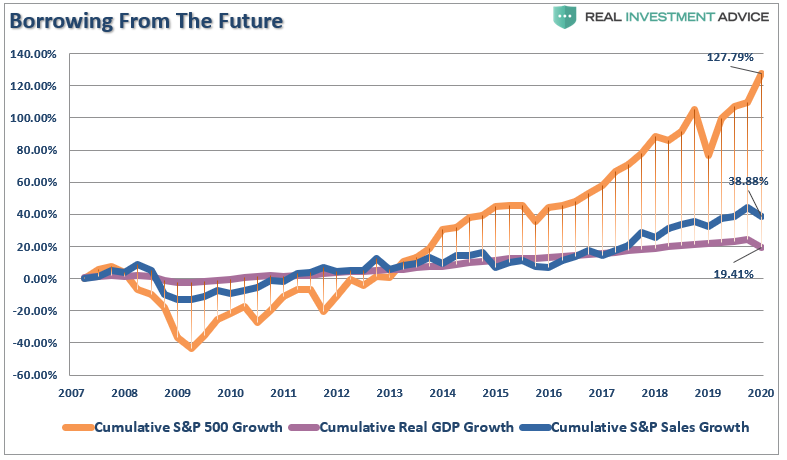
Unfortunately, the “wealth effect” impact has only benefited a relatively small percentage of the overall economy.
The Risk Of Overpaying
While it is “bullish” to come up with reasons to justify overpaying for assets in the short-term, outcomes are quite different long-term.
If this wasn’t the case, then “riddle me this.”
If investing works like the media suggests, then why are 80% of Americans living paycheck-to-paycheck? Why is it just the top 10% of income earners own 88% of the stock market?
The reality is that investing long-term is hard. Short-term exuberance tends to lead to poor long-term returns.
Let me conclude with this key quote from Vitaliy Katsenelson, which sums up our investing view:
“Our goal is to win a war, and we may need to lose a few battles in the interim.
Yes, we want to make money, but it is even more important not to lose it. If the market continues to mount even higher, we will likely lag. The stocks we own will become fully valued, and we’ll sell them. If our cash balances continue to rise, then they will. We are not going to sacrifice our standards and thus let our portfolio be a byproduct of forced or irrational decisions.
We are willing to lose a few battles, but those losses will be necessary to win the war. Timing the market is an impossible endeavor. We don’t know anyone who has done it successfully on a consistent and repeated basis. In the short run, stock market movements are completely random – as random as you’re trying to guess the next card at the blackjack table.”
Rationalizing high valuations today will likely lead to ultimately “losing the war.”

