


As we near the 2020 Presidential election, rhetoric from both sides is ramping up. Depending on your personal “echo chamber” of social media, you are likely confident why your candidate is the best choice, and the opposition is the worst. However, when it comes to economic prosperity and the financial markets, who is the best choice? To answer that question, we will focus on the “policies,” not the “politics.”
The Pre-Election Event
“Policies, Not Politics.”
Join Richard Rosso, CFP, and Danny Ratliff, CFP, for an in-depth look at both party’s platforms and how upcoming changes could affect your retirement, social security, medicare, and how you invest. From taxes to the markets, they will provide the answers you are looking for.
- When: TOMORROW – Saturday, October 24th, 2020
- Time: 8-9am
- Where: An exclusive GoTo Webinar Event (Register Now)

The Great Divide
One of the great tragedies of the modern age is that we have stopped “listening” to each other. There was a time when individuals could have a conversation about political issues. While neither person would change their position, they could politely agree to disagree. Today, the media has locked individuals into “information silos” where they disregard any “facts” which conflict with personal bias. If an intruder infiltrates the space, the “mob” levies a torrent of hate-filled expletives and threats
More than ever, such is the case in 2020.
“For the second election in a row, voters will cast ballots for the candidate they dislike less, not whose policies they like more.” – Lance Roberts, Real Investment Show
Today, the division between parties is greater than at any other single point in history. (2017 was the latest data from a 2019 report. That gap is even larger currently as Social Media fuels the divide.) The divide between parties has many dire long-term outcomes, from transitioning to a socialistic economy to the lack of real positive changes.
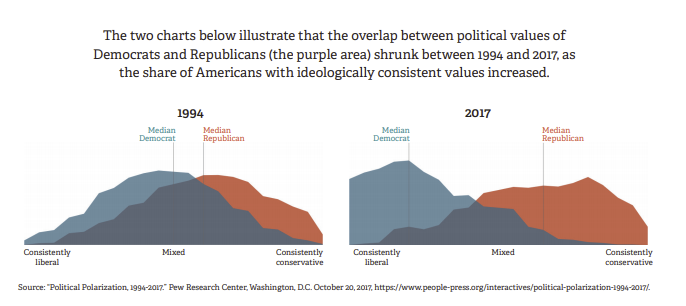
How can progress occur when no one is willing to listen, much compromise, with anyone else?

The Cynic In Me
In 2020, both parties are proposing fairly disastrous policies.
Biden’s proposed tax changes, green energy plans, and Government takeover of “healthcare” would indeed be bad for the markets. Such policies would weaken corporate profitability, specific sectors (energy and healthcare) would come under stress, and the surge in debt will make the Fed’s programs less effective.
On the other hand, Trump’s plans are not much better economically. More bailouts, poorly chosen infrastructure projects, and proposed tax policy lead to further indebtedness, larger deficits, and slower economic growth.
However, the reality is that while Presidential candidates make lots of claims on the campaign trail, it is Wall Street and Corporations that ultimately dictate policy. Such is why many suggest that our Congressmen wear racing jackets to see who is sponsoring them for office.

If you think for a moment that Congress comes up with, and writes, bills on their own, you are sadly mistaken. They are not that smart. Such is why whenever bills come to the floor for a vote, they always favor the group or industry whose lobby wrote and promoted the bill in the beginning.
I am not cynical. It is just how the Government works.
Okay, let’s dig into the policies with some help from our friends at the Committee For A Responsible Federal Budget (CFRB)
The Proposed Policies
“President Donald Trump has issued a 54 bullet point agenda. It calls for lowering taxes, strengthening the military, increasing infrastructure spending, expanding spending on veterans and space travel. It also calls for lowering drug prices, expanding school and health care choice, ending wars abroad, and reducing spending on immigrants. He also has proposed a “Platinum Plan” for black Americans, which increases spending on education and small businesses.
Meanwhile, Vice President Joe Biden has proposed a detailed agenda. From increasing spending on child care and education, health care, and retirement, to disability benefits, infrastructure, research, and climate change. It also aims to lower the costs of prescription drugs, ending wars abroad, and increasing taxes on high-income households and corporations.
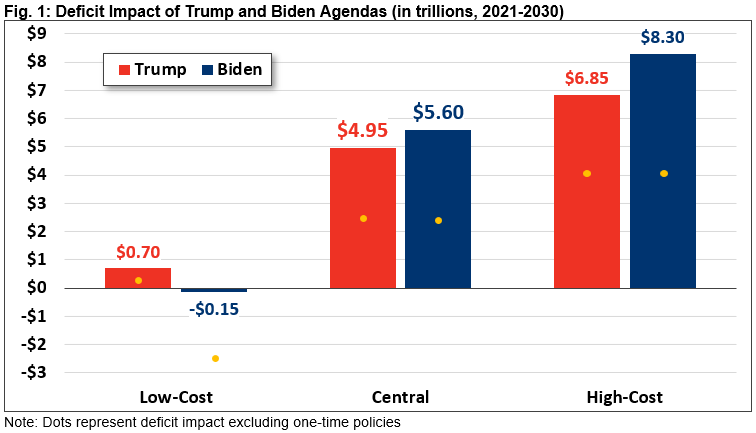
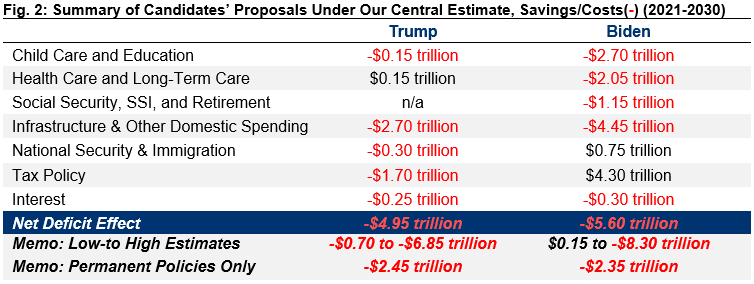
Under our central estimate, both plans would add substantially to the debt. Specifically, we find the Trump plan would add $4.95 trillion to the debt over the 2021 to 2030 budget window. The Biden plan would add $5.60 trillion.” – CFRB
The table below breaks down the spending by candidates in different areas of the economy.
Assuming that both candidates were able to get their respective policies passed, which is highly doubtful, the impact on economic growth will be negative as the Federal debt surges higher.

The Cost
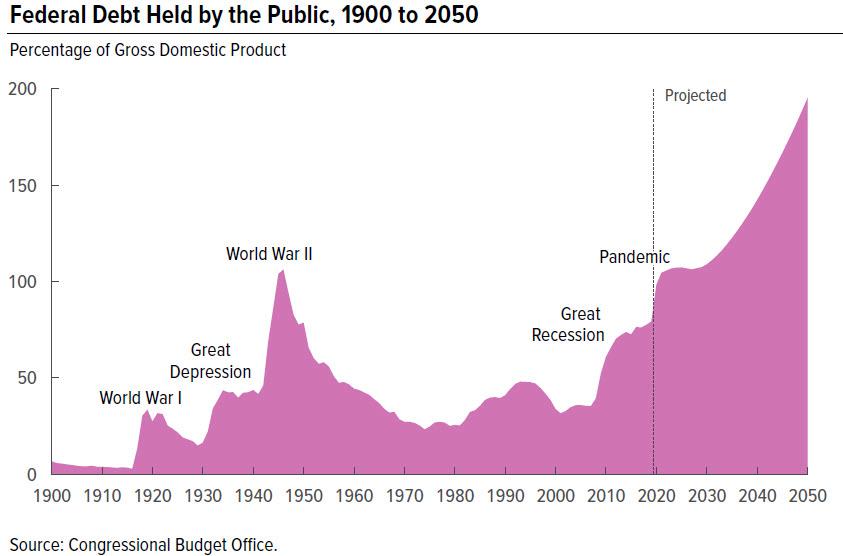
“Under the candidates’ plans, debt will continue to grow over the next decade and beyond. Debt has already grown from 39 percent of the economy in 2008 to 76 percent in 2016. It is estimated to reach 98 percent by the end of FY2020. Under current law. The Congressional Budget Office (CBO) projects debt will continue to rise to 109 percent of GDP by 2030.
Our central estimate of the Trump plan finds debt would rise to 125 percent of the economy by 2030, excluding the effects of further COVID relief. Under our central estimate of the Biden plan, debt would rise to 128 percent of the economy by 2030, again excluding COVID proposals. For context, the standing historical record for debt is 106 percent of GDP, set just after World War II.” – CFRB.

As discussed in CBO & The One-Way Trip Of American Debt,” instead of running on a policy platform to reduce spending and the debt, both candidates have decided that more deficit spending is the only solution.
“Debt continues to increase in most years thereafter, reaching 195 percent of GDP by 2050. That amount of debt will be the highest in the nation’s history, and will increase further. High and rising federal debt makes the economy more vulnerable to rising interest rates and, depending on financing of the debt, rising inflation. The growing debt burden also raises borrowing costs and slows the growth of the economy and national income. There is an increased risk of a fiscal crisis or a gradual decline in the value of Treasury securities.” – CBO

The Debt
The policies put forth by both President Trump and Joe Biden require substantial debt issuance to meet those objectives. Given that mandatory spending already consumes more than 100% of Federal revenues, the debt increases will be massive.
Unfortunately, what continues to elude policy-makers in Washington is that the continuing expansion of debt erodes economic growth.
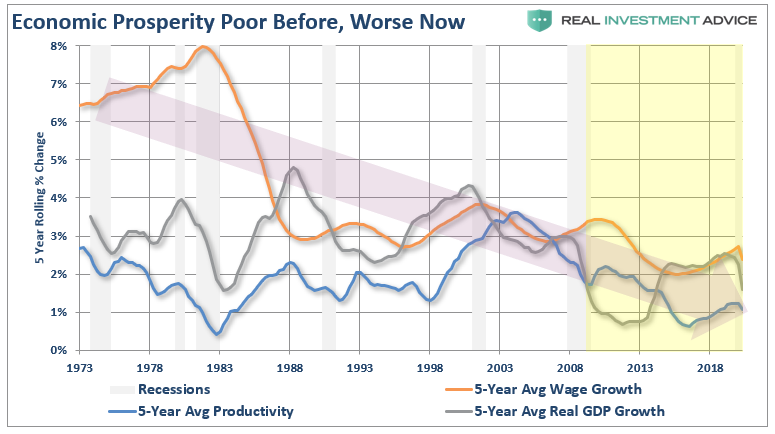
It is a myth that the economy has grown by roughly 5% since 1980. In reality, economic growth rates have been steadily declining over the past 40 years, supported by a massive push into deficit spending by both the Government and consumers.

Up until 1980, economic growth was trending higher from roughly 5% to a peak of nearly 15%. There were a couple of reasons for this.
- Lower levels of debt allowed for personal savings to remain robust, fueling productive investment in the economy.
- The focus of the economy was primarily on production and manufacturing, which has a high multiplier effect on the economy.
Unlike the steadily growing economic environment before 1980, the post-1980 economy has experienced a steady decline. Therefore, a statement the economy has been growing at 5% since 1980 is grossly misleading. The trend of economic growth, wages, and productivity (5-year averages) show the real problem.
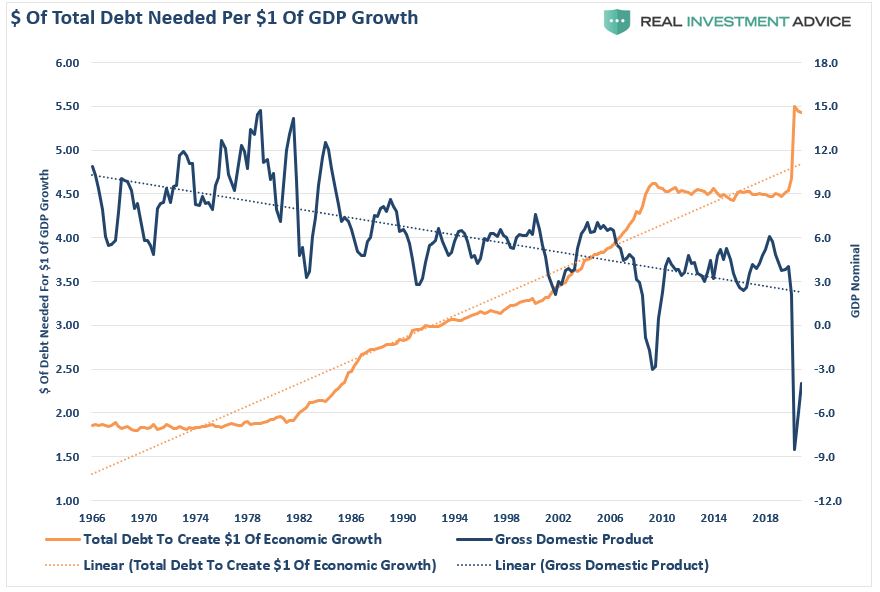
As wages declined, families turned to credit to fill the gap in maintaining their current living standards. What should be evident is that it requires increasing amounts of debt to create each dollar of economic growth. Such is due to the “diminished rate of return” for each successive increase in debt-funded growth.
Debt Isn’t The Answer
Such is one of the primary reasons why economic growth will continue to run at lower levels going into the future. As I showed just recently in the “2nd Derivative Of Debt:”
“From 1947 to 2008, the U.S. economy had real, inflation-adjusted economic growth than had a linear growth trend of 3.2%.
However, following the 2008 recession, the growth rate dropped to the exponential growth trend of roughly 2.2%. Unfortunately, instead of reducing outstanding debt problems, the Federal Reserve provided policies that fostered even greater unproductive debt and leverage levels.
Coming out of the 2020 recession, the economic trend of growth will be somewhere between 1.5% and 1.75%. Given the amount of debt added to the overall system, the ongoing debt service will continue to retard economic growth.”
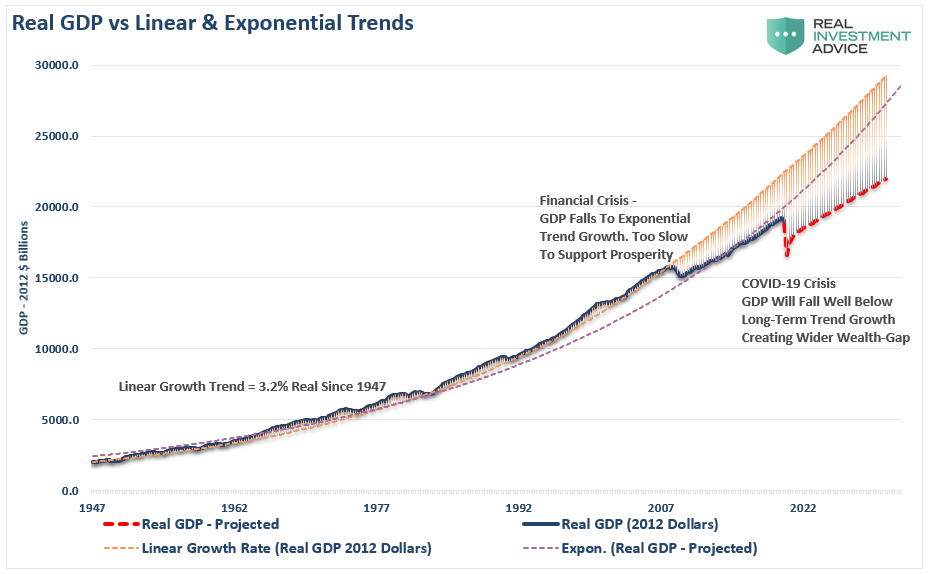
Given the permanent loss in output and rising unproductive debt levels, the recovery will be slower and more protracted than those hoping for a “V-shaped” recovery. Notably, the U.S. economy will never return to either its long-term linear or exponential growth trends.

The Markets
The Republicans claim that Biden will crash the market. The Democrats suggest the same with President Trump. From a portfolio management perspective, we need to understand what happens during election years to stock markets and investor returns.
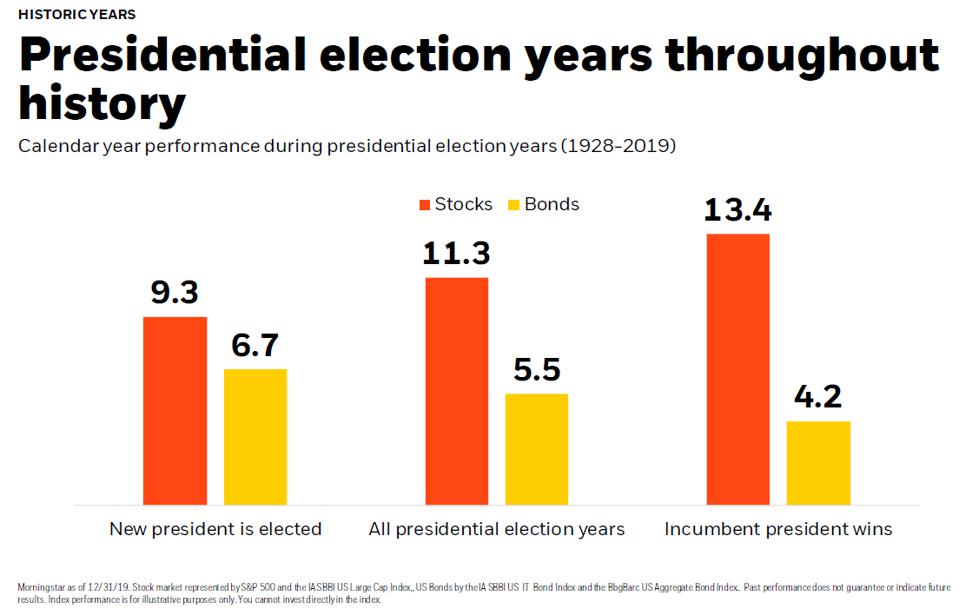
Since President Rosevelt’s victory in 1944, there have only been two losses during presidential election years: 2000 and 2008. Those two years corresponded with the “Dot.com Crash” and the “Financial Crisis.” On average, stocks produced their second-best performance in Presidential election years.
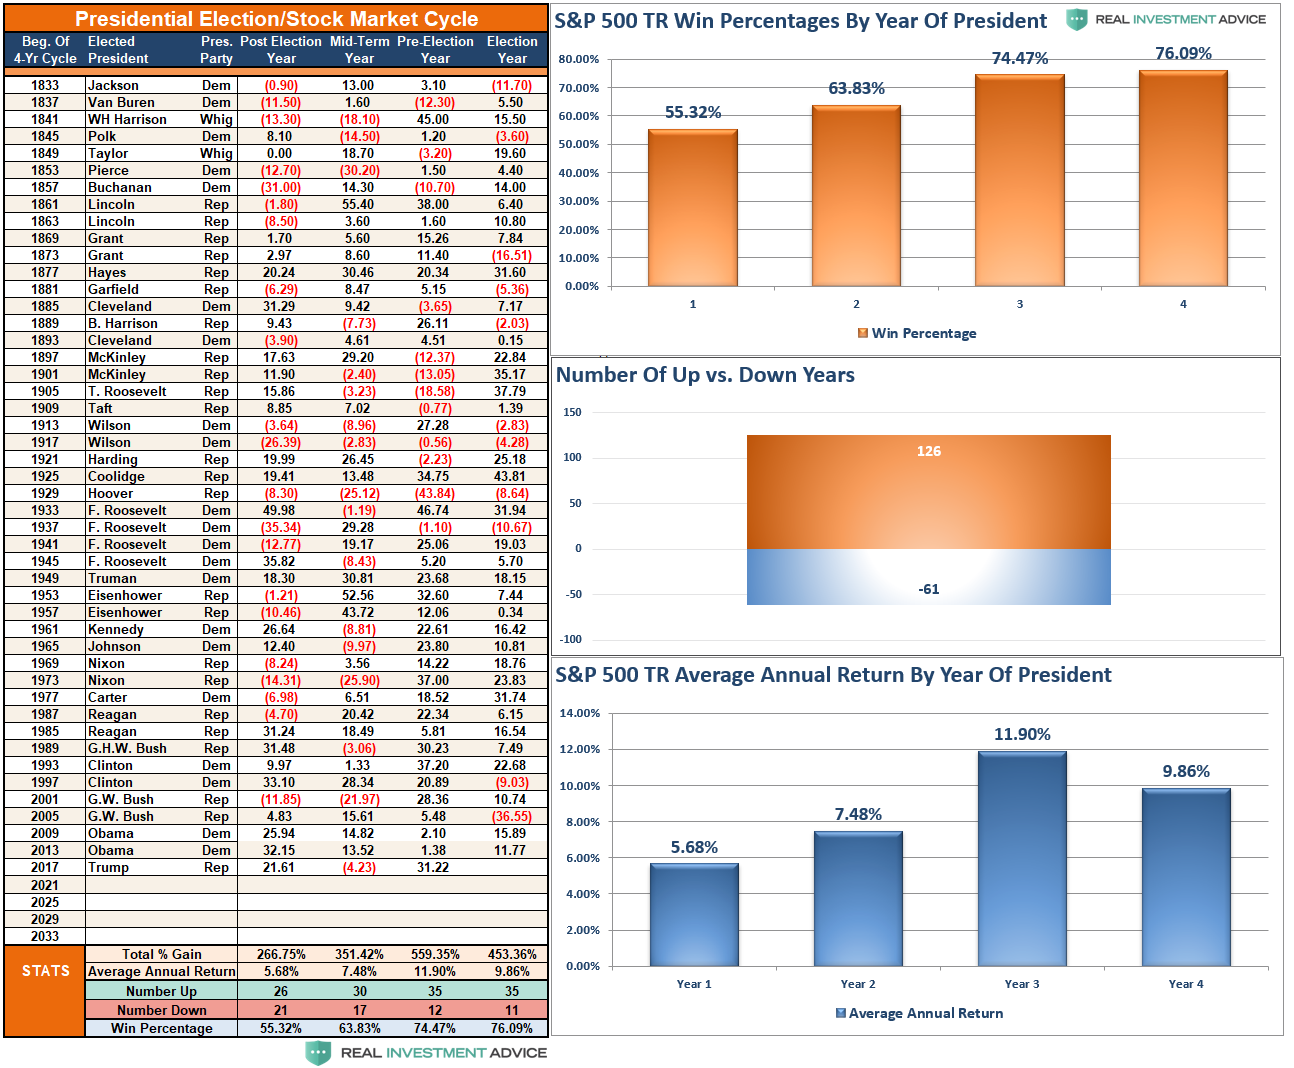
However, it is worth noting that while returns are positive regardless of who is elected, it should be of no surprise the markets performed better during a year when voters re-elect the incumbent.
The market hates uncertainty.
What markets do prefer is “political gridlock.”
“A split Congress historically has been better for stocks, which tend to like that one party doesn’t have too much sway. Stocks gained close to 30% in 1985, 2013, and 2019, all under a split Congress, according to LPL Financial. The average S&P 500 gain with a divided Congress was 17.2% while GDP growth averaged 2.8%.” – USA Today

It’s Not A Risk-Free Outcome
We can derive from the data that the odds suggest the market will end this year on a positive note. However, such says little about next year. If you go back to our data table above, the 1st year of a new Presidential cycle is roughly a 50/50 outcome. It is also the lowest average return year going back to 1833.
I don’t envy the person who takes the Oval Office in the months ahead. Whoever is inaugurated on January 20, 2021, will enormous fiscal challenges as trillion-dollar annual budget deficits will become the new normal. As we discussed recently, the national debt is projected to exceed the post-World War II record high over the next four-year term and reach twice the economy’s size within 30 years.
Four major trust funds are also headed for insolvency, including the Highway and Medicare Hospital Insurance trust funds, within the next presidential term. Furthermore, economic growth rates will continue to decline as the “wealth gap” widens.
There is no “will” to fix the problems plaguing the economy and welfare system before they break. Such is why whoever wins the Presidency, we all still wind up losing.


Lance Roberts is a Chief Portfolio Strategist/Economist for RIA Advisors. He is also the host of “The Lance Roberts Podcast” and Chief Editor of the “Real Investment Advice” website and author of “Real Investment Daily” blog and “Real Investment Report“. Follow Lance on Facebook, Twitter, Linked-In and YouTube
Customer Relationship Summary (Form CRS)
Also Read


