


Stocks are priced for perfection. Bonds trade at historically low yields despite 7% inflation. What could go wrong?
As fiscal and monetary support for the economy and markets wane, valuation extremes are in the crosshairs. While the setup for 2022 is not looking as friendly as 2021, we must realize the environment can change quickly.
For more on the macroeconomic drivers supporting this forecast, please read Part 1 of our 2022 Investment Outlook – Tailwinds Shift To Headwinds.
2022 Investment Outlook for Stocks
Valuations
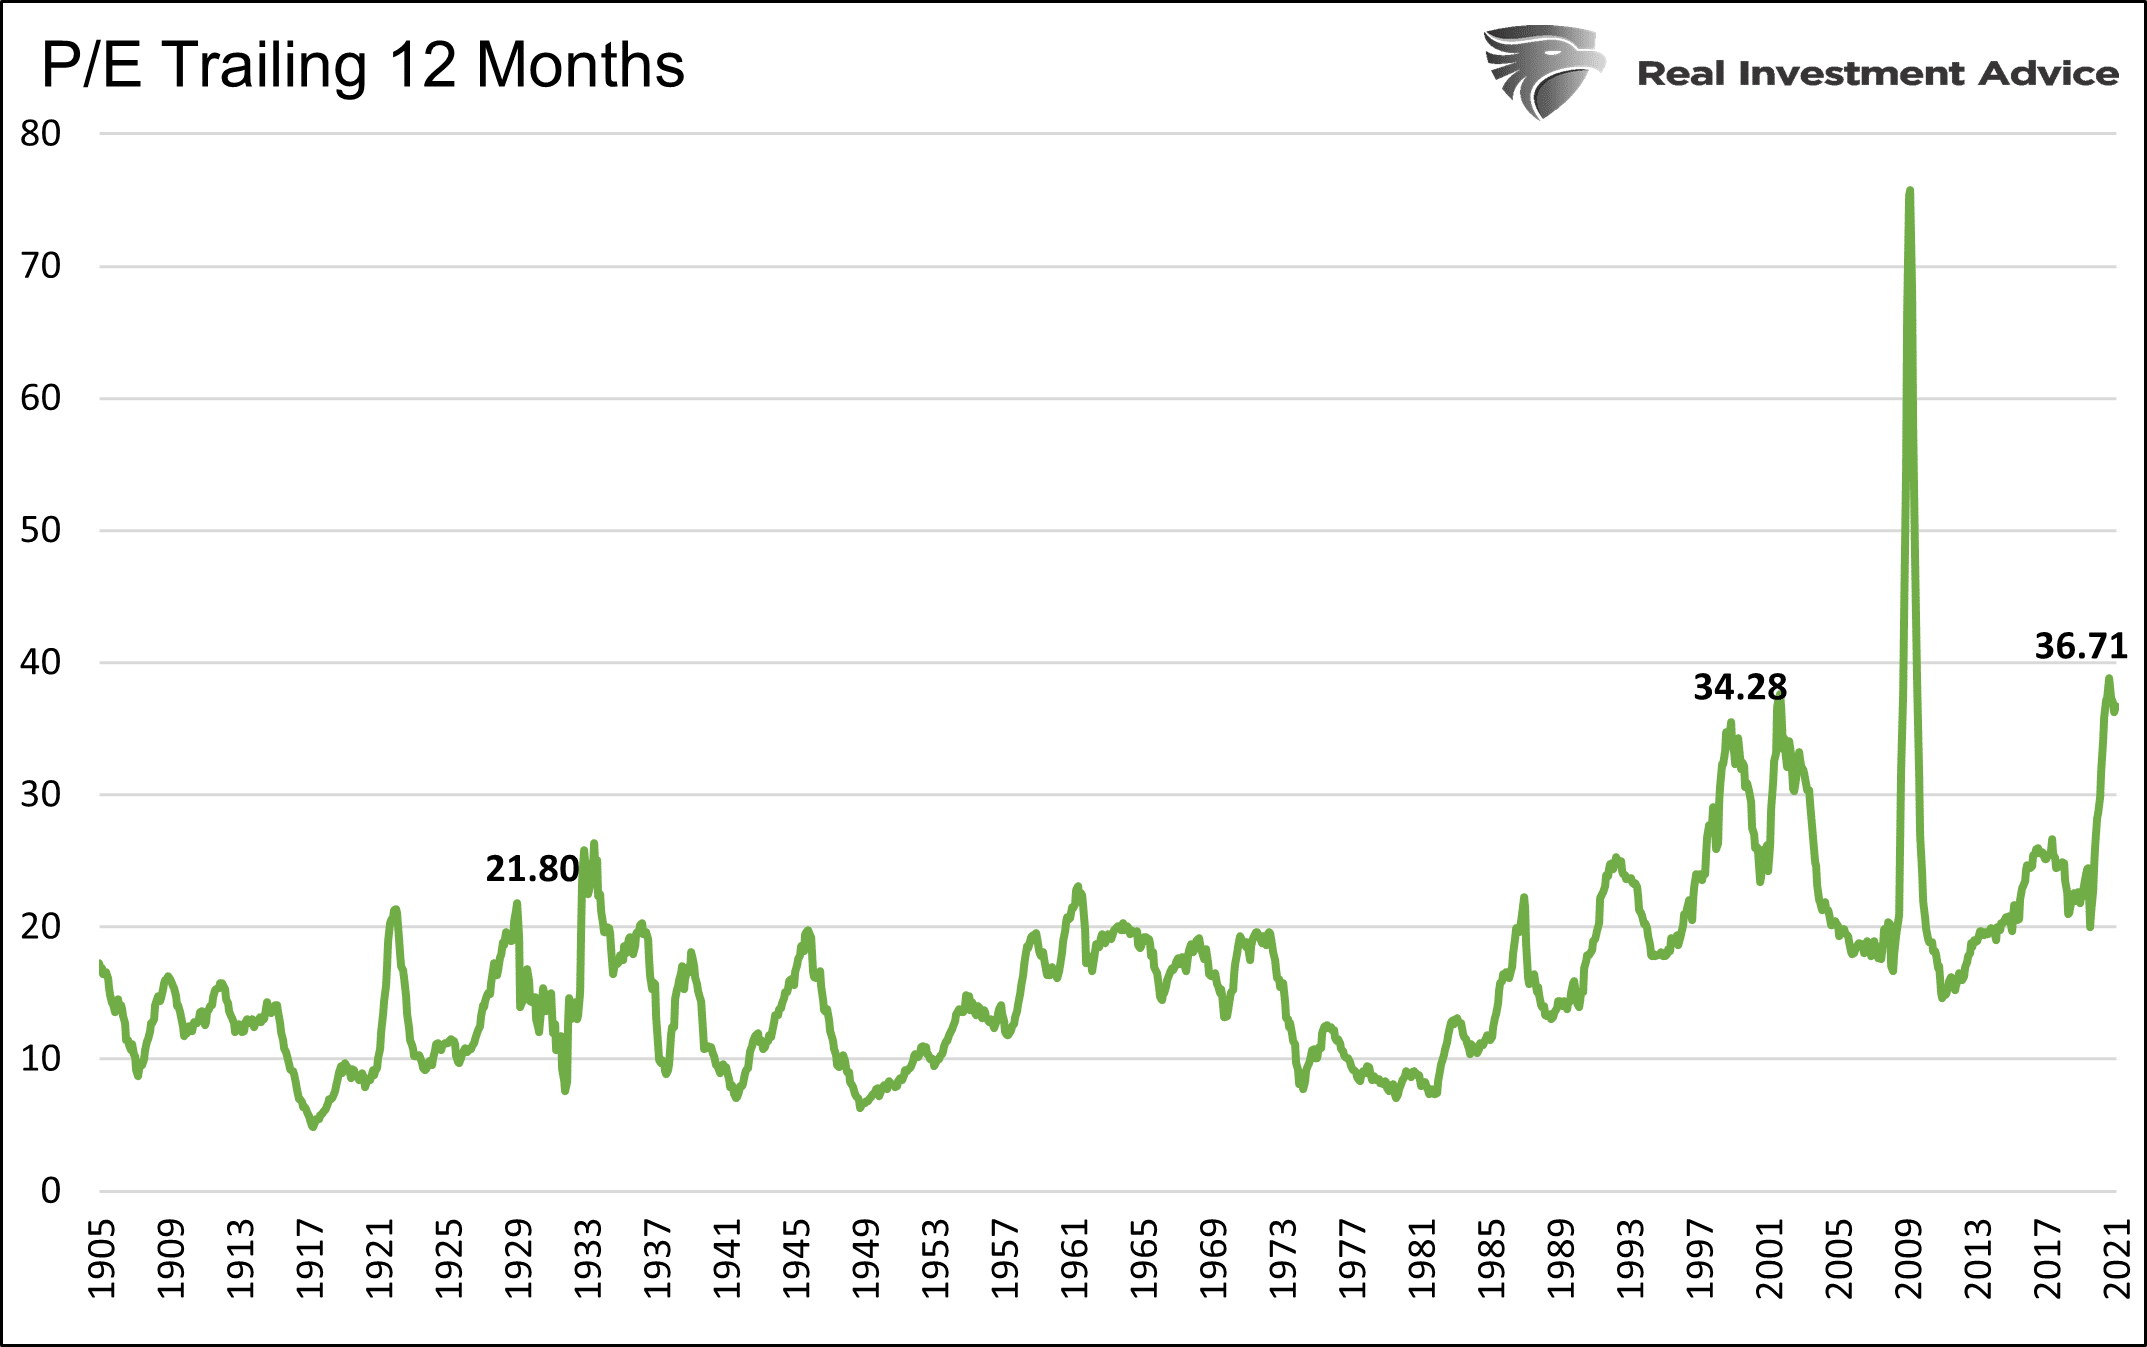
As shown below, as we have highlighted in many articles, valuations are at or near record levels. While nothing limits valuations from rising further, we must consider a reversion to the mean in many cases can result in losses of greater than 40%.
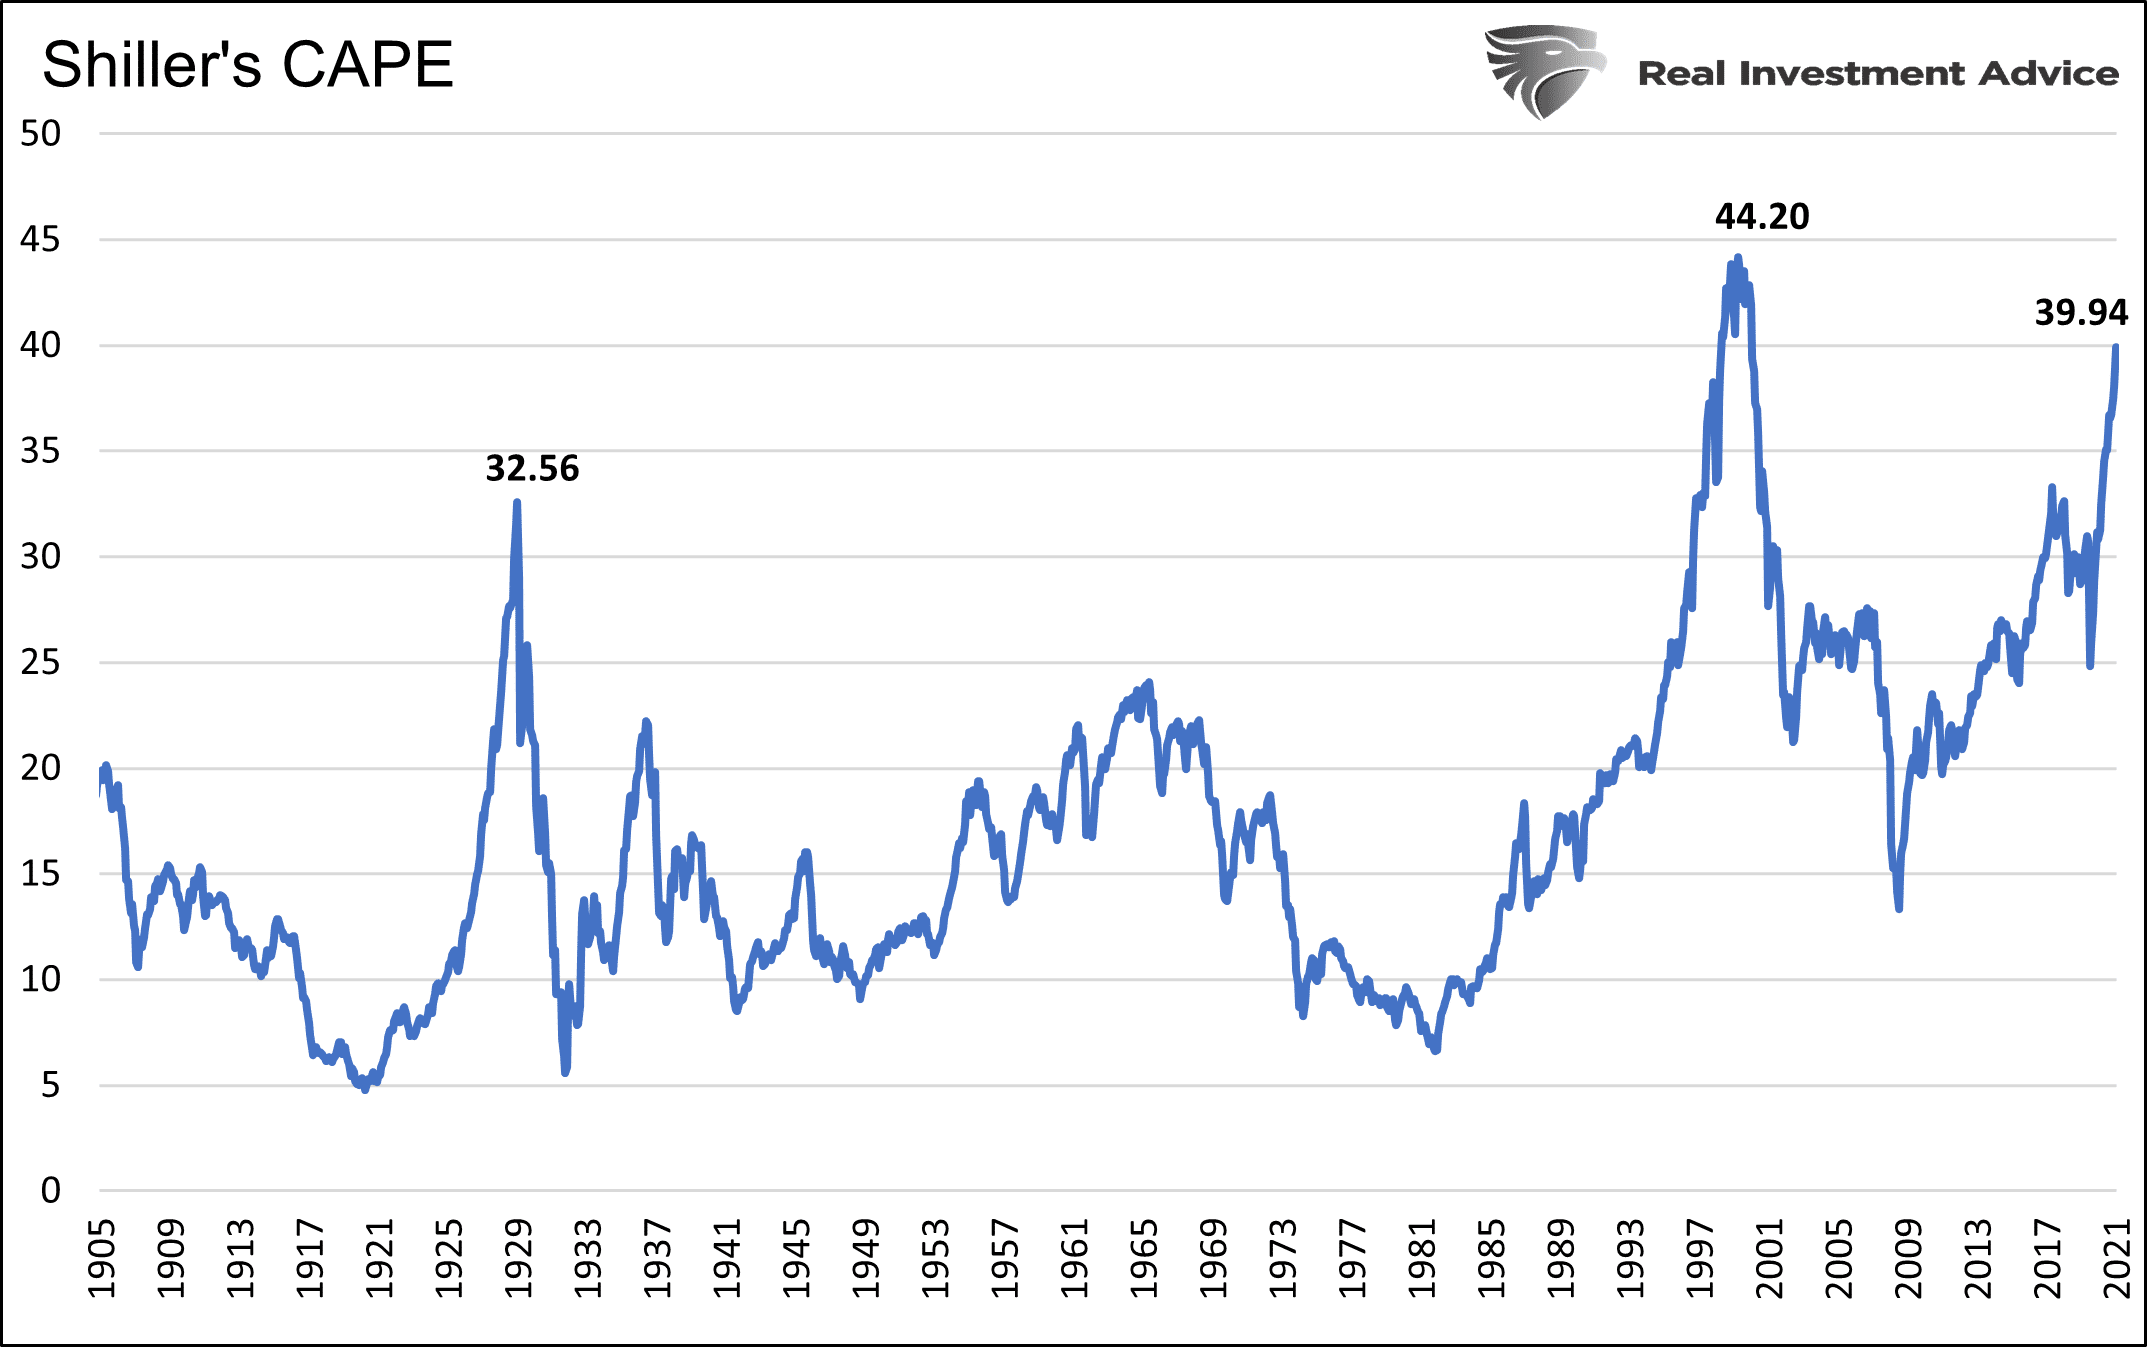
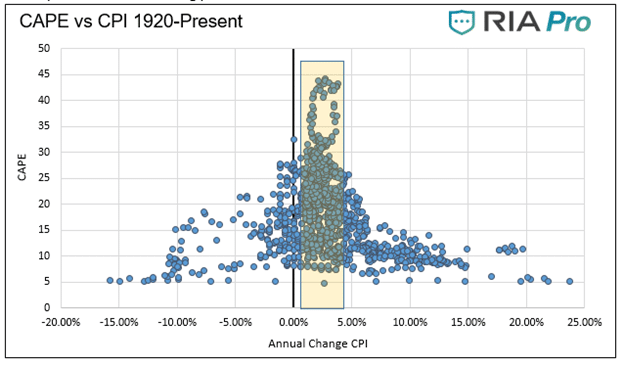
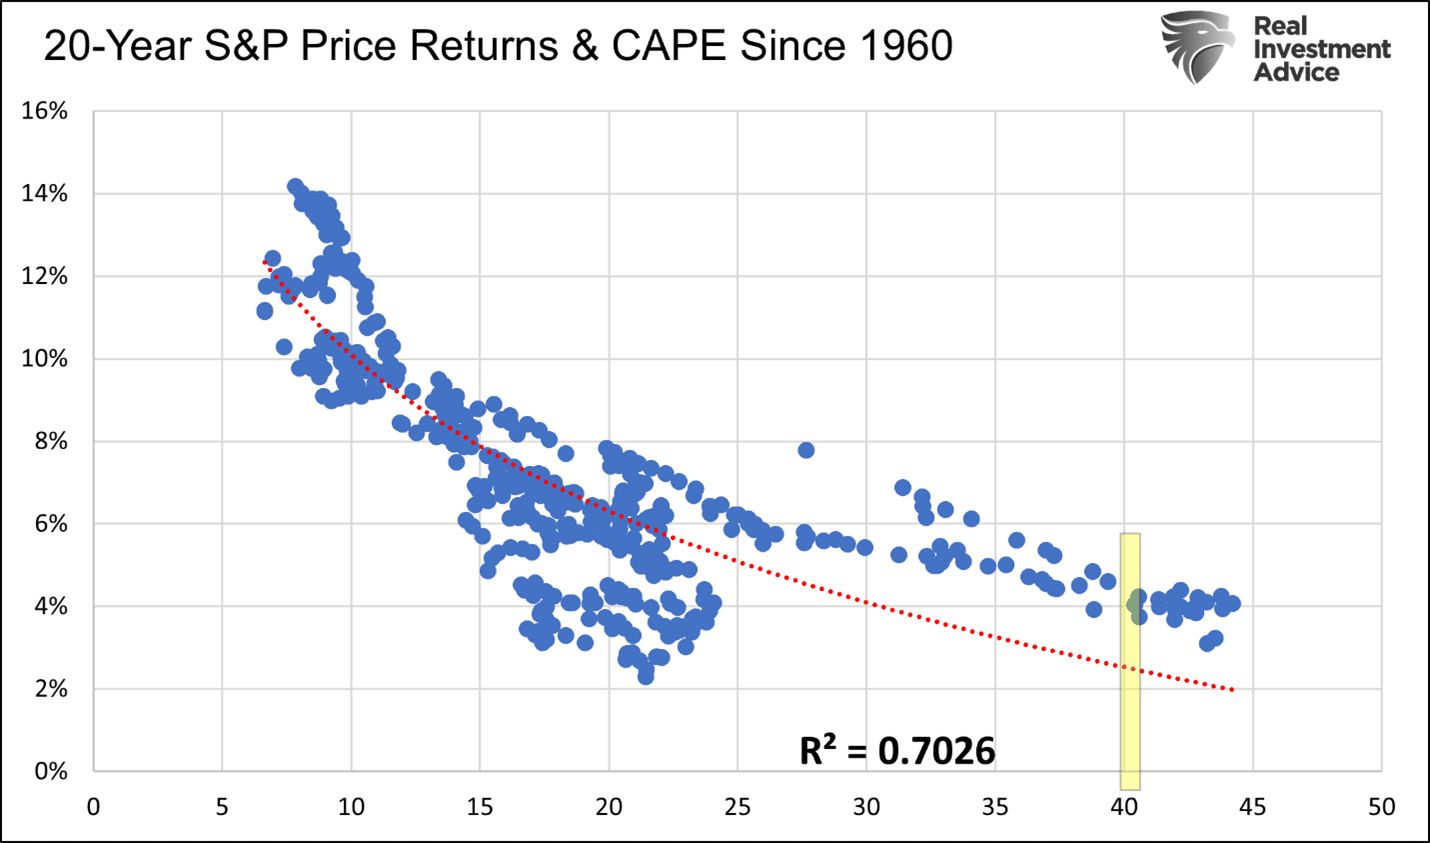
Complicating the valuation story is inflation. The graph below shows that historically periods of low inflation or deflation or inflation running greater than 5% are accompanied by CAPE readings of 25 or less. The current reading is 40.
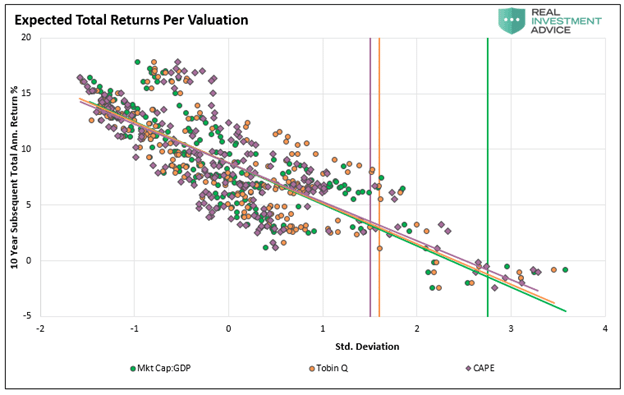
The graph below uses three popular valuation techniques to quantify longer-term future returns. Based on the data, the ten-year outlook is for low single-digit returns at best. The second graph uses CAPE in a similar fashion to show the 20-year outlook is not much better. While our analysis may seem bearish, we reiterate that nothing says valuations cannot continue to stretch further.
Profit Margins
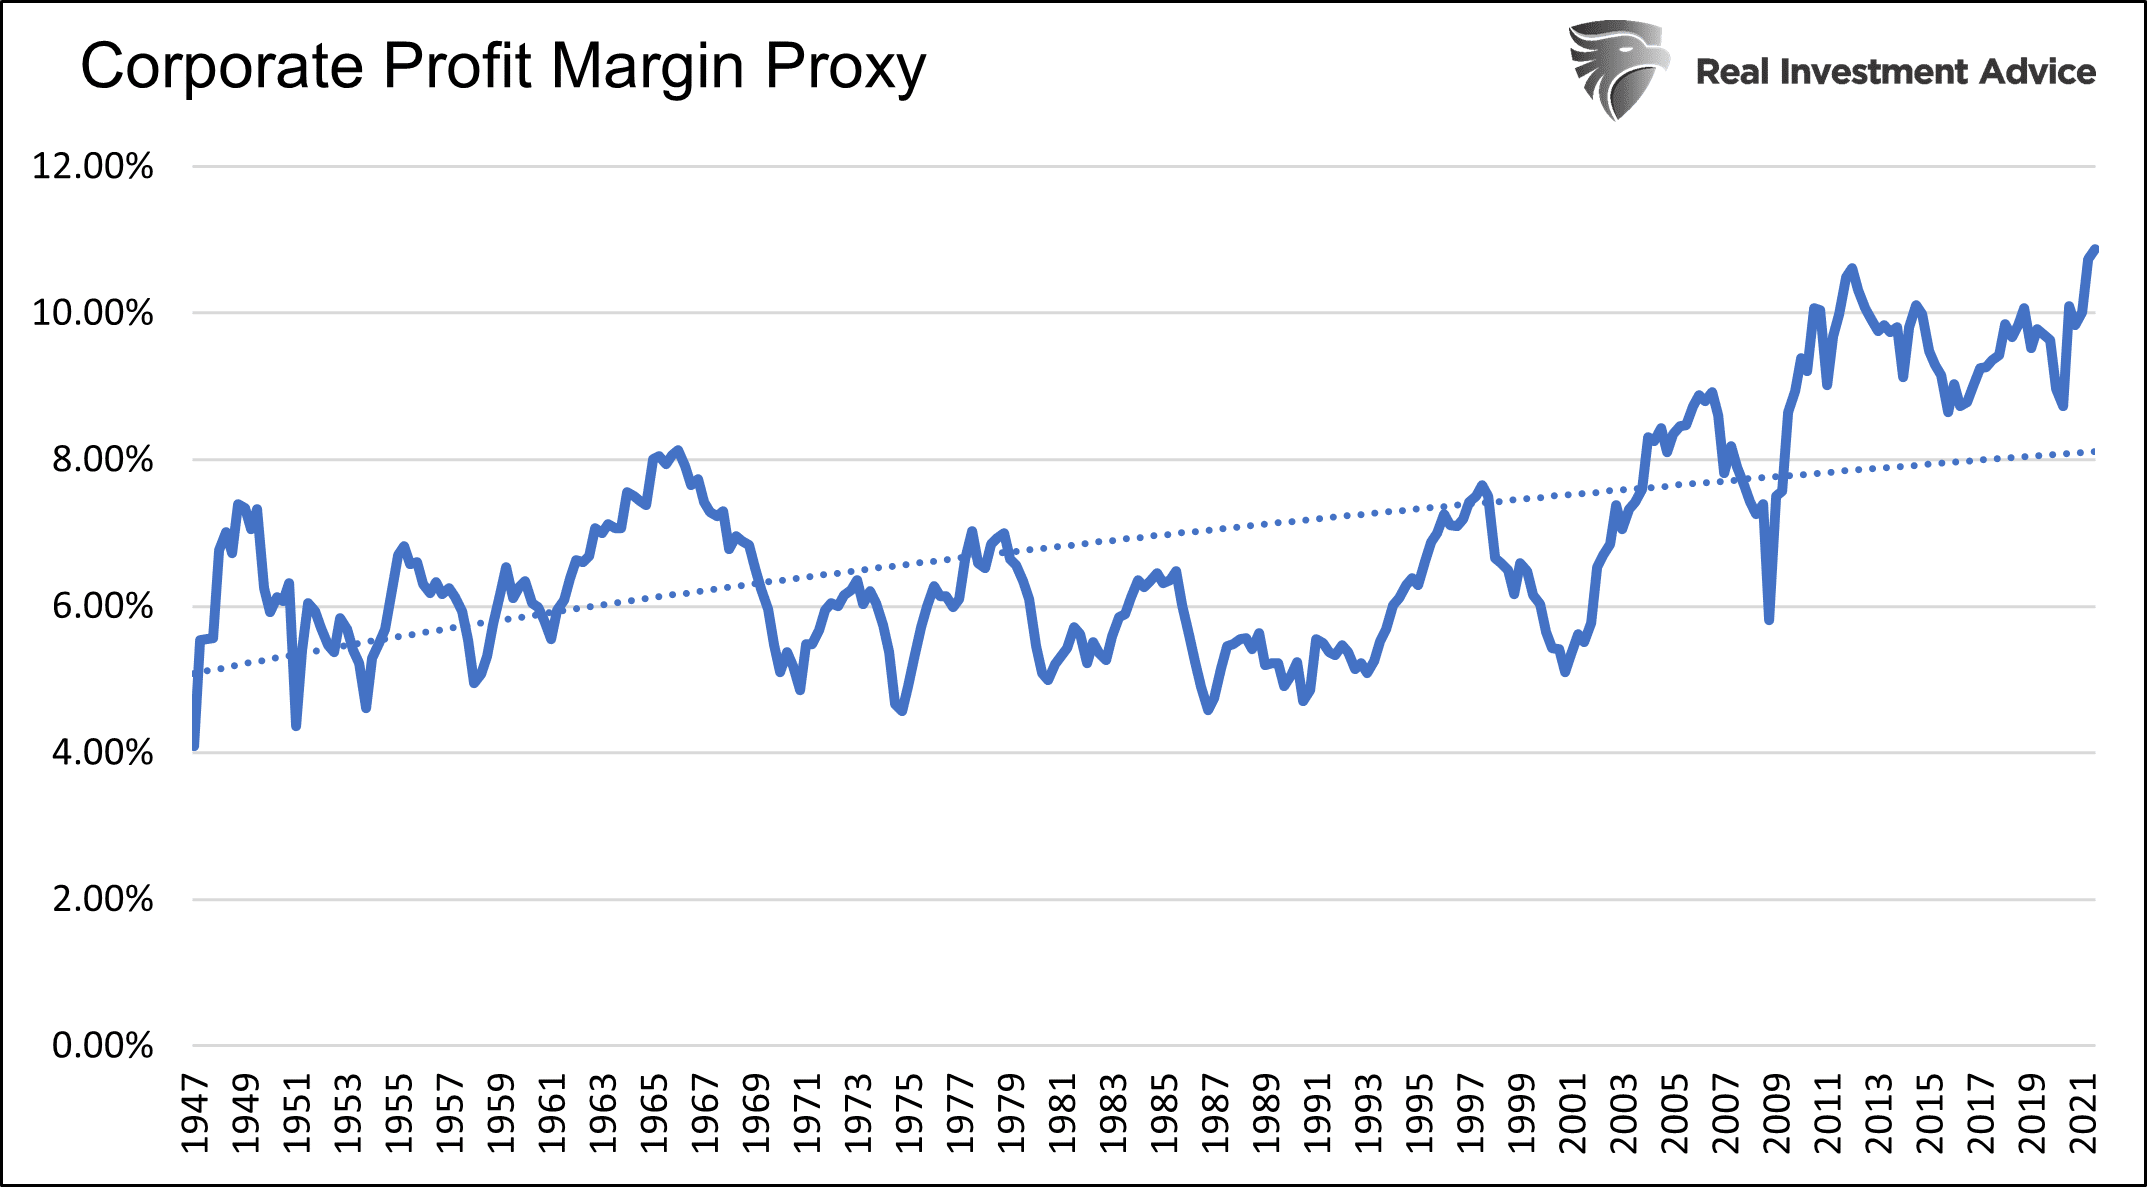
Corporate profit margins rose to record levels in 2021. Many companies were able to push higher costs onto consumers. At the same time, they were the ultimate beneficiaries of excessive government spending.
As we show below, corporate profits as a percentage of GDP are at the peak of the last decade and well above the 60-year trend leading to the financial crisis. A reversion back to the trend line would result in a 3% decline in profit margins. It is worth considering profit margins tend to revert to and through the trend line. A reversion back to the lows of 2009 and 2002 portends a 50% cut into profit margins. With valuations already at extremes, profit weakness would not support lofty expectations.

The Tail Wagging The Dog- Stock Options
This is where the analysis gets tricky. The graph below from Goldman Sachs shows more volume trading in stock options than the underlying stocks. Options are inherently highly leveraged and volatile. As the amount of options grows versus the shares outstanding, options become the tail wagging the dog.
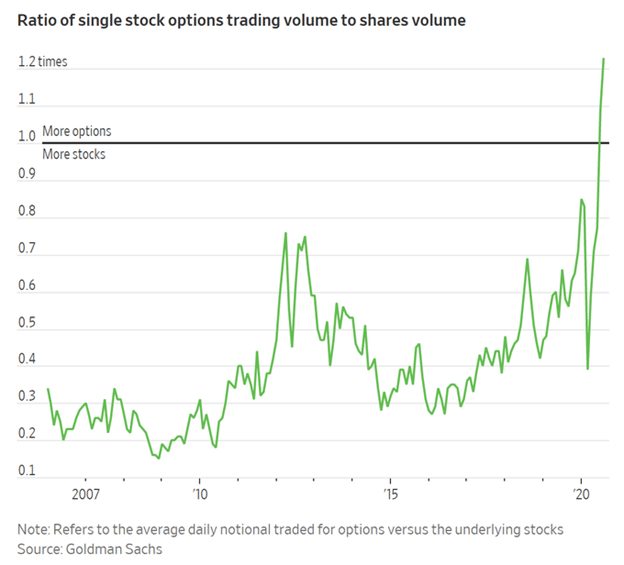
As we learned over the last two years, dealer hedging of options positions can result in great rallies. Conversely, as we watched in the second half of 2021, the options expiration period was not an investor’s best friend.
Forecasting how options trading might affect stock prices is nearly impossible for a 2022 investment outlook. That said, options have and will continue to influence the market significantly.
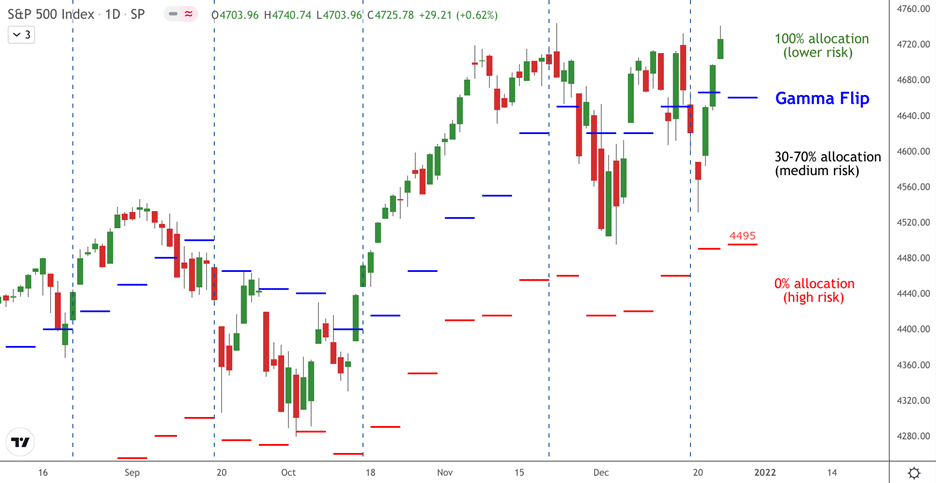
One way to track potential volatility is with Gamma flip levels. Gamma helps us understand how dealers hedge options and react by buying or selling the underlying stocks to maintain hedges. SimpleVisor subscribers receive Viking Analytics weekly Gamma Band Update to help them with this task. The graph below from a recent edition shows recommended allocations based on the Gamma of S&P 500 options.

2022 Investment Outlook for Bonds
The outlook for bonds is equally tricky. If you had asked most bond traders a year ago where they thought bond yields would be if inflation approached 7%, most would have said much higher than current levels.
Inflation and Growth Drive Bond Yields
The graph below from Longview Economics show bond yields are abnormally low given the level of inflation. Per the historical relationship between 10-year UST yields and inflation, the 10-year yield should be 4-7%.
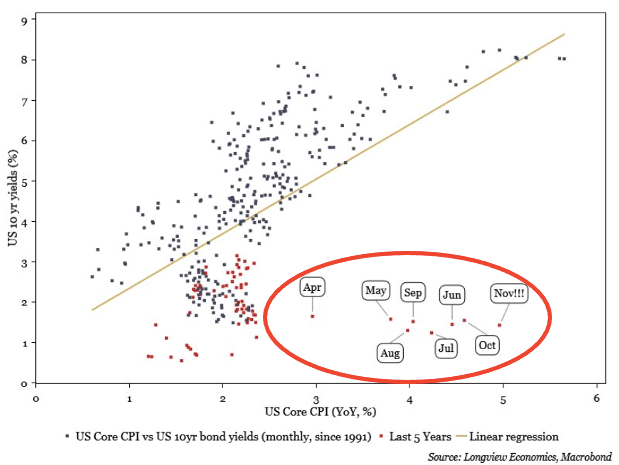
To help explain this anomaly, we must consider that bond traders tend to look at inflation beyond a year or two when determining value. Low expected inflation or deflation helps justify negative real yields today. Currently, TIPs markets imply 2.48% inflation for the next ten years. Bond traders must be confident inflation is transitory. If persistently high inflation becomes more likely, bond yields could rise quickly.
Economic growth over the next ten years is likely to be 2% or lower based on productivity and demographic trends. The Fed’s long-range forecast is 1.6-2.2%. The graph below shows the trends for GDP, and yields have been lower for the last 40 years. Note the declining yield trend is steeper than GDP. Some of this is due to the Fed’s influence on rates.

The Fed
As noted in Part 1 of the 2022 Investment outlook, the Fed has been buying nearly 100% of what the Treasury is issuing. To wit- “the Fed has bought nearly $5 trillion of bonds since the pandemic began. In doing so, it came close to absorbing 100% of the net new debt issuance from the government.”
Banks Are Flush With Cash
The graphs below help explain a third important factor keeping yields low. The bottom chart shows deposits at commercial banks are growing much faster than banks are lending money. The banks need to invest deposits, and since they are not lending them out, they frequently invest in U.S. Treasury securities. The upper graph shows the statistically strong correlation (R-squared .76) between the ratio of loans and leases to deposits versus ten-year Treasury yields. Unless the banks are going to start significantly ramping up lending, which we doubt, expect current trends to continue, thus supporting low yields.

Lower Yields
We think inflation is in the process of peaking. Shortages and supply line problems are slowly diminishing. At the same time, demand is normalizing, and there is little fiscal stimulus on the horizon to boost demand further. We offer a big disclaimer. The current environment is anything but typical. While we think inflation will ease, we are mindful that factors, such as rising wages may keep it elevated.
Yields have trended lower for the past 30 years, following economic growth. We think those trends continue in the year ahead.
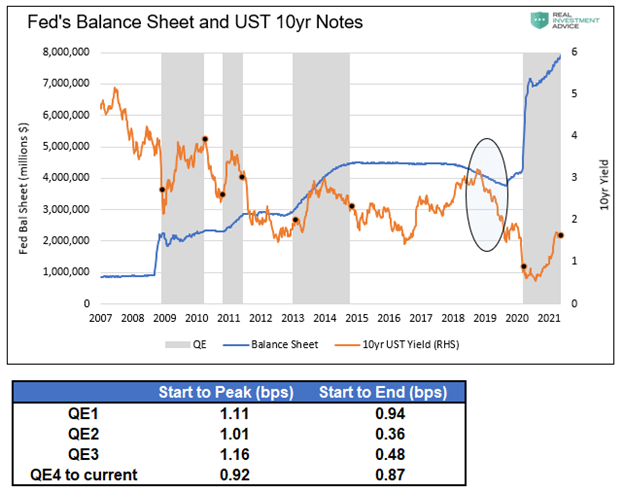
Some will counter that if the Fed is not buying bonds who will? We do not know, but as we conclude in Taper is Coming: Got Bonds?: “Currently, yields are close to their cycle highs. If we believe the Fed is nearing tapering, yields could be peaking. Based on prior QE taper experiences, a yield decline of 1% or even more may be in store for the next six months to a year if the Fed is, in fact, on the doorsteps of tapering.”
The graph below from the article shows yields tend to fall after periods of QE and when they are reducing their balance sheet (QT) as circled. QT is currently being discussed by Fed members per the two headlines below.
- BOSTIC SAYS FED COULD EASILY PULL $1.5 TRILLION OF “EXCESS LIQUIDITY” FROM FINANCIAL SYSTEM, THEN WATCH MARKET REACTION FOR FURTHER BALANCE SHEET REDUCTIONS
- MESTER: ABLE TO LET BAL SHEET TO RUN DOWN FASTER THAN LAST TIME

An ISM Reading That May Make You Rethink Your Stock/Bond Allocations
In a recent daily Commentary we wrote the following. This quick note provides another reason yields may fall in the coming months.
The ISM Manufacturing Index was below expectations at 58.7, an 11-month low. Notably, the prices paid index fell sharply from 82.4 to 68.2, and supplier delivery times fell to a four-month low. The data provide signals that inflationary pressures are fading, at least for the time being.
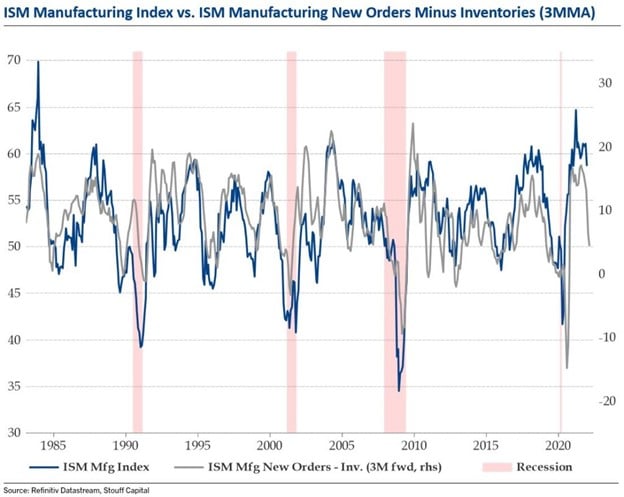
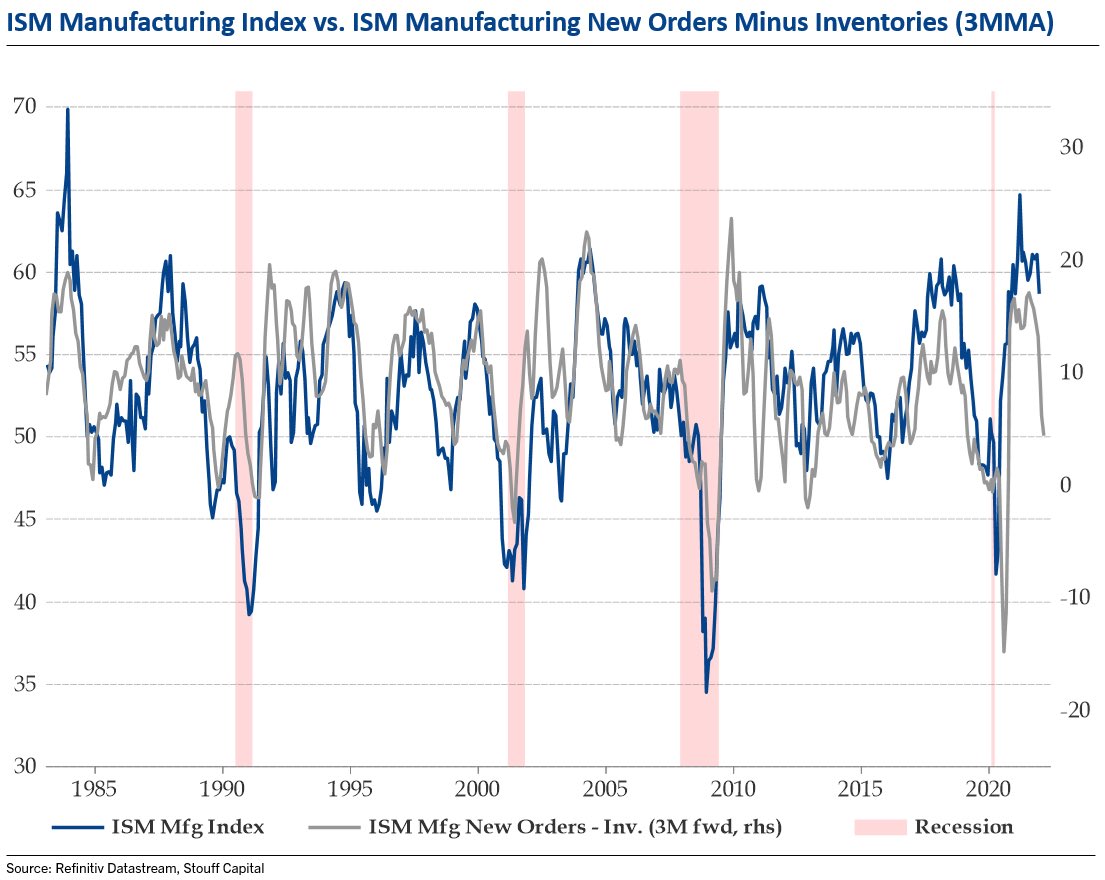
The first graph below, from Stouff Capital, shows the strong correlation between the difference of new orders and inventories compared to the ISM Index. The differential leads the ISM index by three months. If the correlation holds up, we should see a steep decline in ISM in the coming three months.
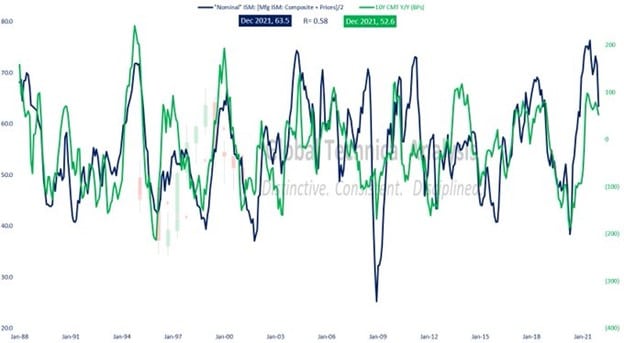
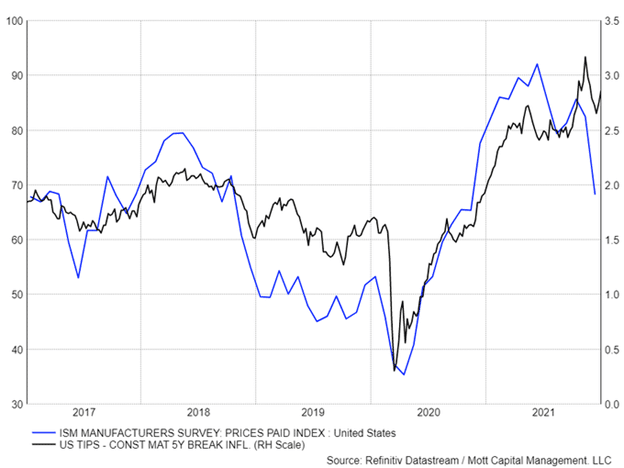
The following two graphs show how ISM’s decline may affect bond yields. The first graph below, courtesy of Brett Freeze, shows a statistically strong correlation between nominal ISM (inflation-adjusted) and ten-year UST yields. If the nominal ISM is reversing as it appears, we should expect lower yields. The second graph, courtesy of Mott Capital, charts the correlation of the ISM Prices paid index and inflation expectations. Assuming manufacturing inflation is finally cooling off, inflation expectations should follow. Lower inflation expectations will help reduce bond yields.
Rotations Matter
In 2021, the key to success was understanding when inflationary narratives would dictate market conditions and when deflation narratives drove investors. We do not think 2022 will be as simple.
It is quite possible that value versus growth and low beta versus high beta may be the rotations to key on. As we wrote in An Investment Playbook for Thriving During the Next Market Crash:
“We think it’s likely that value stocks will significantly outperform growth stocks in the event of a sizeable drawdown. Timing the transition from growth to value will be difficult, but such a rotation will likely prove invaluable. You may want to keep the 2000 investment playbook handy.”
Summary
If we learned anything from 2020, the future is far from certain. Not only should we expect the unexpected, but the market reactions to the unexpected may be vastly different than what many assume.
What we discuss above is our best guess as of today. We may be right in some areas and wrong in others. More importantly, we must adjust our expectations as political, economic, and monetary conditions and investor sentiment change.
Navigating 2021 in hindsight was easy. However, a year ago, the outlook was daunting. No doubt 2022 will offer us both risk and rewards. Limiting risks and reaping the rewards will help traverse what offers to be another tricky year.
Maybe, more importantly, relying on trusted economic and market models and not letting psychological biases hinder investment decisions may prove to be the best advice we can offer.


Michael Lebowitz, CFA is an Investment Analyst and Portfolio Manager for RIA Advisors. specializing in macroeconomic research, valuations, asset allocation, and risk management. RIA Contributing Editor and Research Director. CFA is an Investment Analyst and Portfolio Manager; Co-founder of 720 Global Research.
Follow Michael on Twitter or go to 720global.com for more research and analysis.
Customer Relationship Summary (Form CRS)
Also Read


