


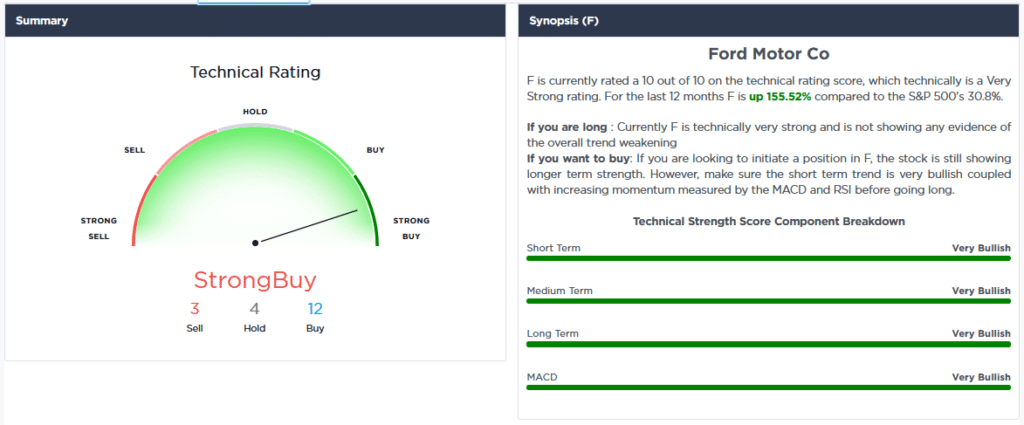
Ford (F) is following Tesla’s path. Tesla shares surged on Monday after they released strong delivery numbers over the weekend. Following in Tesla’s footsteps, Ford is up over 10% on Tuesday after they announced it would nearly double the annual production of the all-electric F-150 Lightning truck. Ford currently has a market cap of about 1/10th that of Tesla despite almost 4x the revenue. It does, however, have significantly more debt than Tesla. Ford has a P/B ratio of 2.61 and P/S of .71. In contrast, Tesla has a P/B of 42.11 and a P/S of 24.33. If Ford can become an EV powerhouse, the valuations of the other pure EV automakers argue F has a lot more upside.

What To Watch Today
Economy
- 7:00 a.m. ET: MBA Mortgage Applications, week ended Dec. 31 (-0.6% during prior week)
- 8:15 a.m. ET: ADP Employment Change, December (410,000 expected, 534,000 during prior month)
- 9:45 a.m. ET: Markit US Composite PMI, December final (56.9 prior month)
- 9:45 a.m. ET: Markit US Services PMI, December final (57.5 expected, 57.5 prior month)
- 2:00 p.m. ET: FOMC Meeting Minutes, December 15
Earnings
- No notable reports scheduled for release
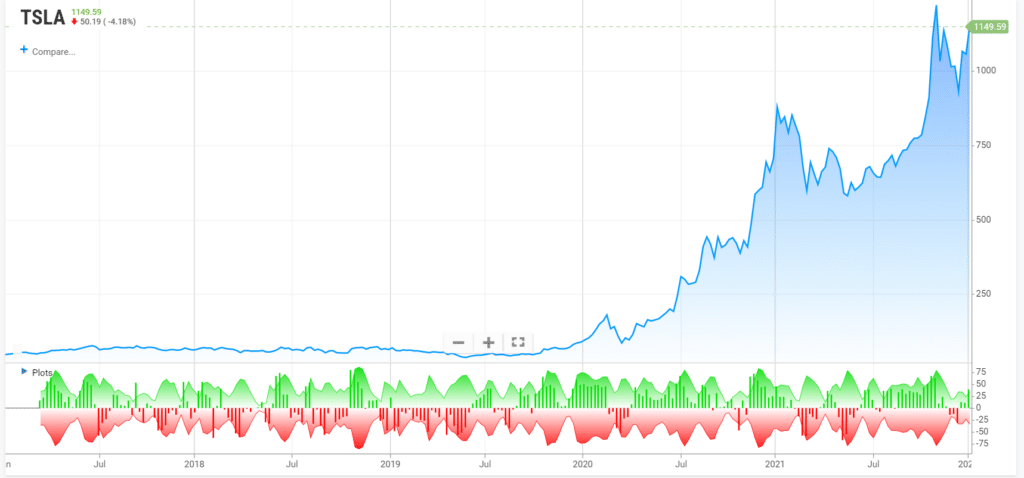
Speaking Of Tesla
Yesterday commentators and the analyst community waxed enthusiastically about Tesla’s delivery beat in the quarter ended December 31, 2021.
Tesla sold about 30k more cars than expected. At $50k/unit and assuming the company made 10% net after tax this would result in about $150 million in “extra” after tax profits in the fourth quarter.
For a rough perspective on how absurd the $150 billion rise in Tesla’s market cap was yesterday – it represented 1000x the gain of $150 million of “extra” profits relative to consensus.” – Doug Kass
JOLTs
The JOLTs data for November shows the jobs market may be finally cooling off. The number of job openings fell from 11.033 million to 10.562 million. Conversely, the number of quits rose to a new record of 4.5 million. Over half of the 370k increase in quits from the prior month came from the accommodation and food services industries. A high quit rate is due to workers believing they can quit and get a new higher-paying job. Such activity pressures wage expenses and will likely weigh to some degree of corporate profit margins.
An ISM Reading That May Make You Rethink Your Stock/Bond Allocations
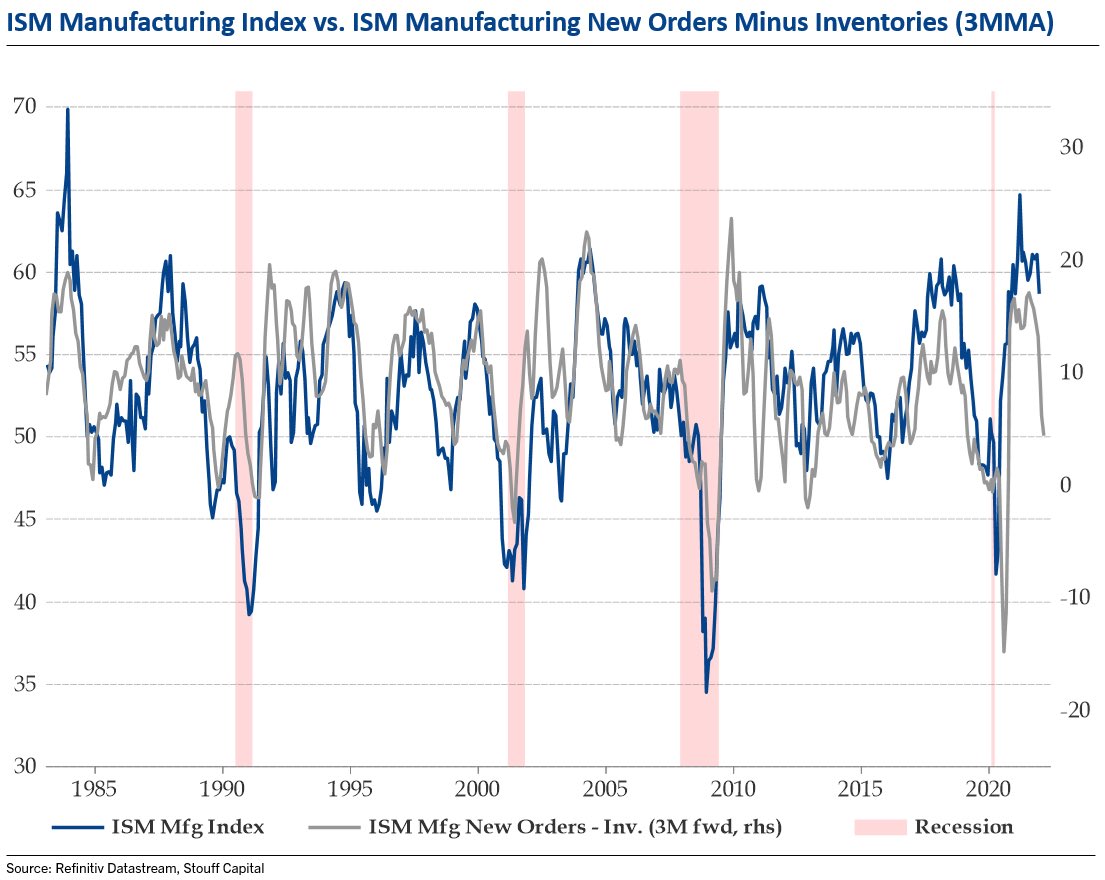
The ISM Manufacturing Index was below expectations at 58.7, an 11 month low. Notably, the prices paid index fell sharply from 82.4 to 68.2, and supplier delivery times fell to a four-month low. The data provide signals that inflationary pressures are fading, at least for the time being.
The first graph below, from Stouff Capital, shows the strong correlation between the difference of new orders and inventories compared to the ISM Index. The differential leads the ISM index by three months. If the correlation holds up, we should see a steep decline in ISM in the coming three months.
The following two graphs show us how ISM’s decline may affect bond yields. The first graph below, courtesy of Brett Freeze, shows a statistically strong correlation between nominal ISM (inflation-adjusted) and ten-year UST yields. If the nominal ISM is reversing as it appears, we should expect lower yields. The second graph, courtesy of Mott Capital, charts the correlation of the ISM Prices paid index and inflation expectations. Assuming manufacturing inflation is finally cooling off, inflation expectations should follow. Lower inflation expectations will help reduce bond yields.


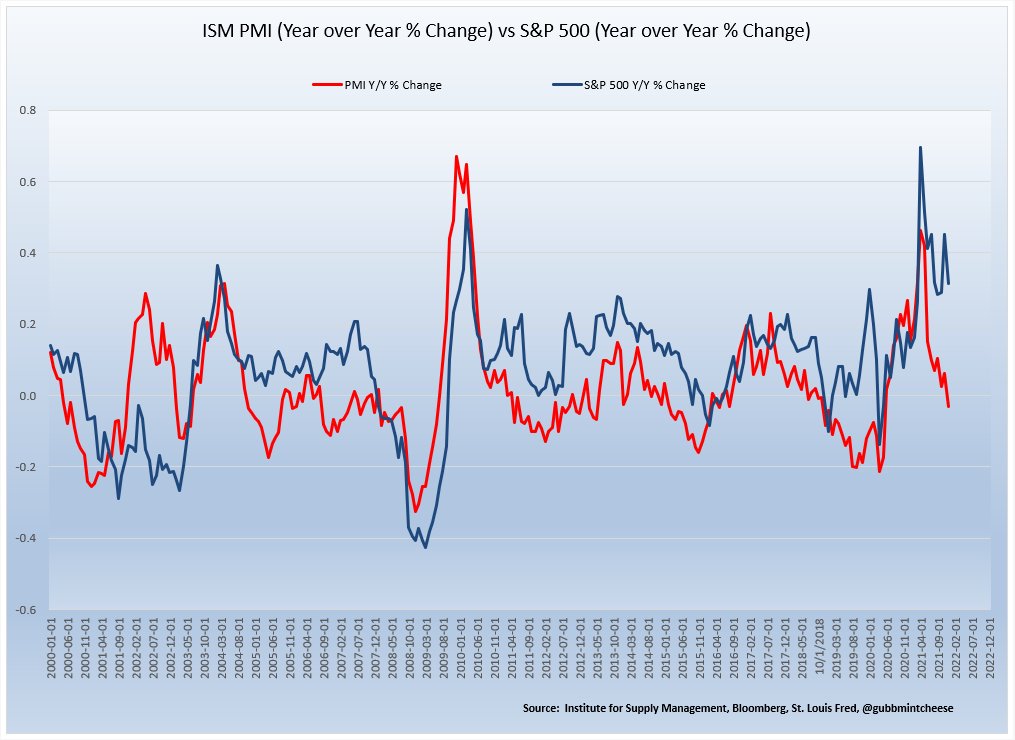
ISM and Stocks
Not to beat a dead horse, but as we show below, a weak ISM Index is not good for stock prices.
Is The Fed Hinting At QT?
Nick Timiraos, who covers the Fed for the Wall Street Journal, is often the source of trial balloons from the Fed. Often, when the Fed is considering a new program or changes to a program, they will leak it to the press. The purpose is to gauge the market response. On Tuesday morning, the WSJ published Fed Weighs Proposals for Eventual Reduction in Bond Holdings. The article broaches what the Fed will do when they finish tapering bond purchases. Per the article:
“Federal Reserve officials are beginning to map out how and when they could shrink their $8.76 trillion portfolio of Treasury and mortgage securities, which more than doubled amid efforts to stabilize the economy over the past two years.”
Tapering QE provides less liquidity to the market. Quantitative tightening (QT) removes liquidity. Given the financial market’s heavy reliance on Fed liquidity, the topic will prove to be sensitive. If the Fed is genuinely considering QT as a way to quell inflation further, we suspect we will hear more about it in upcoming speeches.
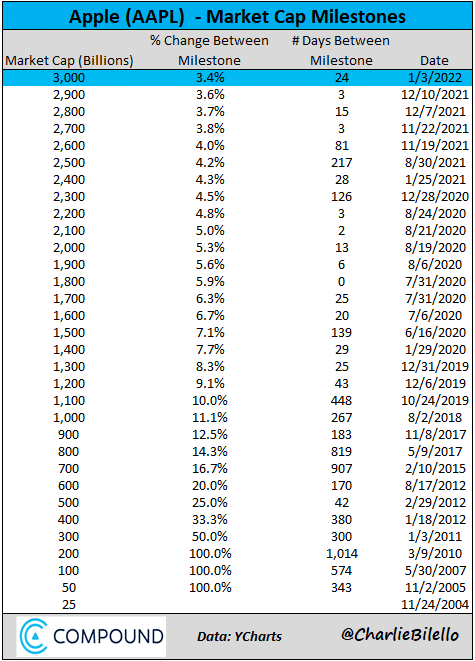
Apple
“Apple is worth $3 trillion — more than Walmart, Disney, Netflix, Nike, Exxon Mobil, Coca-Cola, McDonald’s, AT&T, Goldman Sachs, Boeing, IBM and Ford combined.” – New York Times
Please subscribe to the daily commentary to receive these updates every morning before the opening bell.
Also Read


