
- The Great Divide: A Depressionary Economy Versus A Bull Market
- MacroView: “Savings Mirage” Won’t Save The Economy
- Financial Planning Corner: The Great Reset (Webinar)
- Sector & Market Analysis
- 401k Plan Manager
Follow Us On: Twitter, Facebook, Linked-In, Sound Cloud, Seeking Alpha
Catch Up On What You Missed Last Week

The Great Divide
There is currently a “Great Divide” happening between the near “depressionary” economy versus a surging bull market in equities. Given the relationship between the two, they both can’t be right.

Depressionary Economy
As noted by Jay Denton from Thinkwhy:
“April’s job loss was the worst on record, and a continued climb in unemployment is likely over the next few months. ThinkWhy believes the impact on the labor market was very front-loaded, and the month-to-month totals for job loss should begin to moderate in May.”
- Non-farm payrolls decreased by 20.5 million in April
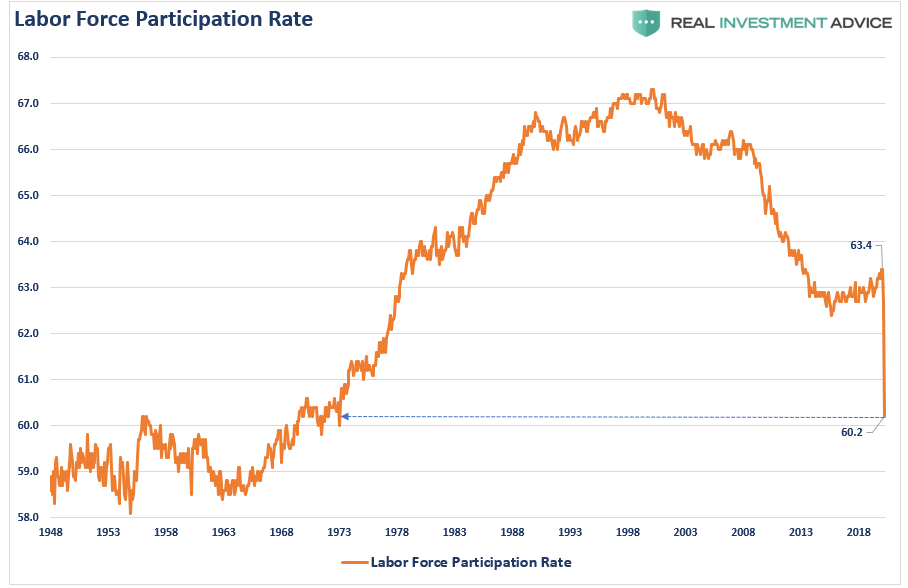
- Labor force participation decreased to 60.2%
- Leisure and Hospitality jobs took the brunt of job losses at -7.653 million
- Combined February and March revisions were down by 214,000 jobs
- 32% of teenagers reported as unemployed
- 16.7% of Blacks and 18.9% of Hispanics reported as unemployed
- Persons marginally attached to the labor force – those not in the labor force who currently want a job – numbered 2.3 million in April, up by 855,000 from last month
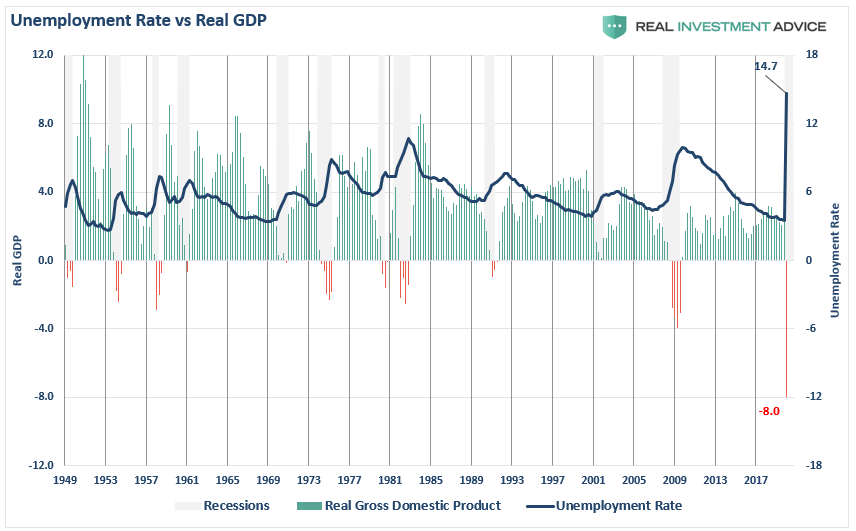
Here are a couple of charts for context to the magnitude of the decline.
Given the BEA will revise Q1-GDP towards -8%, and Q2 is estimated at nearly -20%, the unemployment rate of 14.7% will rise towards 20% in May’s report. These are numbers not seen since the “Great Depression,” and never seen in the official BEA data going back to 1948.
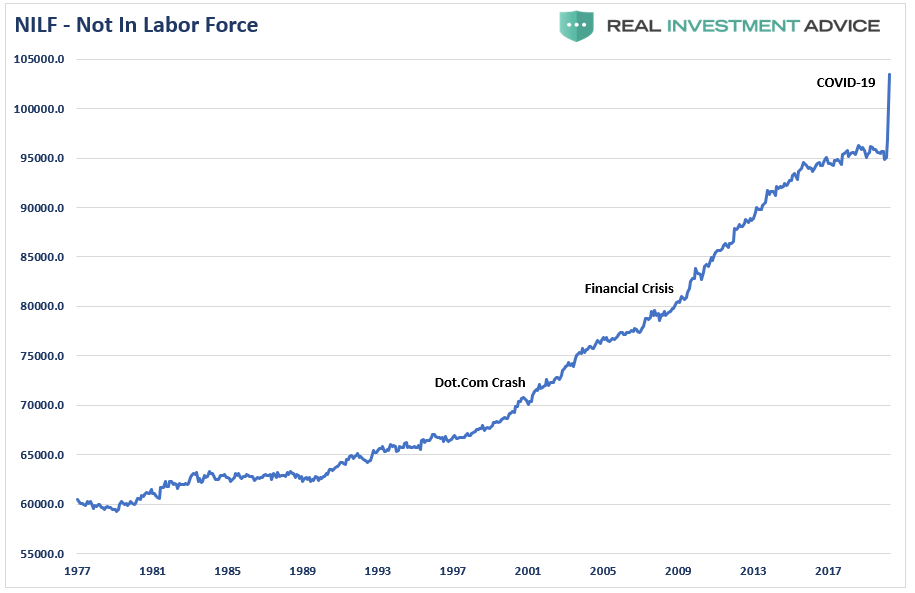
Labor Force Non-Participation
The participation in the labor force has dropped to levels not seen since 1973, and is a key measure to watch. Since the “Financial Crisis,” the participation in the “Labor Force” never significantly rose despite “record low unemployment rates.” Such is because the labor force was shrinking sharply over the last decade as more and more participants were simply “no longer counted.”
Those “Not In Labor Force” has surged sharply over the last month. These are individuals that are considered out of the labor force and no longer seeking employment.
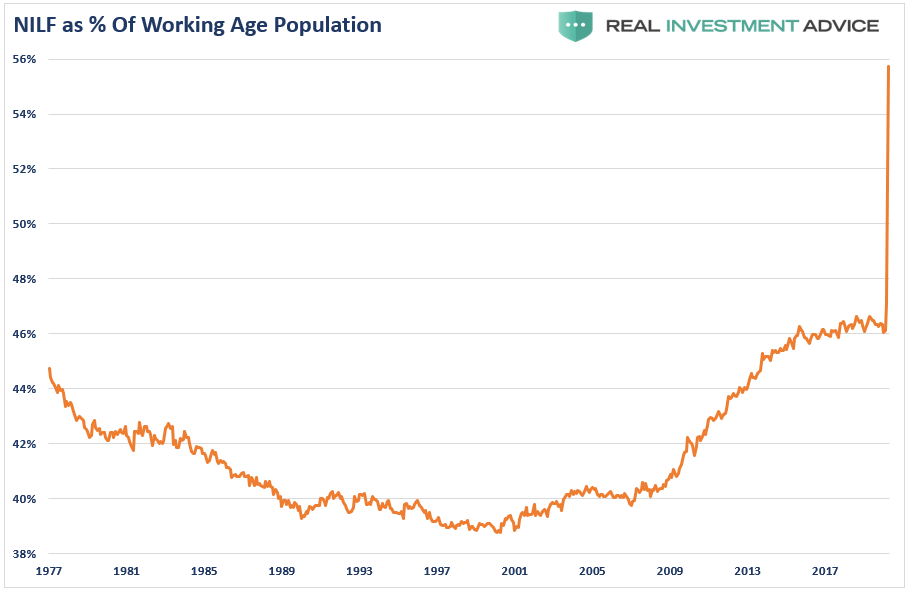
Do you really believe that nearly 56% of the working-age population are no longer looking for work?

Wages Are Key
As we noted in our #MacroView below:
“The impact on the economy from record levels of unemployment is going to have a wide range of impacts which will forestall an economic recovery. The first, of course, is a deep suppression of wage growth, which comes from both recessionary drags and job losses.”
This data is just through the end of MARCH, with only two weeks of the shutdown accounted for. The decline in wage & salary disbursements with 20-million unemployed will far surpass the “Financial Crisis” lows in the April data.
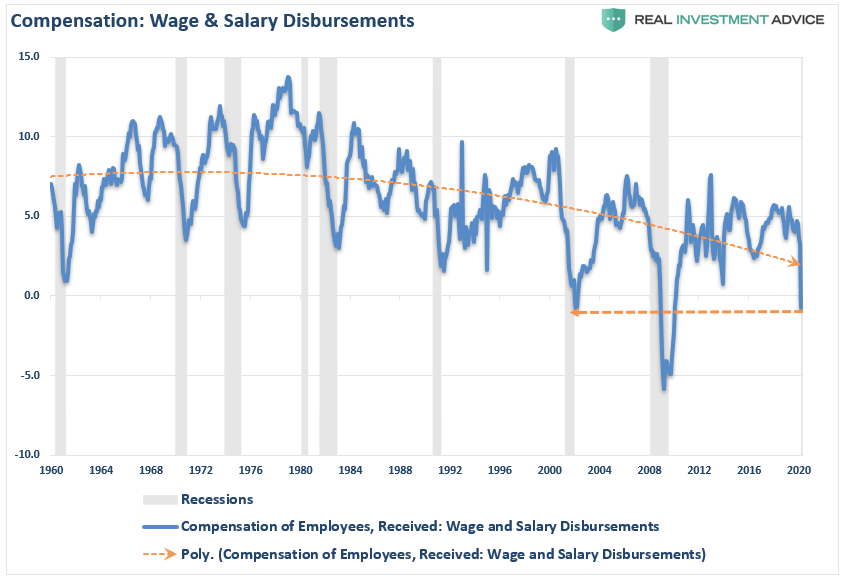
Note the long-term trend in wages and salaries since 1980. Such is why we fail to attain higher rates of economic growth when it is 70% based on consumption.
There will be no “V-shaped” economic recovery.
Bull Market Ignores It All
The juxtaposition between economic data and the “bull market” in stocks is quite astonishing.
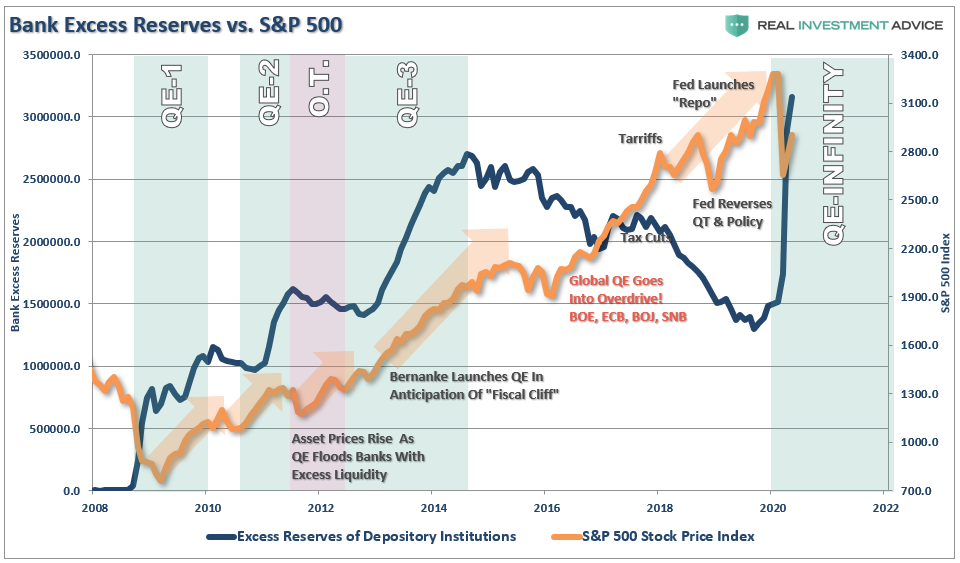
We tend to agree with BMO (Courtesy Of Zerohedge) on the underlying reasoning:
“Using this week’s price action thus far as a guide, the biggest drivers have been the reality of ballooning Treasury issuance which has steepened the curve and the specter of negative policy rates in 2021 that has led the belly to outperform while pushing 2-year yields to record lows.”
In other words, to no one’s real surprise, the driver of the market is simply “The Fed.” As the Fed engages in “QE,” it increases the “excess reserves” of banks. Since banks are NOT lending to consumers or businesses, that excess liquidity flows into the stock market.
As TPA noted on Friday for our RIAPro Subscribers (30-Day Risk-Free Trial)
“As bad as the economy is, stocks can only go lower if people sell and the subsequent liquidations take place. The asset management industry is overwhelmingly run by managers whose mandate is to remain invested in stocks.
There is over $100 trillion managed worldwide. The top 2 managers in the world are Blackrock and Vanguard. Blackrock manages most of the ETFs, and Vanguard is the largest index fund.”
Guess who runs the programs for the Federal Reserve and the Treasury? Blackrock.
If you want to chase risk currently, the advice is pretty simple.
So far, we have not seen massive liquidations and until we do, investment managers will do their jobs and stay invested in stocks. We are advising clients to keep a watchful eye trained for liquidations as a signal that the market will test new lows.” – TPA

Bull Market Vs. Depression Economy
Currently, the economic destruction is playing out in real-time with expectations it will quickly reverse. I highly suspect it won’t. As we noted last week:
“There is a negative feedback loop between employment and consumption. As unemployment rises, consumption falls due to a lack of income. Since businesses operate based on demand for goods and services, the correlation between PCE, fixed investment, and employment are high.”
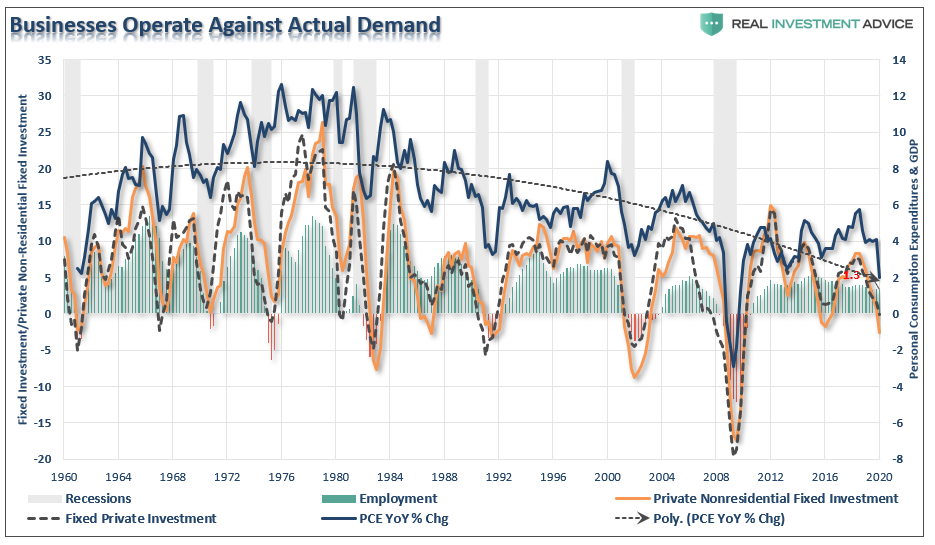
“Despite the reopening of the economy, businesses will not immediately return to full operational activity, until consumption returns to more normal levels. Such a recovery is likely going to frustrate policy-makers and the Fed.”
It isn’t just the economic data that is going to be horrid over the next few months, but earnings will likely be just as bad. Earnings can not live in isolation from the economy. As shown below, corporate profits ebb and flow with economic activity.
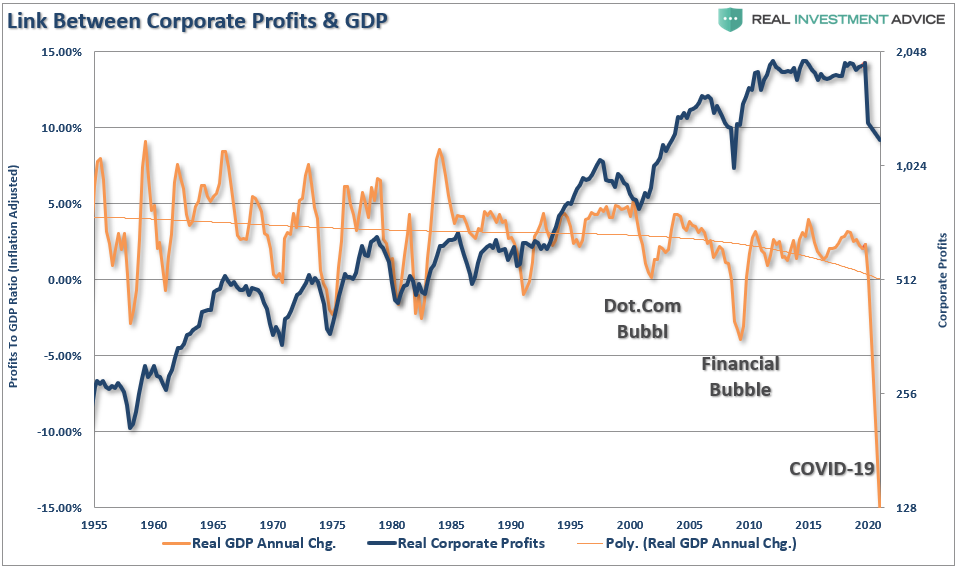
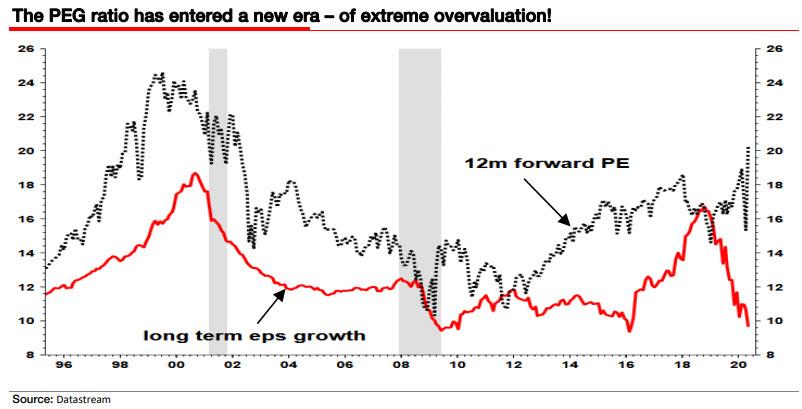
It may not seem to matter at the moment as it’s all about “the Fed.” However, you shouldn’t dismiss the simple fact markets are deviated from long-term earnings. Historically, such deviations don’t work out well for overly “bullish” investors. (Chart courtesy of Albert Edwards via SocGen)
Just remember two simple rules:
- So goes earnings, so goes the market.
- Reversions happen fast.
Bull Market Rotation
What this all suggests is that “risk” still outweighs the potential “reward” of being aggressively invested in the markets. However, this DOES NOT mean you shouldn’t have exposure to the markets. It just means understanding how much risk you are undertaking.
This past week, we discussed our sector positioning in our portfolios and analysis of holdings with our RIAPro Clients (30-day RISK-FREE Trial).
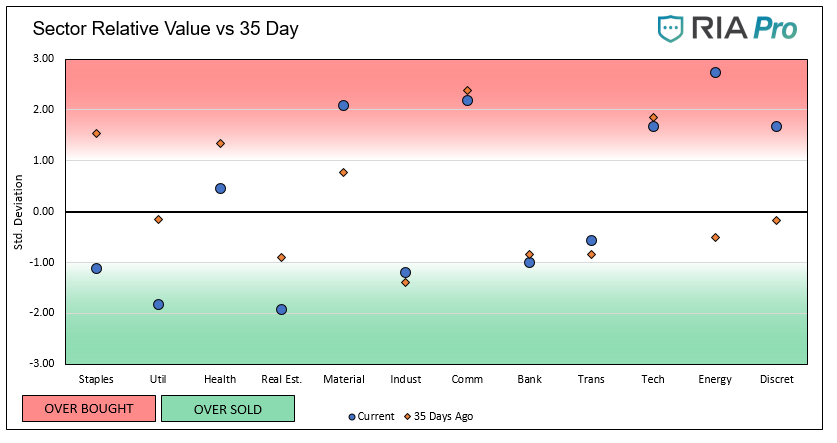
- “Currently, only two (Health Care and Transportation) of the eleven sectors are not in either oversold or overbought territory.
- Technology (XLK) and Communications (XLC) remains relatively strong as they are perceived as shelter from the economic impact of the Corona Virus. (We stay overweight)
- Energy (XLE) has been a favorite over the last two weeks and is now extremely overbought. We are comfortable with our stop loss and the sector is fundamentally cheap.
- The Real Estate (XLRE) and Utility sectors (XLU) are relatively cheaper in part due to the recent slight increase in bond yields. (We have added to these areas)
- Staples (XLP) are more appealing as a potential position add on. XLP has worked off its overbought condition and moved into oversold territory.
- Discretionary (XLY) is approaching deeply overbought territory. We do not own XLY, as many of the underlying companies are very sensitive to the economic impact of the virus.“
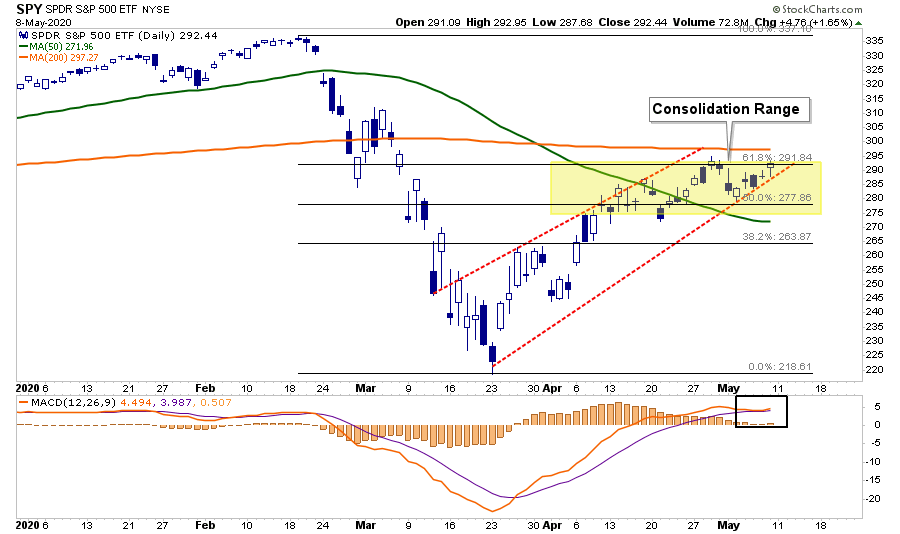
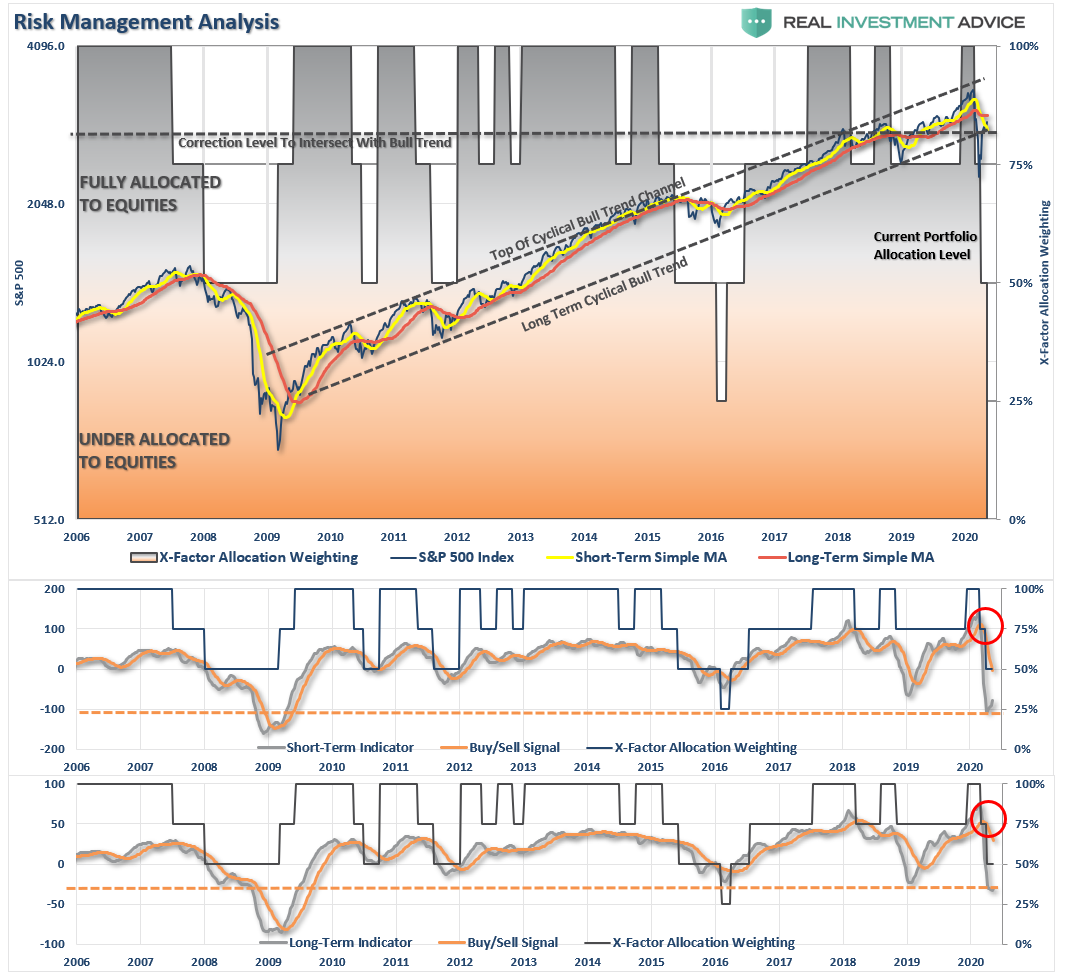
Market Risk Still Outweighs Reward
While the market did rally this week back to the top of its ongoing consolidation range, the risk still outweighs the potential reward. We have updated the chart and ranges from last week.
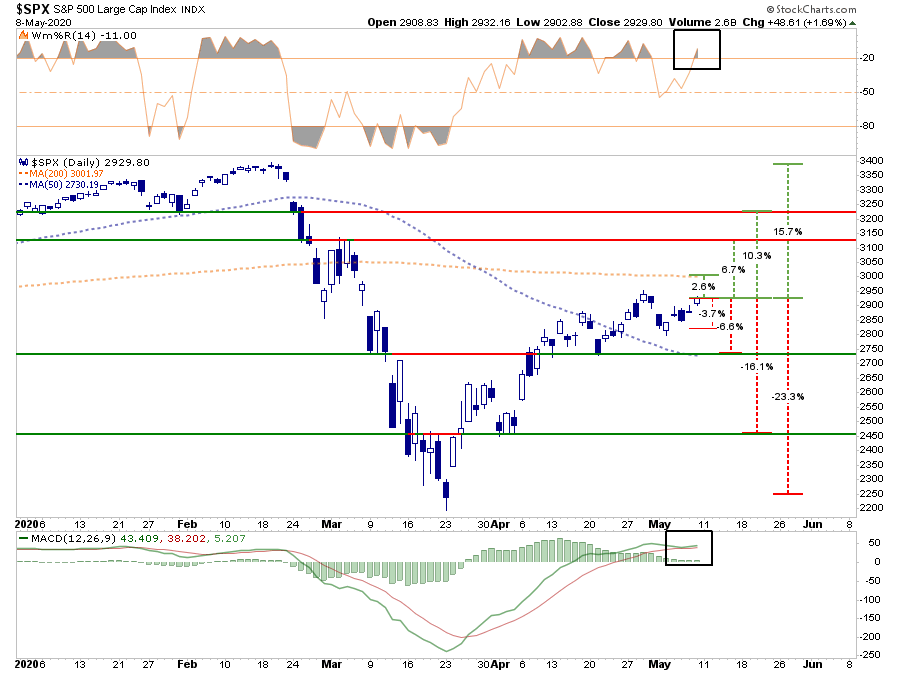
With Friday’s advance, the risk/reward ranges remain unfavorable for now.
- -3.7% to the 50% retracement vs. 2.6% to the 200-dma. Risk/reward negative.
- -6.6% to the 50-dma vs. 6.7% to the March bounce peak. Risk/reward equally balanced.
- -16.1% to the April 1st lows vs. 10.3% to January’s bottom. Risk/reward negative.
- -23.3% to the March 23rd low vs. 15.7% to all-time highs: Risk/reward negative.
The risk of a downside retracement, as we head into summer months, outweighs the upside currently. Importantly, this does NOT mean the markets can’t rally to all-time highs. It is possible, just not probable, and as investors, we must weigh our outcomes.
While it may seem currently such a correction “can’t happen,” that is usually just about the time that it does.
Positioning Update
As noted above, we continue to take profits in trading positions, and as noted in our sector rotation analysis, continue to rebalance equities in areas that are outperforming. We continue to balance our equity exposure with offsetting hedges, and still maintain a larger than average level of cash.
There is only one thing I am sure of, a raging bull market in stocks can NOT co-exist with a depressionary economy for long.
The stock market is NOT the economy. But the economy is a reflection of the very thing that supports higher asset prices – corporate profits.
You do the math.

The MacroView

If you need help or have questions, we are always glad to help. Just email me.
See You Next Week
By Lance Roberts, CIO
Financial Planning Corner
12-Smart Money Moves In An Economic Crisis
Our next “Financial Planning and Investment” Webinar is coming up May 16th.
If you have been laid off, furloughed, or forced to retire early, this is the webinar you need to watch to make sure you are doing the right things with your money. Got money at risk in the markets? We will discuss navigating a “bear market” and protecting your money.

Get Registered Today.
If you have any questions afterward, don’t hesitate to email me.
by Danny Ratliff, CFP®
Market & Sector Analysis
Data Analysis Of The Market & Sectors For Traders
S&P 500 Tear Sheet
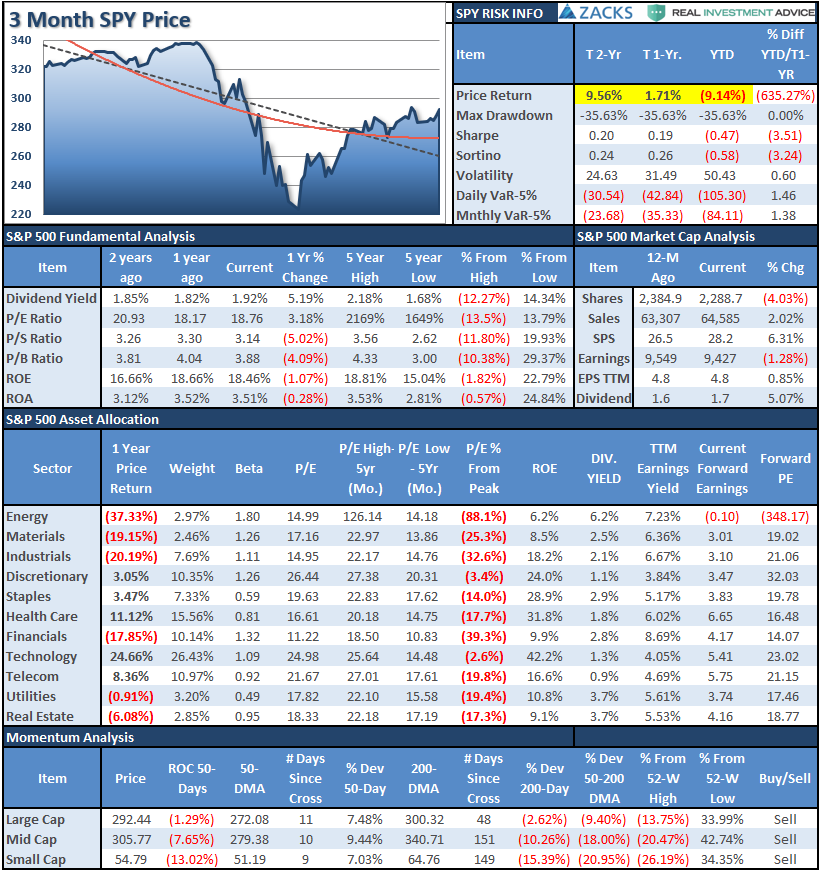
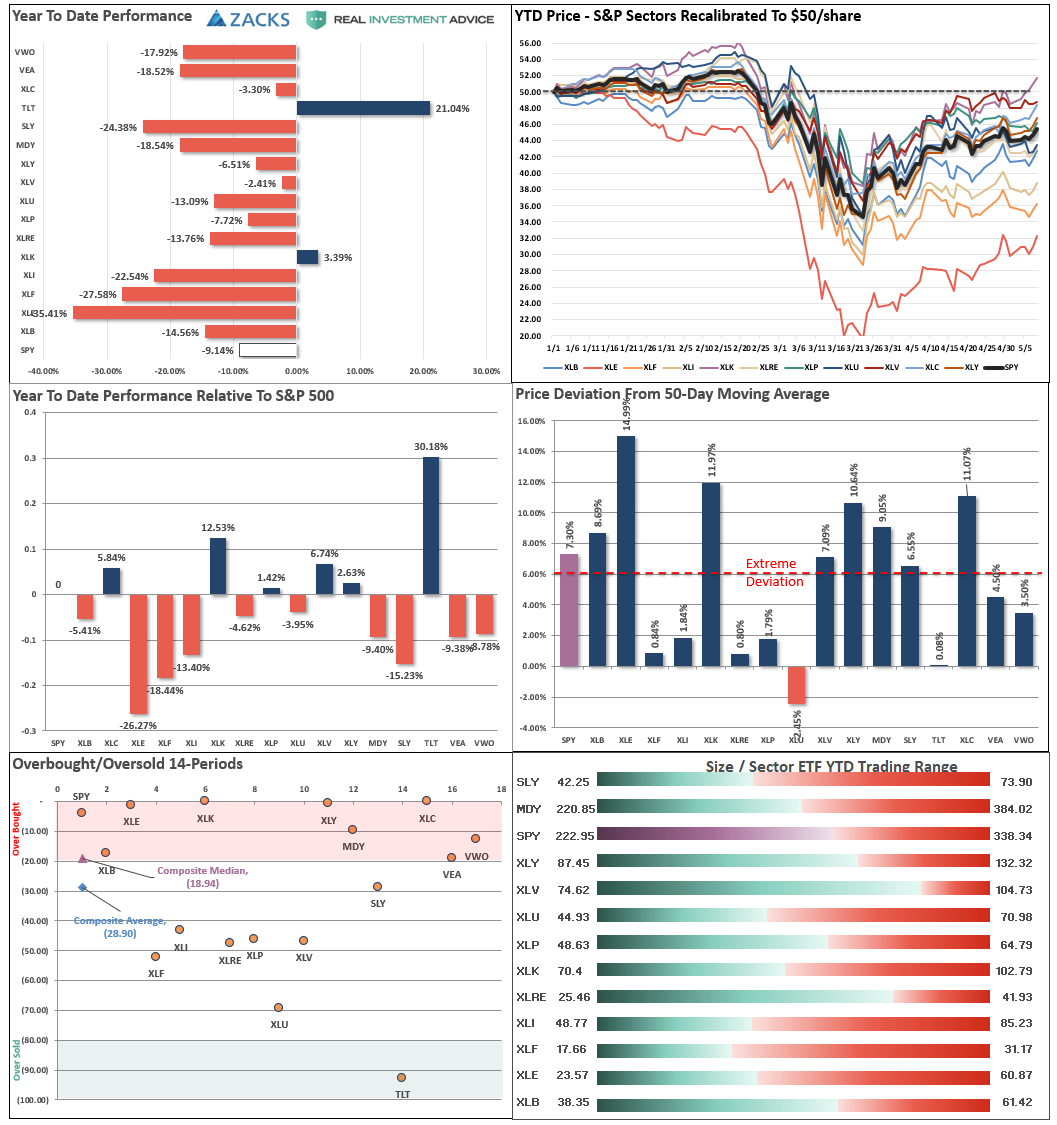
Performance Analysis
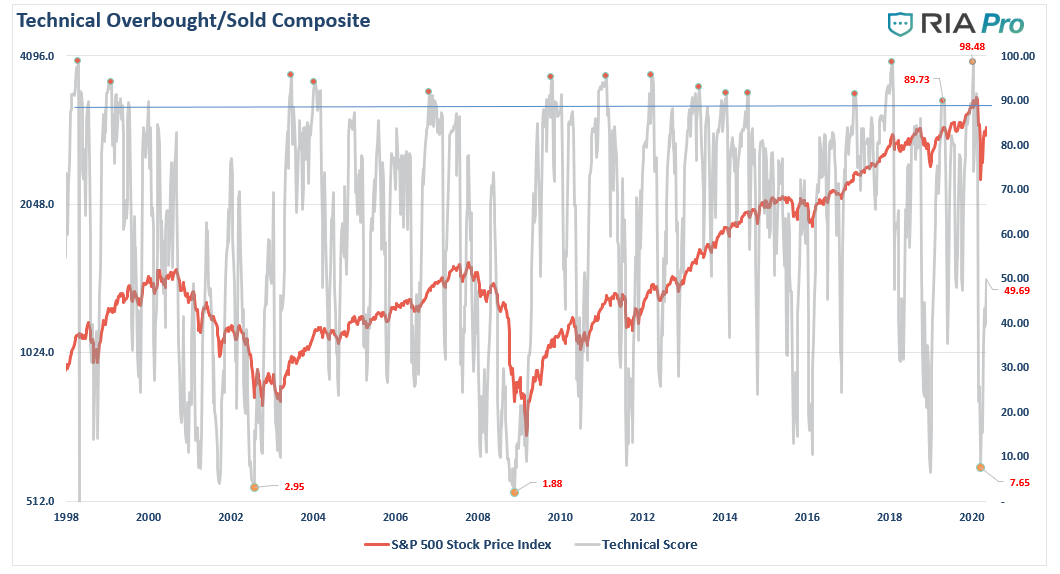
Technical Composite
Note: The technical gauge bounced from the lowest level since both the “Dot.com” and “Financial Crisis.” However, note the gauge bottoms BEFORE the market bottoms. In 2002, the market retested lows. In 2008, there was an additional 22% decline in early 2009.
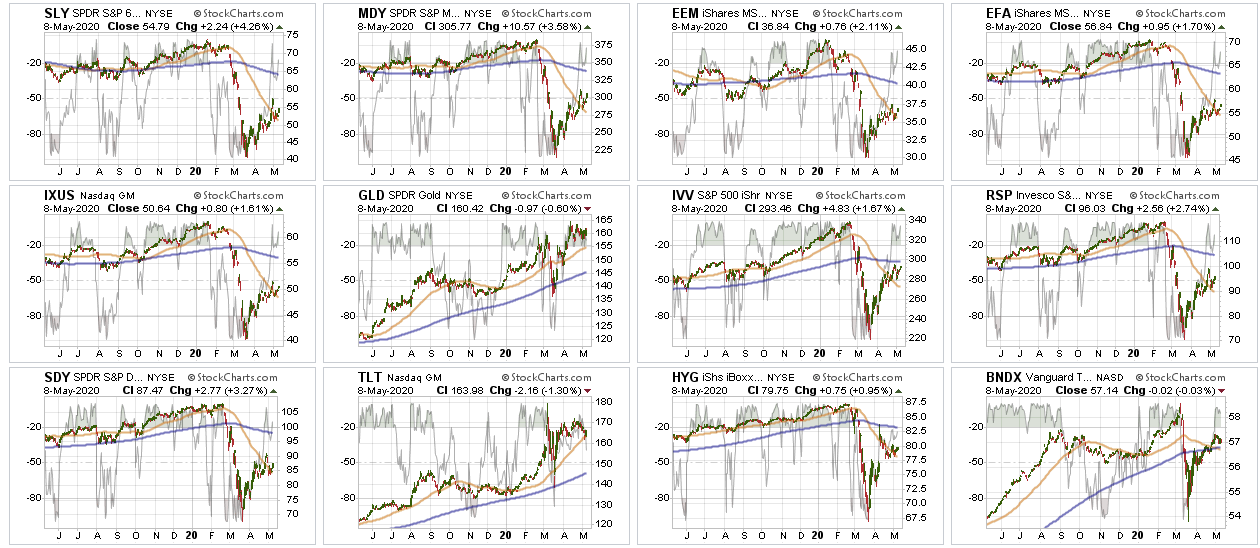
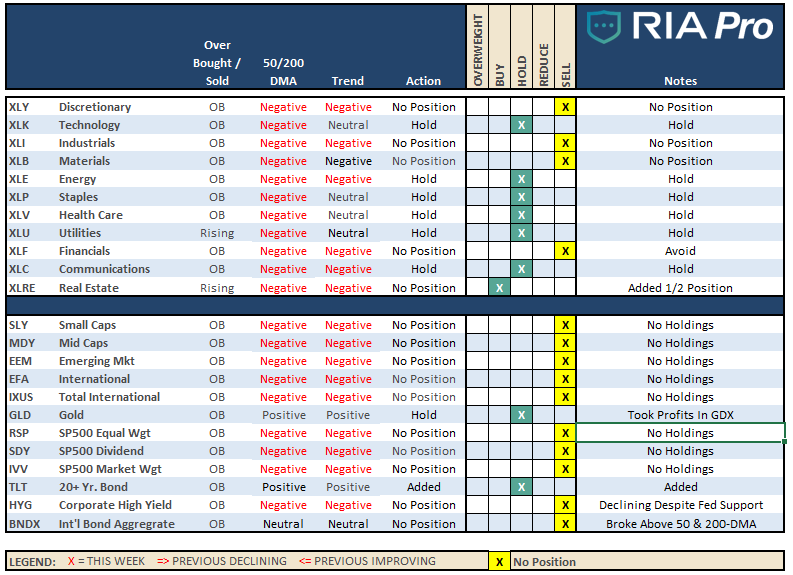
Sector Model Analysis & Risk Ranges
How To Read.
The table compares each sector and market to the S&P 500 index in terms of relative performance. The “MA XVER” is determined by whether the short-term weekly moving average crosses positively or negatively with the long-term weekly moving average. The risk range is a function of the month-end closing price and the “beta” of the sector or market. We also show you the price deviation above and below the moving averages.

Sector & Market Analysis:
Be sure and catch our updates on Major Markets (Monday) and Major Sectors (Tuesday) with updated buy/stop/sell levels.
Sector-by-Sector

Improving – Discretionary (XLY), and Materials (XLB)
As noted last week, there is no rush to get into either Discretionary or Materials stocks until AFTER we get through earnings season. With the economy very weak, the discretionary sector remains high risk, focus on Staples for the time being.
Current Positions: No Positions
Outperforming – Technology (XLK), Communications (XLC), Staples (XLP), and Healthcare (XLV),
Previously, we added to our core defensive positions Healthcare, Staples, and Utilities. We continue to hold our exposures in Technology and Communications, which remain at full weight. These sectors are continuing to outperforming the S&P 500 on a relative basis and have less “virus” related exposure.
Current Positions: XLK, XLC, XLP, XLV, XLU
Weakening – Utilities (XLU)
After adding a small weighting in Utilities, we are looking for the current weakness in the sector to give us a buying opportunity to add more exposure.
Current Position: 1/3rd Position XLU
Lagging – Industrials (XLI), Financials (XLF), Real Estate (XLRE), and Energy (XLE)
Financials continue to underperform the market. You can NOT have a lasting bull market rally without financials participating. As we have said previously, this sector, in particular, is THE most sensitive to Fed actions (XLF) and the shutdown of the economy (XLI).
We did start nibbling on exposure in the Energy sector (XLE) by adding some minimal positions which have been outperforming relative to the price of oil. It is WAY too early to be overly aggressive in the sector.
This past week, we added a small exposure to XLRE, which is now oversold on a relative basis.
Current Position: 1/3rd Position XLE, 1/2 XLRE
Market By Market
Small-Cap (SLY) and Mid Cap (MDY) – After selling all small-cap and mid-cap exposure earlier this year, we remain out of these sectors for now, and there is no rush to add them anytime soon. Be patient, small, and mid-caps are lagging badly. You can not have a “bull market” without “small and mid-cap” stocks participating. There was a brief moment last week we thought we might be seeing some rotation, but it went away as fast as it came.
Current Position: None
Emerging, International (EEM) & Total International Markets (EFA)
Same as Small-cap and Mid-cap. Given the spread of the virus and the impact on the global supply chain.
Current Position: None
S&P 500 Index (Core Holding) – Given the overall uncertainty of the broad market, we previously closed out our long-term core holdings. We are using SPY and QQQ index ETF’s for trading positions only for now.
Current Position: None
Gold (GLD) – Previously, we added additional exposure to both our GDX and IAU positions and are comfortable with our exposure currently. This week, we rebalanced our GDX position back to target weight last week after a 36% gain.
We also added a position in the Dollar previously (UUP) as the U.S. dollar shortage continues to rage and is larger than the Fed can offset.
Current Position: 1/2 weight GDX, 2/3rd weight IAU, 1/2 weight UUP
Bonds (TLT) –
Bonds have rallied as the Fed has become THE “buyer” of bonds on both a “first” and “last” resort. Simply, “bonds will not be allowed to default,” as the Fed will guarantee payments to creditors. As we have been increasing our “equity” exposure in portfolios over the last few weeks, we added more to our holding in TLT to increase our “risk” hedge in portfolios currently.
Current Positions: SHY, IEF, BIL, TLT
Sector / Market Recommendations
The table below shows thoughts on specific actions related to the current market environment.
(These are not recommendations or solicitations to take any action. Such is for informational purposes only related to market extremes and contrarian positioning within portfolios. Use at your own risk and peril.)
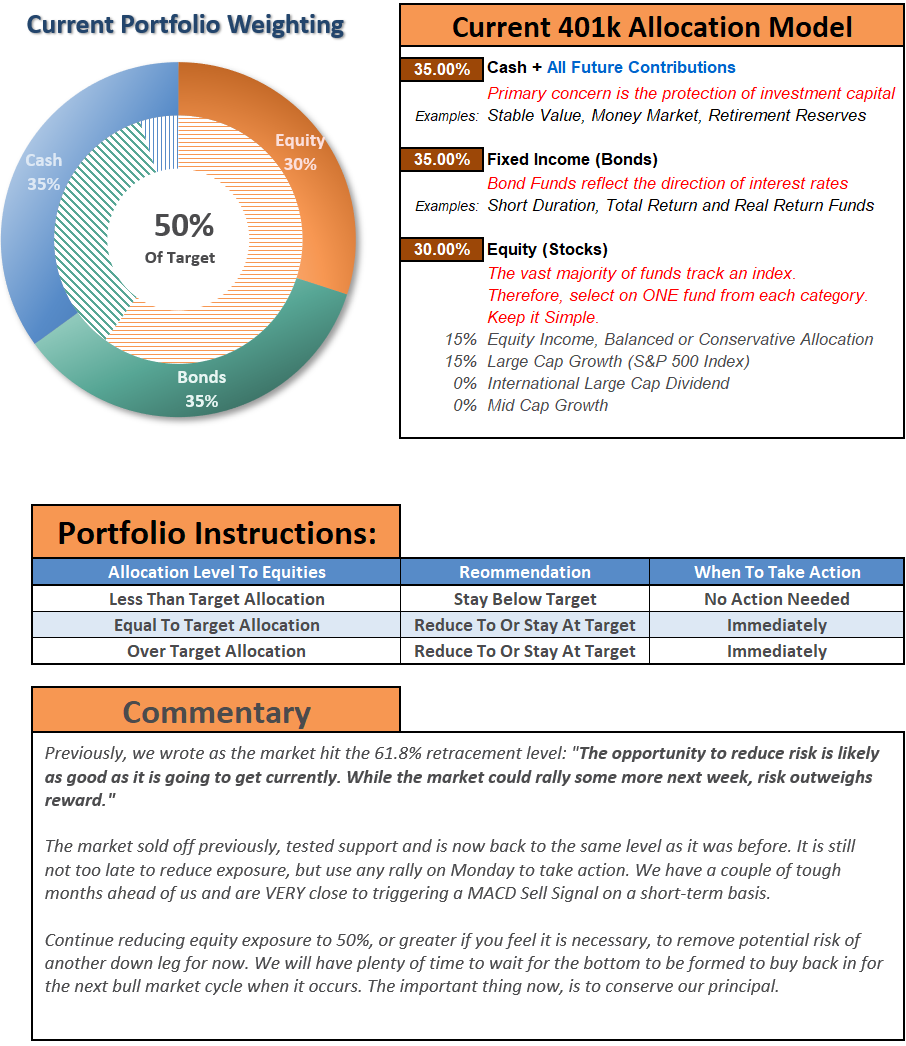
Portfolio / Client Update
This past week, the bull market rallied back to the 61.2% retracement level after holding the 50-dma (which is bullish short-term.) As discussed previously, there is indeed some short-term upside, but as we head into the summer months, the relative risk/reward ratio is not in our favor. (Please read this week’s missive.)
Furthermore, earnings and economic data have been horrific. While the markets do not seem to care at the moment, in hopes that there will be a rapid “V-shaped” recovery in the market, this data will eventually matter. It is not a question of “if” just a matter of “when.”
We continue to work around the edges to add exposure while managing risk. In models, we continue to rebalance our exposures. We sold Conagra (CAG) this week, and added a new healthcare REIT (MPW) to the Equity Model. In the ETF Model we added the SPDR Real Estate ETF (XLRE). We are maintaining our additional exposure in our bond portfolios to hedge our equity risk.
As noted last week, our process is still to participate in markets while preserving capital through risk management strategies.
For now, there is much more “trading” activity than normal as we work out way through whatever market is going to come. Is the bull market back? Maybe. Maybe Not. Once the bottom is clearly in, we will settle back down to a longer-term, trend-following, structure. Now is not the time for that.
We continue to remain very defensive and are in an excellent position with plenty of cash, reduced bond holdings, and minimal equity exposure in companies we want to own for the next 10-years. Just remain patient with us as we await the right opportunity to build holdings with both stable values, and higher yields.
Please don’t hesitate to contact us if you have any questions or concerns.
Lance Roberts
CIO
THE REAL 401k PLAN MANAGER
A Conservative Strategy For Long-Term Investors
If you need help after reading the alert; do not hesitate to contact me
Model performance is a two-asset model of stocks and bonds relative to the weighting changes made each week in the newsletter. Such is strictly for informational and educational purposes only and should not be relied on for any reason. Past performance is not a guarantee of future results. Use at your own risk and peril.

401k Plan Manager Live Model
As an RIA PRO subscriber (You get your first 30-days free) you have access to our live 401k plan manager.
Compare your current 401k allocation, to our recommendation for your company-specific plan as well as our on 401k model allocation.
You can also track performance, estimate future values based on your savings and expected returns, and dig down into your sector and market allocations.
If you would like to offer our service to your employees at a deeply discounted corporate rate, please contact me.


Lance Roberts is a Chief Portfolio Strategist/Economist for RIA Advisors. He is also the host of “The Lance Roberts Podcast” and Chief Editor of the “Real Investment Advice” website and author of “Real Investment Daily” blog and “Real Investment Report“. Follow Lance on Facebook, Twitter, Linked-In and YouTube
Customer Relationship Summary (Form CRS)
Also Read