The Fed is now permanently stuck at zero.
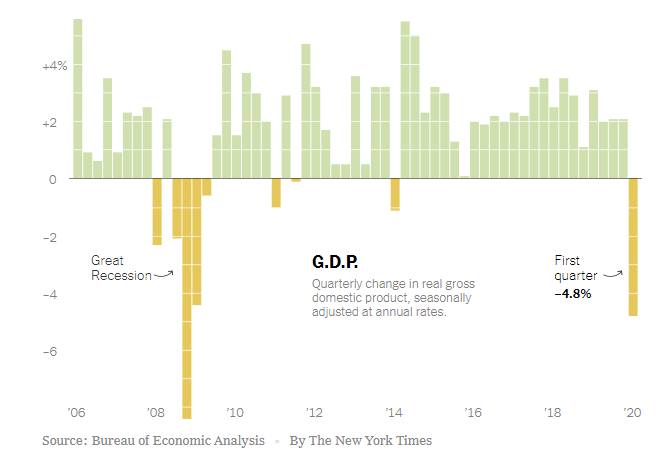
The negative 4.8% decline in GDP in the first quarter was stunning. Importantly, that reading only encapsulated the impact of the economic “shutdown” in that last two weeks of the quarter. This suggests, considering the entire month of April (1/3rd of the quarter) was a wash, the numbers will worse next quarter.
The NYT’s Ben Casselman had a good summary of the devastation:
“U.S. gross domestic product fell at a 4.8 percent annual rate in the first quarter of the year, the Commerce Department said Wednesday. That is the first decline since 2014, and the worst contraction since 2008, the last deep recession.
There is much worse to come. Widespread layoffs and business closings didn’t hit until late March in most of the country. Economists expect figures from the current quarter, which will capture the shutdown’s impact more fully. GDP likely contracted in the second quarter at an annual rate of 30 percent or more, a scale not seen since the Great Depression.”
The Choices We Make
Last week, Treasury Secretary, Steve Mnuchin, stated his optimism for economic recovery on Fox News:
“I think as we begin to reopen the economy in May and June, you’re going to see the economy bounce back in July, August, September.
And we are putting in an unprecedented amount of fiscal relief into the economy. You see trillions of dollars that’s making its way into the economy. I think this is going to have a significant impact.”
While it is certain the economy will eventually bounce back, it may take longer than the White House, and many investors expect.

There are several reasons for this assumption.
Initially, even with the economy open, it is unlikely, even without job losses, individuals will immediately return to old routines. A survey by Statista encapsulated this view.
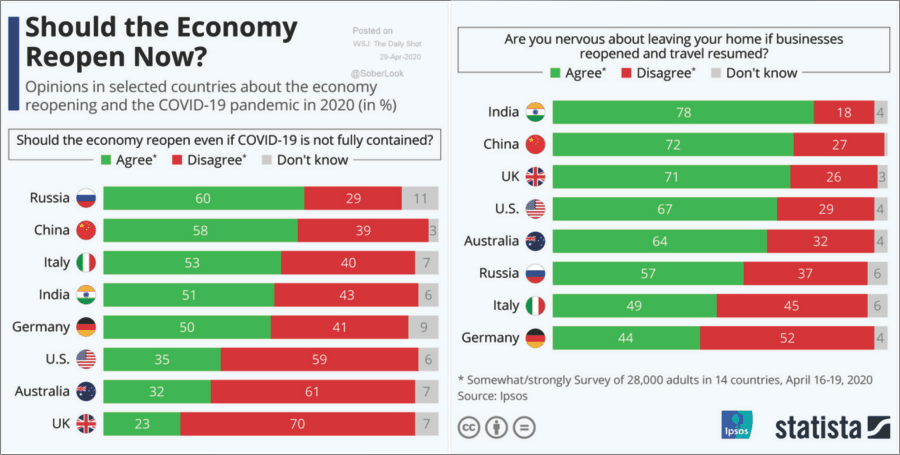
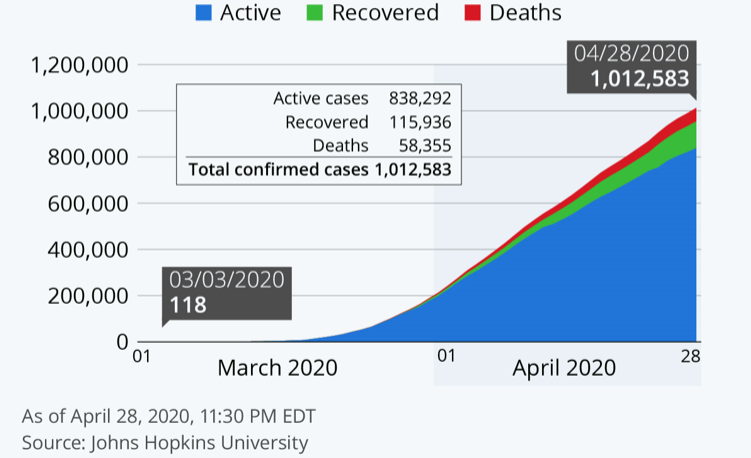
It is even harder to expect such activities to immediately occur when there is no decline in virus cases currently. While the rate of increase may be slowing, the concerns of infection will likely slow activity.
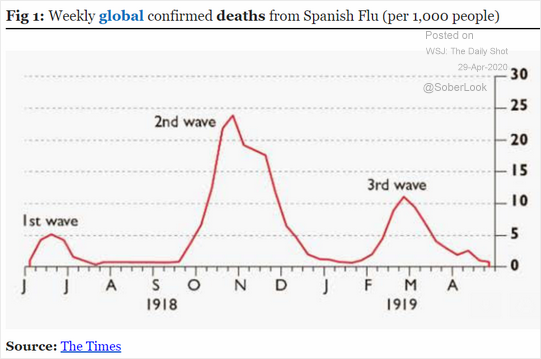
Even if Steve Mnuchin is correct and activity does come back, a likely second wave of the virus in the fall could be worse than the first. While I doubt a “re-shuttering” of the economy will occur, the psychological impact would likely cripple the recovery further.
It Just Takes Money
The fundamental side of the equation becomes more difficult to justify.
The economy is comprised of 70% consumption. To consume, an individual must have employment in which they produce, and receive compensation for, first. Over the next couple of quarters, we are likely to see unemployment rates rise to between 15 and 20%.
According to the Economic Policy Institute (EPI), while initial jobless claims have surged to over 28 million since March 15th, unemployment could be substantially higher.

The survey by EPI found that for every 10-people who successfully filed for claims, 3 to 4 were unable to register. A full 20% said they didn’t file due to difficulty, and long lines were another impediment.
If these numbers are close to accurate, it suggests as many as 50-million Americans have lost their jobs in recent weeks. The chart below shows the number of individuals in the “workforce” as of the end of February and assuming EPI’s forecast.
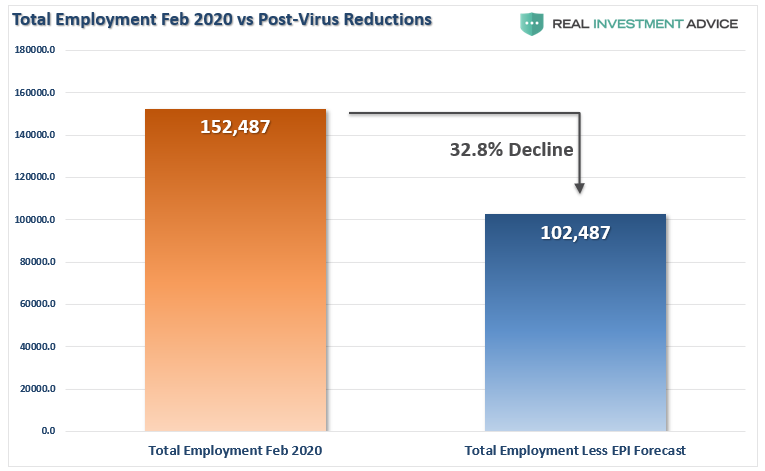
That, as they say, ain’t pretty.
More importantly, let’s make some basic assumptions about the impact to the overall economy.
- Total inflation-adjusted GDP = $18.987 Trillion
- Median real incomes: $63,179
- 50 Million job losses x 50,000 = $3.16 Trillion
- Current bailouts at 14% of GDP = $2.6 Trillion
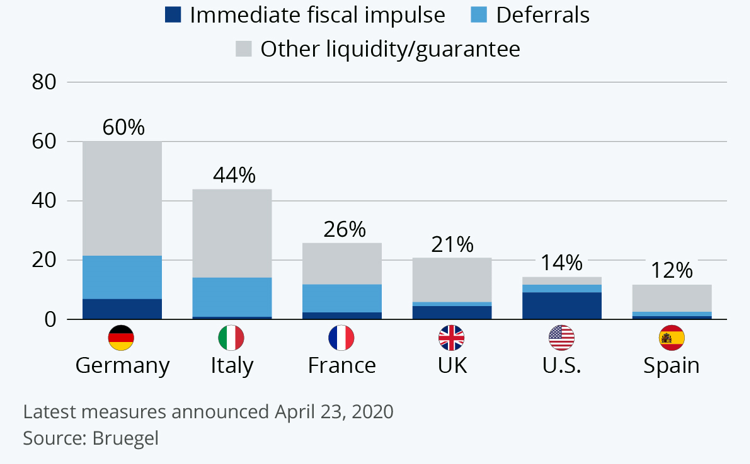
Effectively, the current fiscal stimulus is a wash relative to the impact on the economy. The more prolonged unemployment remains, the more likely consumption will constrict.
No Economic Swoosh
What this suggests is that hopes for a “V-shaped” recovery could be misguided. If our expectations of a slow re-engagement with the economy play out, the employment recovery will be slow also. As fiscal stimulus plays out, economic growth will struggle to gain traction.
Ironically, this is precisely what we witnessed post the “Financial Crisis” in 2008. The chart below shows the recovery of GDP, employment, wages, and inflation.
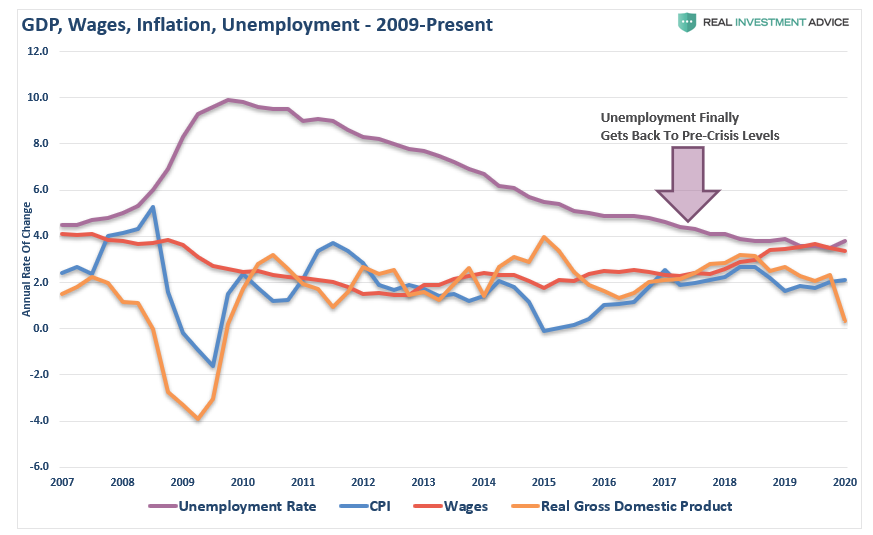
While employment took nearly a decade to recover to pre-crisis lows, wages, GDP, and inflation failed to gain traction.
Such was despite a decade of zero-interest-rate policy by the Fed, unprecedented monetary interventions, and a massive surge in consumer debt.
No Money, More Problems
The problem with a sharp loss of employment is that it creates a negative feedback loop into the economy. As job losses mount, incomes fall, which reduces personal consumption expenditures (PCE).
This past week PCE plunged as job losses surged. Importantly, this decline occurred in just the last two weeks of March. Given the entire month of April was shutdown, next quarter’s PCE report will be markedly worse.
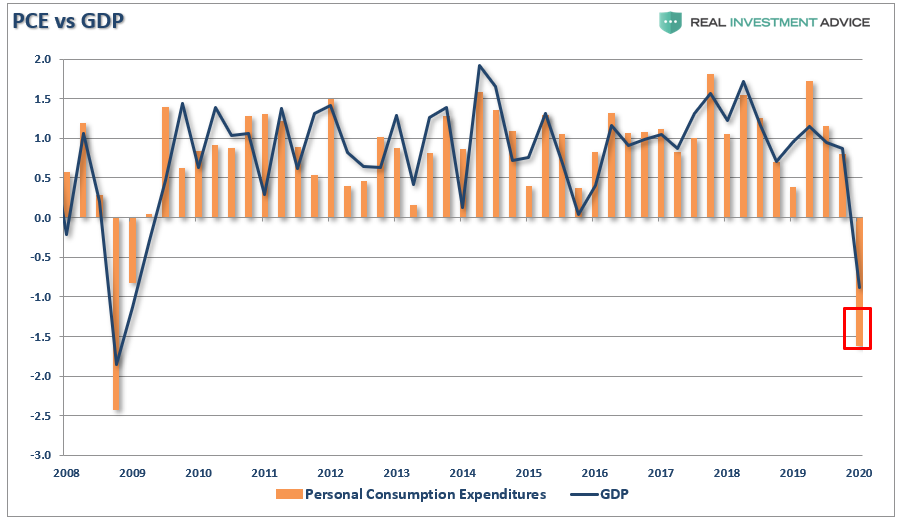
PCE also tells us there will be a slow recovery in the economy.
There is a negative feedback loop between employment and consumption. As unemployment rises, consumption falls due to a lack of income. Since businesses operate based on demand for goods and services, the correlation between PCE, fixed investment, and employment are high.
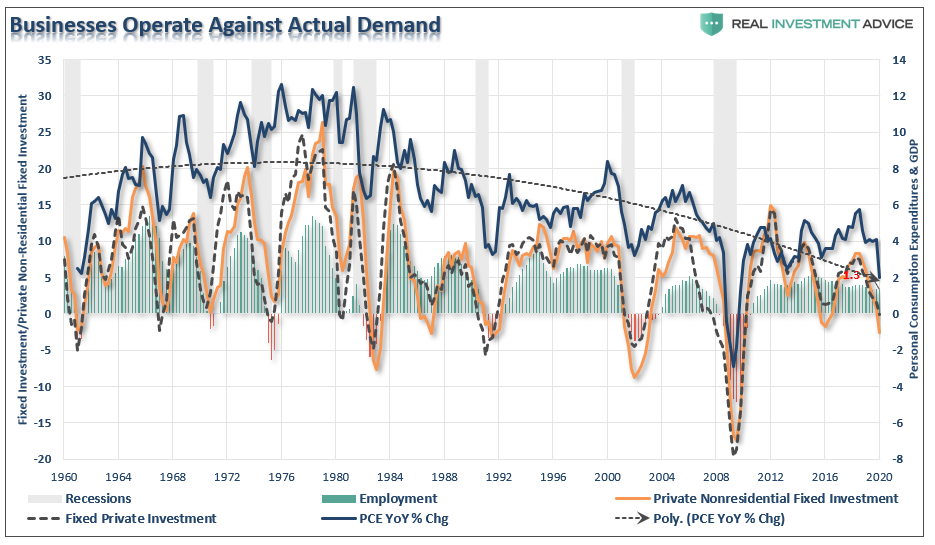
Despite the reopening of the economy, businesses will not immediately return to full operational activity, until consumption returns to more normal levels. Such a recovery is likely going to frustrate policy-makers and the Fed.
Since the “Financial Crisis,” massive levels of monetary accommodation, near zero-interest rates, and loose lending policies did not increase rates of economic prosperity. As shown below, what kept the economy growing at 2% were massive increases in debt to sustain the “standard of living,” not improve it.
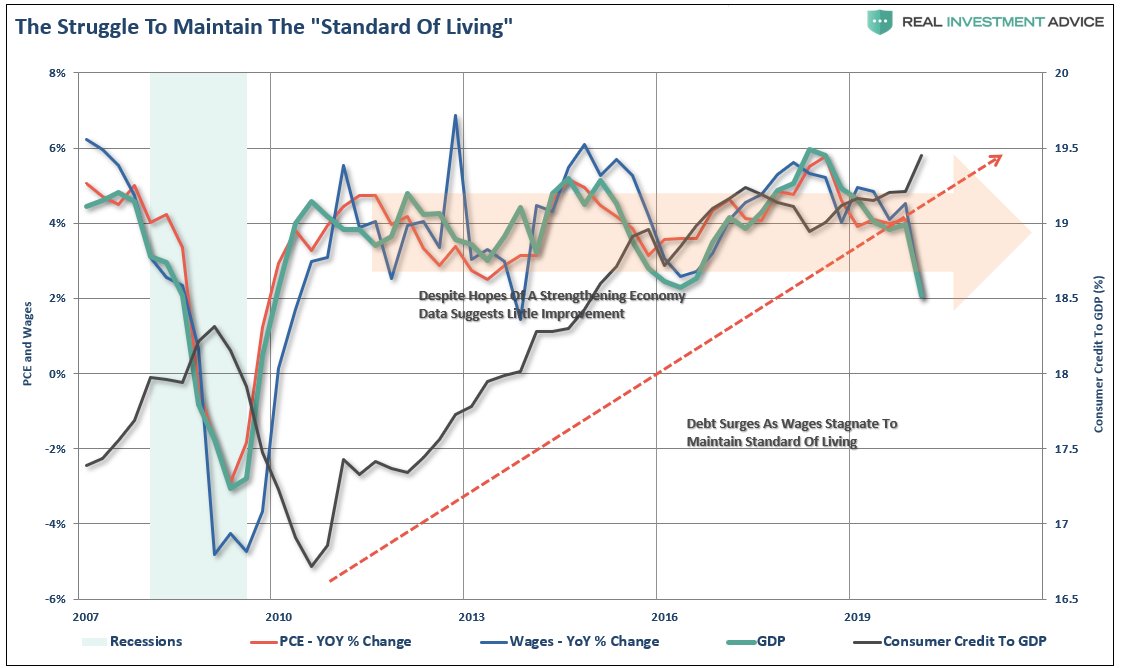
For roughly 80% of Americans, there is a monthly struggle to make ends meet. It isn’t just the raw data which supports that claim, but a multitude of studies.
Cost Of Happiness
“The [2019] survey found that 58 percent of respondents had less than $1,000 saved.” – Gobankingrates.com
Or, as noted by the WSJ:
“The American middle class is falling deeper into debt to maintain a middle-class lifestyle.
Cars, college, houses, and medical care have become steadily more costly, but incomes have been largely stagnant for two decades, despite a recent uptick. Filling the gap between earning and spending is an explosion of finance into nearly every corner of the consumer economy.
Consumer debt, not counting mortgages, has climbed to $4 trillion—higher than it has ever been even after adjusting for inflation.”
When looking at the data, it is hard to suggest that Americans are saving 8% or more of their income.

The differential between incomes and the actual “cost of living” is quite substantial. Researchers at Purdue University found in their study of data culled from across the globe, in the U.S., $132,000 is the optimal income for “feeling” happy when raising a family of four. (I can attest to this personally as a father of a family of six)
A Gallup survey found it required $58,000 to support a family of four in the U.S. (Forget about being happy, we are talking about “just getting by.”)
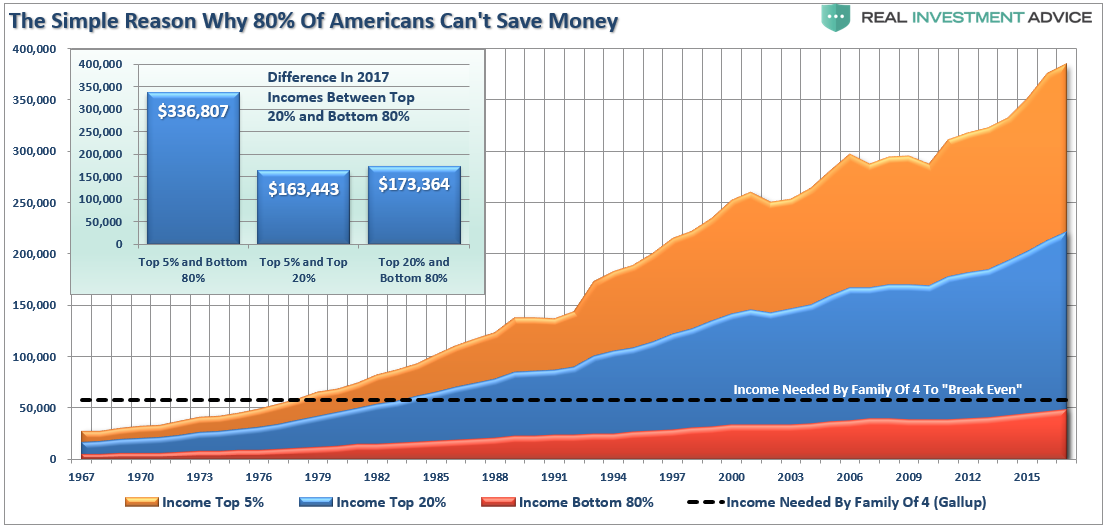
If you are in the “Top 20%” of income earners, congratulations, you are probably “happy.” For everyone else, it is likely a very different story.
Living On Debt
The Fed’s problem is shown in the chart below. Beginning in 1990, the “gap” between the “standard of living” and real disposable incomes inverted. It was at this moment that wages alone were no longer able to meet the required standard of living. To make up the difference, consumers turned to debt.
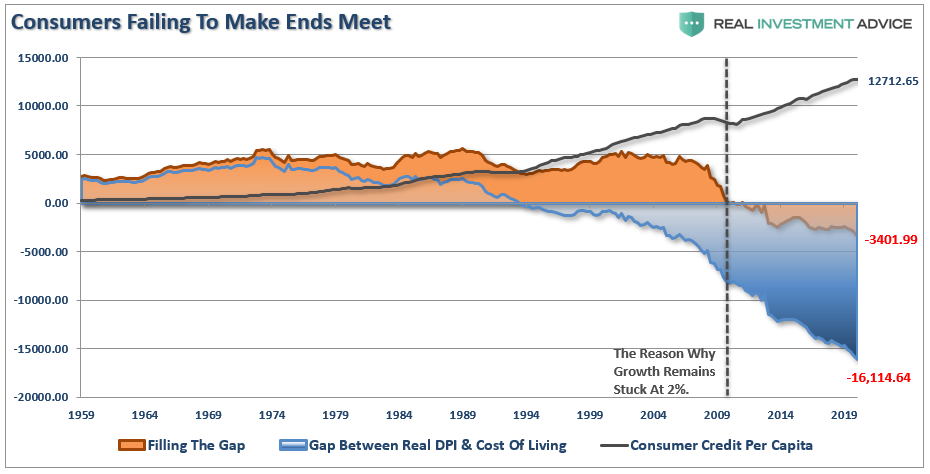
However, following the “financial crisis,” even the combined levels of income and debt no longer fill the gap. Currently, there is a –-$3401.99 annual deficit that cannot be filled.
The debt-to-income problem keeps individuals from building wealth, and government statistics obscure the basic reality. We discussed this point in detail in “Dimon’s View Of Economic Reality Is Still Delusional:”
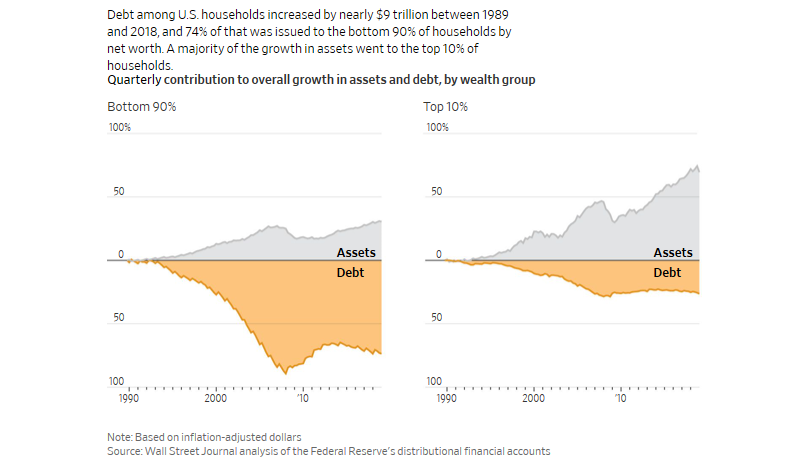
“The median net worth of households in the middle 20% of income rose 4% in inflation-adjusted terms to $81,900 between 1989 and 2016, the latest available data. For households in the top 20%, median net worth more than doubled to $811,860. And for the top 1%, the increase was 178% to $11,206,000.
Put differently, the value of assets for all U.S. households increased from 1989 through 2016 by an inflation-adjusted $58 trillion. A third of the gain—$19 trillion—went to the wealthiest 1%, according to a Journal analysis of Fed data.
‘On the surface, things look pretty good, but if you dig a little deeper, you see different subpopulations are not performing as well,’ said Cris deRitis, deputy chief economist at Moody’s Analytics.” – WSJ

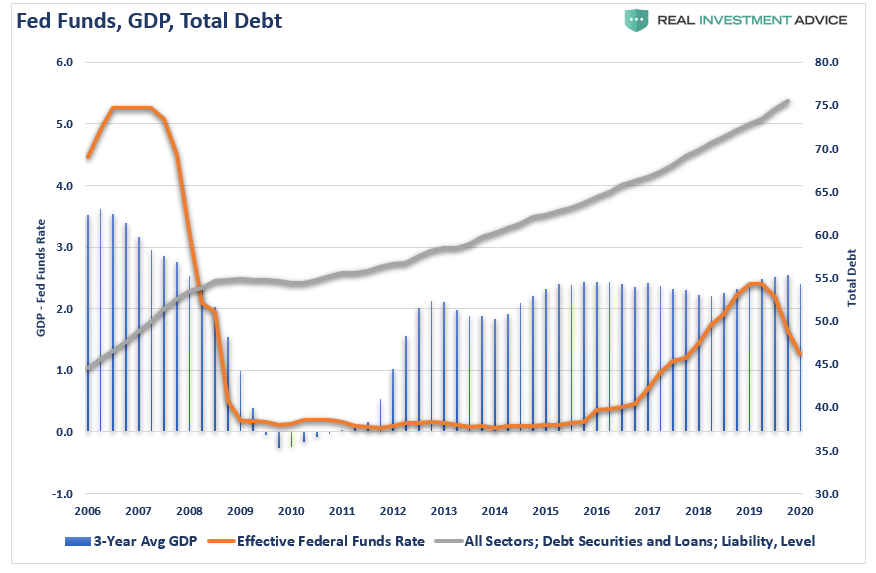
The Fed’s Trapped At Zero
The debt problem exposes the risk posed to the Fed and why they are now forever trapped at the zero-bound.
With an economy now $20 Trillion more in debt than it was before the financial crisis, any small increases in interest rates have almost immediate and catastrophic results on a debt-dependent economy.
As the Fed’s balance sheet heads toward $10 Trillion, the Fed has stated that interest rates will remain low until “such time as the dual mandates of full employment and price stability achieved.” Given economic stability was not achieved in the last decade, it is highly unlikely a more than doubling of the Fed’s balance sheet will improve future outcomes.
Unfortunately, given we now have a decade of experience of watching the “wealth gap” grow under the Federal Reserve’s policies, the next decade will only see the “gap” worsen.
While many are hoping for a “V-shaped” recovery following the “restart” of the economy, the reality is recovery may take much longer than expected.
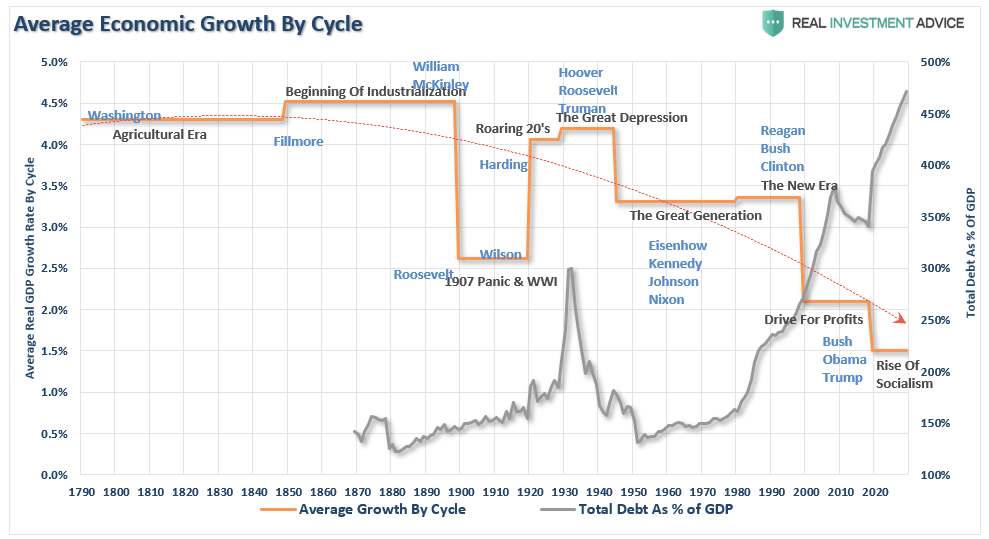
We now know that surging debt and deficits inhibit organic growth. The massive debt levels added to the backs of taxpayers will only ensure the Fed remains trapped at the zero-bound. The chart below shows the 10-year annualized run rates of economic growth throughout history with projected debt and growth levels over the next decade.
End Game
History is pretty clear about future outcomes from the Fed’s current actions. More importantly, these actions are coming at a time where there were already tremendous headwinds plaguing future economic growth.
- An aging demographic
- A heavily indebted economy
- A decline in exports
- Slowing domestic economic growth rates.
- An underemployed younger demographic.
- An inelastic supply-demand curve
- Weak industrial production
- Dependence on productivity increases
The lynchpin, like Japan, remains demographics and interest rates. As the aging population grows becoming a net drag on “savings,” the dependency on the “social welfare net” will continue to expand.
The problem is that after a decade of pulling forward future consumption to stimulate economic activity, a further expansion of the wealth gap, increased indebtedness, and low rates of economic growth, will weigh on future economic opportunity for the masses.
Supporting economic growth through increasing levels of debt only makes sense if “growth at all cost” uniformly benefits all citizens. Unfortunately, there is a big difference between growth and prosperity.
But for now, the Fed has no other choice.

