


Is everything “priced in?” Investors have gone “all in” with a disregard for caution. But with markets extended and overvalued what should investors do now?
As discussed in this past weekend’s newsletter, investors got even more speculative during the recent correction, which is the opposite of what you would expect. But if markets anticipate “good news,” then are there any “surprises” left?
In other words, if markets have priced in perfection, then there is not a lot of room for “disappointment.” Such was a point I made this morning on Twitter:
Lot's of room for a bigger #correction at some point with #shortinterest at multi-year lows. All you need is some unexpected, exogenous event to trigger algos to reverse course. pic.twitter.com/OOXEvaNvzj
— Lance Roberts (@LanceRoberts) September 14, 2020
As we have discussed previously, “market momentum” is a hard thing to kill. Such is particularly the case when the “Fear Of Missing Out” overrides logic. In this past weekend’s missive, we laid out the case for a “sellable rally.” To wit:
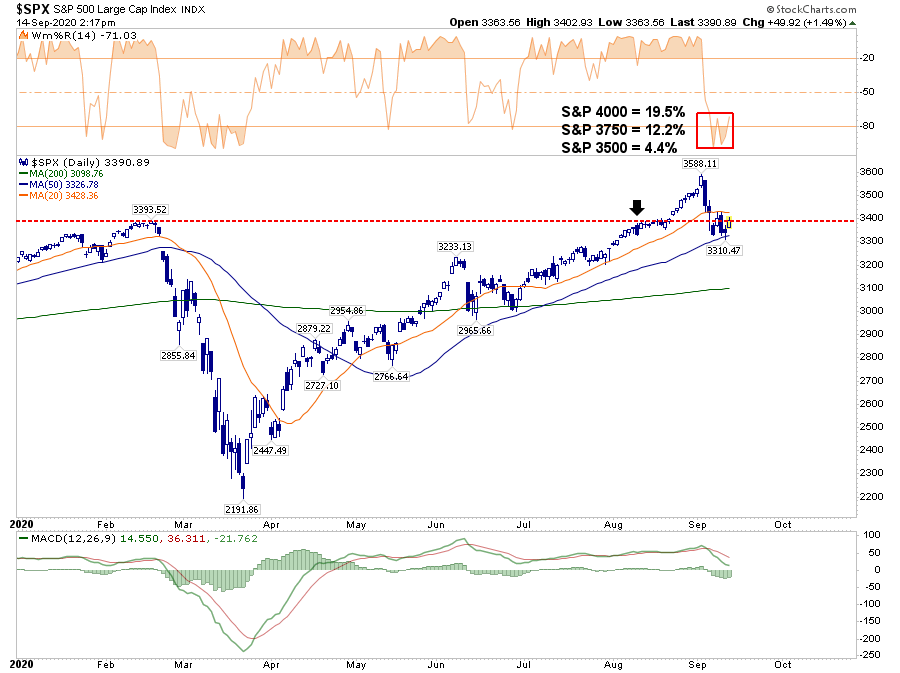
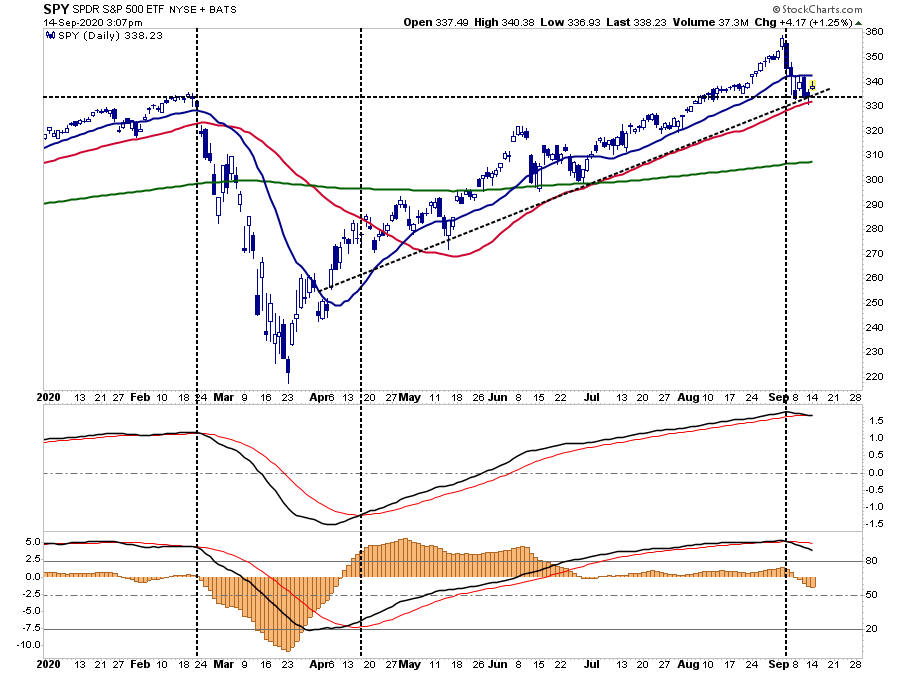
“You can see the failure of the market at the 20-dma and the support at the 50-dma. What is essential are the upper and lower indicators.
- Both of the upper indicators are currently registering short-term oversold conditions, suggestive of at least a reflexive bounce next week.
- Conversely, both of the lower “sell signals” have been triggered, and as noted in the video, it suggests there is additional selling pressure on stocks currently.”
Chart updated through Monday’s close:


Lot’s Of Risks To The Bullish Outlook
While we used the sell-off to add some holdings to our portfolios, we remain cautious for several reasons.
- The market has fully priced in whatever economic recovery we are likely to see near-term.
- There is clear evidence of weakening economic data and slower earnings growth.
- Investors are counting on a “vaccine” to restore the economy to its previous strength fully.
- The markets have entirely discounted the potential for an election “event.”
- Market participants have discounted the need the additional stimulus to sustain economic growth and recovery.
- The Fed is on the sidelines for now. Without additional Treasury issuance, the Fed has less ability to provide additional liquidity to the market.
- While the economy is indeed recovering, along with employment, it will still likely fall well short of pre-pandemic levels stifling future earnings growth and revenues.
- Investors are paying exceedingly high valuations based on a full earnings recovery, which is unlikely to be the case.
Sluggish Growth
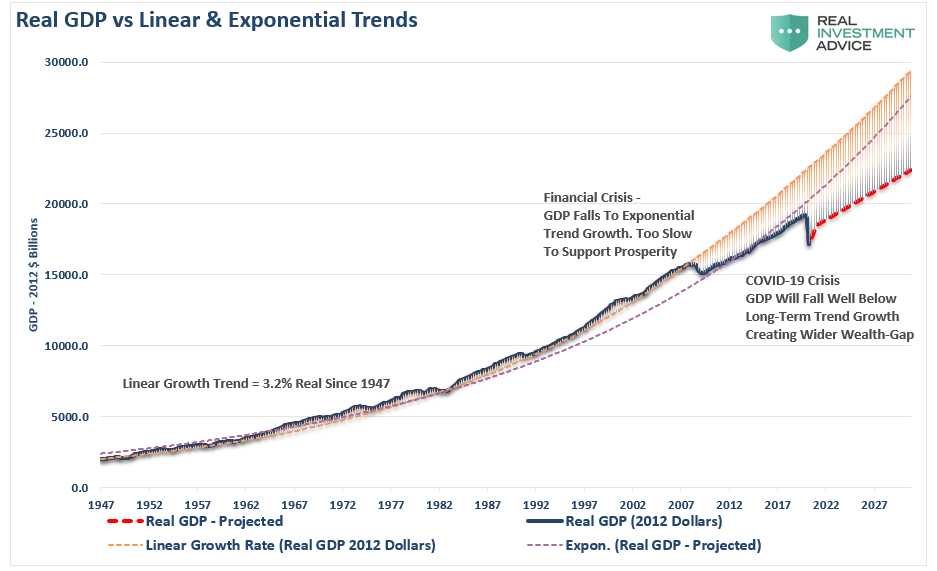
The problem, as discussed in “Insanely Stupid,” the ability for stocks to continue to grow earnings at a rate to support such high valuations is problematic. Such is due to rising debts and deficits, which will retard economic growth in the future. To wit:
“Before the ‘Financial Crisis,’ the economy had a linear growth trend of real GDP of 3.2%. Following the 2008 recession, the growth rate dropped to the exponential growth trend of roughly 2.2%. Instead of reducing the debt problems, unproductive debt, and leverage increased.
The ‘COVID-19’ crisis led to a debt surge to new highs. Such will result in a retardation of economic growth to 1.5% or less.”
Slower economic growth, combined with a potential for higher taxes, increases the probability that “risk” may well outweigh “reward” at this juncture. However, all of these issues will take time to play out.
In the short-term, it’s all about sentiment.
3750 Or Bust!
Stocks can, and likely will, try and go higher in the near term. There is a tremendous amount of bullish sentiment in this regard. Options speculators have not been deterred by the recent sell-off and continue to “buy the dip.”
As noted in this past weekend's #newsletter, the recent #market #correction made #speculators even more speculative. https://t.co/PhtyIOhAdK pic.twitter.com/Z99KTYb4aD
— Lance Roberts (@LanceRoberts) September 14, 2020
Such is why, despite some likely wiggles along the way, our target of 3750 may still be viable because of momentum and extreme levels of “bullish bias.”
“With the markets closing just at all-time highs, we can only guess where the next market peak will be. Therefore, to gauge risk and reward ranges, we have set targets at 3500, 3750, and 4000 or 4.4%, 12.2%, and 19.5%, respectively.”
Since that time, the market did indeed rally to, and exceeded, our initial target of 3500. The subsequent pullback to the 50-dma held the bullish uptrend from April for now and did reverse the short-term overbought condition.
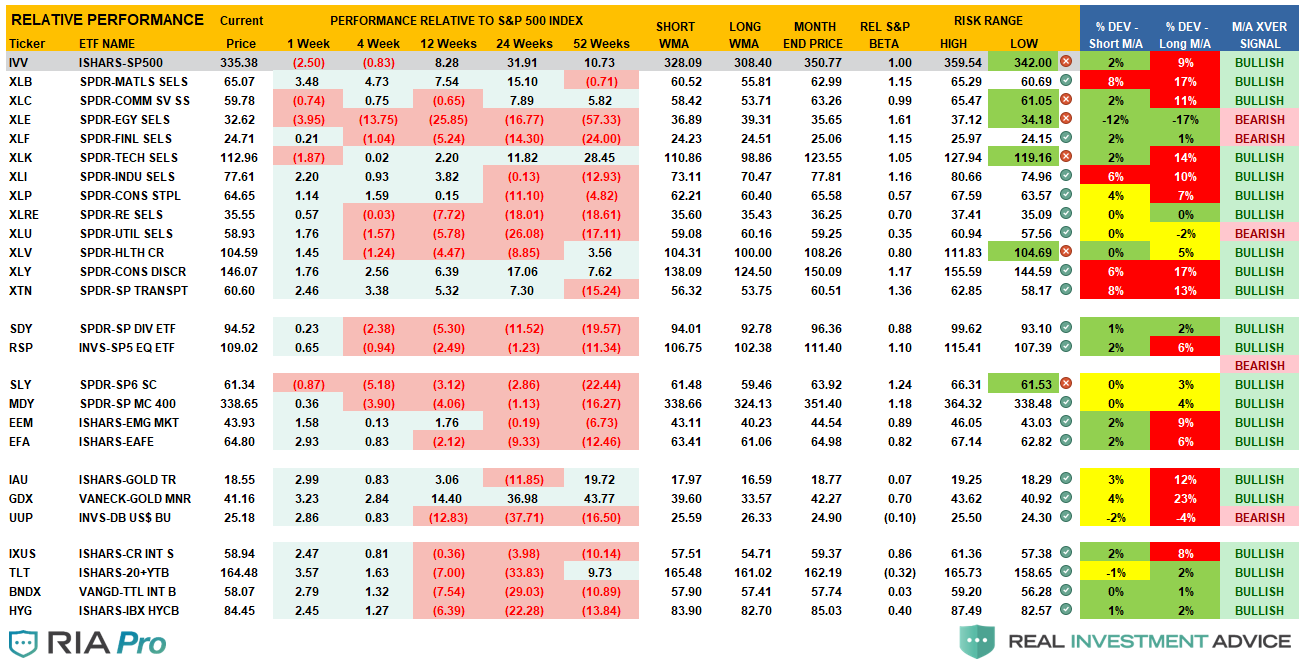
Also, as we showed our RIAPro Subscribers (30-Day Risk-Free Trial), the sharp sell-off in Technology specifically pulled the sector out of its Risk/Reward range, providing a “bullish setup.”

It’s Still A “Sellable Rally.”
The reason we suggest selling any rally is because, until the pattern changes, the market exhibiting all traits of a “topping process.”
- Weak participation
- Failure at long-term resistance
- Extreme bullish speculation
- Negative divergences in relative strength
We can show this in a long-term monthly chart.
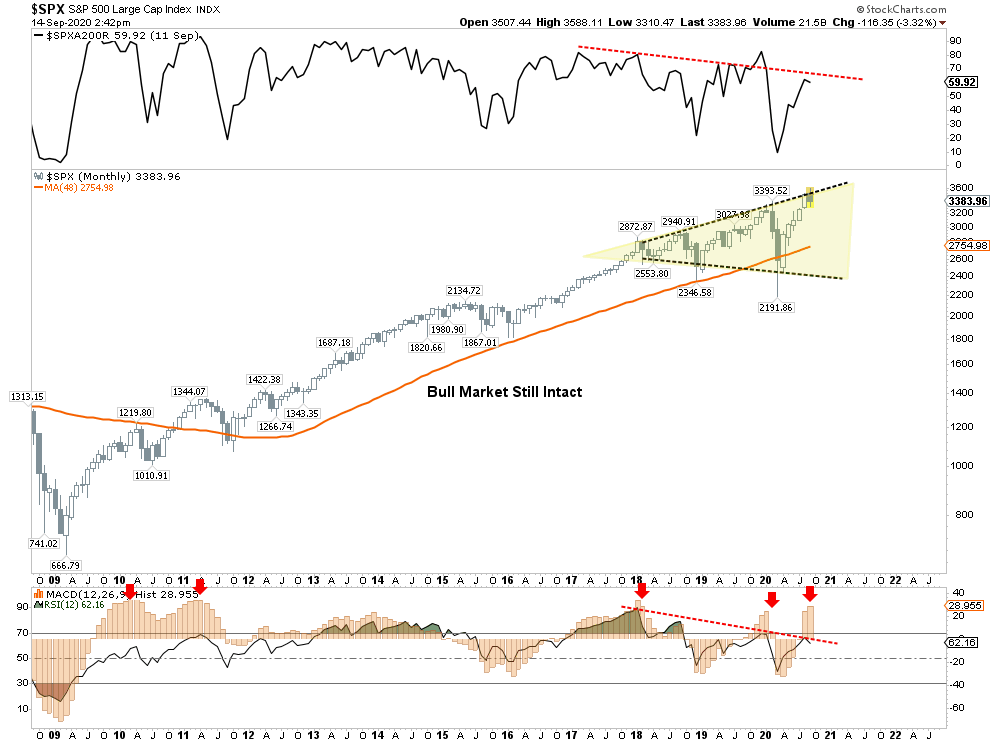
Note that since 2009, whenever the monthly MACD “buy signal” was this elevated, it typically correlated to a short- to intermediate-term market peak. At each point, the “bullish story” was the same.
- Earnings are still strong
- Economic data suggests the economy is growing strongly
- It’s a “Goldilocks Economy” (Fed hiking rates is bullish, Fed cutting rates are bullish.)
- The Fed is remaining “accommodative.”
However, the primary warning signs to investors were also the same:
- A failure of the economy to live up to market expectations
- A rise in volatility
- A decline in bond yields.

Some Upside, But Downside
Could that change?
Indeed, and if it does, and our “onboarding” model turns back onto a “buy signal,” we will act accordingly and increase equity risk in portfolios. However, for now, the risk still appears to be to the downside.
Overall, our assessment remains one of caution. In the short-term, we could well see an oversold bounce that could even recover back to the previous highs.
However, we suspect that given the rather numerous headwinds currently facing the markets, from the Fed to the election, that a failure at lower highs would not be surprising.
While we did add some exposure near the lows, we will be using the rally to sell into and increase our portfolio hedges heading into the election.
If you disagree, that is okay.
However, these are the questions we ask ourselves every time we add exposure to portfolios:
- What is the expected return from current valuation levels? (___%)
- If I am wrong, given my current risk exposure, what is my potential downside? (___%)
- If #2 is greater than #1, then what actions should I be taking now? (#2 – #1 = ___%)
How you answer those questions is entirely up to you.
What you do with the answers is also up to you.
Ignoring the results and “hoping this time will be different” has never been a profitable portfolio strategy.


Lance Roberts is a Chief Portfolio Strategist/Economist for RIA Advisors. He is also the host of “The Lance Roberts Podcast” and Chief Editor of the “Real Investment Advice” website and author of “Real Investment Daily” blog and “Real Investment Report“. Follow Lance on Facebook, Twitter, Linked-In and YouTube
Customer Relationship Summary (Form CRS)
Also Read


