
The graph below paints a very interesting picture of US energy efficiency and a key structural economic change in this country. For roughly 25 years after WWII, the US economy’s crude oil consumption nearly tripled. Feeding the growth were a booming post-war economy and strong population growth. To put consumption in a different context, the graph shows consumption as a ratio to a dollar of real GDP, on a per capita basis. It shows that consumption per dollar of GDP declined rapidly starting in the mid-1970s, suggesting an increase in US energy efficiency. The US per capita energy efficiency is less pronounced but noticeable. In addition to productivity gains and urbanization, there are a few reasons for the gains in efficiency.
- The 1973 Arab oil embargo was a shock to the economy. During this time, a quadrupling of gas prices and long gas lines forced policymakers and consumers to treat oil as a strategic vulnerability rather than a cheap given.
- Washington enacted numerous measures in response to persistently high oil prices in the 1970s. For instance, the Energy Policy and Conservation Act of 1975 mandated US energy efficiency standards for appliances and introduced fuel-economy standards. Legislators also encouraged a shift from oil and natural gas to coal for power generation. Utilities largely stopped building oil-fired plants.
- Structural change was equally important. The economy shifted from heavy manufacturing to services and technology, sectors that require far less energy per dollar of output.
Ironically, AI data centers are now driving a renewed focus on efficiency, this time with natural gas and renewables.

What To Watch Today
Earnings
- No notable earnings today
Economy

Market Trading Update
Price closed Friday at 7,575, sitting 1.86% above its rising 50-day moving average near 7,429 and a healthy 8.7% above the 200-day average at roughly 6,960. Both averages slope higher, and the price is above both. That is a bullish structure, full stop. The 14-day RSI reads 59, which is firmly neutral with room to run before it flashes overbought, and the MACD remains in a positive posture with the signal line trailing below. Momentum is constructive, not stretched.

The wrinkle is under the surface. This week’s advance was driven by a handful of names while the equal-weight index and small caps slipped, so the momentum you see on the chart is thinner than it looks. We have maintained equity exposure at target weight in our models since April 17, and this is precisely the tape that argues for discipline rather than taking on fresh risk. When the generals march, and the troops sit, you respect the trend, but you tighten your stops.
Volume told the same story as breadth. The push toward the highs came on unremarkable participation, and the new-high lists were dominated by the same technology and communication-services names that led the tape all week. That is not the broad thrust you want confirming a durable breakout to fresh records. At nearly 9% above the 200-day average, the index is not dangerously stretched, but it is closer to the top of its typical band than the bottom, which is another argument for buying pullbacks rather than chasing breakouts. It does not break the uptrend. It lowers the quality of it.

The line that matters most next week is 7,612. A clean, high-volume breakout above the June record clears the runway toward 7,700 and keeps the trend intact. A failure right at the old high, especially on the same narrow breadth we saw this week, would set up a pullback to the 50-day average, and that is the level I would be watching for a low-risk entry rather than chasing strength into resistance.

The Week Ahead
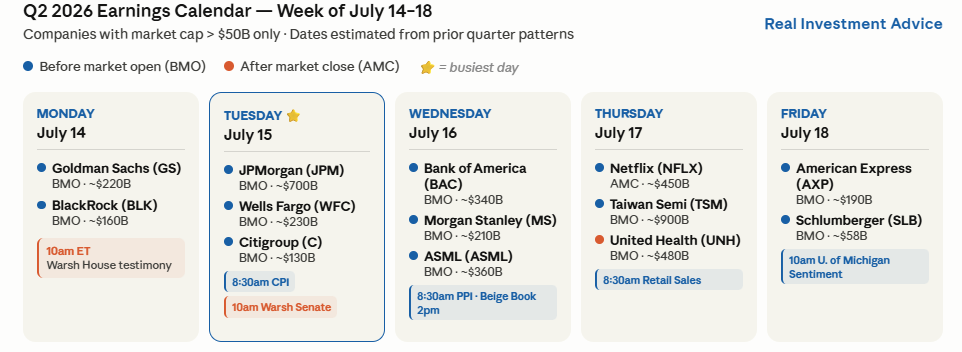
After a lull in economic data, we get three important data releases, two days of congressional testimony from Fed Chair Warsh, and the opening of Q2 earnings season.
The June CPI, to be released on Tuesday, is expected to show no headline inflation and +0.2% core inflation. Such a reading may give the Fed some confidence that the recent spurt in inflation is Iran/oil-related and reversing. The market will look at PPI in a similar vein. Retail Sales on Thursday is the consumer reality check. With credit card delinquencies at 15-year highs, the savings rate near historic lows, and elevated gasoline prices, the risk is skewed toward a soft print. The consensus is for a 0.3% gain after a hot +0.9% last month. Also, watch the control group, which feeds directly into GDP calculations.
Fed Chair Warsh testifies before the House Financial Services Committee on Tuesday, July 14, at 10 am ET, and the Senate Banking Committee on Wednesday, July 15. This will be his first Humphrey-Hawkins appearance as Chair. We want to see just how transitory he thinks the recent inflation push will be. Furthermore, whether his “AI productivity disinflation” thesis surfaces. We presume he will be bold in his call to get inflation back to target. With fewer Fed speeches, no dot plots, and no forward guidance, this quarterly testimony is now one of the only windows markets have into Warsh’s thinking.
Financials kick off earnings next week, as we share below.
AI Capex Risk Cuts Both Ways In The American Economy
Just over a year ago, I made the case that the deficit narrative would find its cure in artificial intelligence. Goldman Sachs has since published research that, on first reading, appears to refute. It isn’t. But after more than thirty years of watching capex cycles play out, I’ve learned the right move when new data lands is to test the original argument against it. So far, that thesis from June 2025 holds. However, the AI capex risk profile has gotten sharper since then, and the argument needs tightening in a few places. The bull case and the tail risk are now the same buildout, but they are running in different directions.

The case I made last June rested on a straightforward chain. The deficit narrative was overstated. AI infrastructure would lift GDP. A higher denominator would stabilize debt-to-GDP. That chain still holds. However, Goldman’s economics team, led by Elsie Peng, just published a careful look at how much of all this AI capex actually flows through to measured U.S. GDP, and the answer landed well below most published estimates.
The backdrop has also gotten messier. The BEA’s second estimate revised Q1 2026 GDP growth down to 1.6% from the 2.0% advance estimate, with most of the downgrade attributable to inventory investment. Strip out the rebound in federal spending after the Q4 government shutdown, and core domestic demand looks softer than the headline. Middle East supply shocks, lingering tariff effects, and tighter immigration are all weighing on the consumer side. That backdrop turns AI capex risk from an academic question into a portfolio-management one. AI capex isn’t just a contributor to growth. It’s increasingly the entire growth story.

Tweet of the Day
New UPDATED Trading Rules With Desktop Printout
“Want to achieve better long-term success in managing your portfolio? Here are our 15-trading rules for managing market risks.”
Please subscribe to the daily commentary to receive these updates every morning before the opening bell.
If you found this blog useful, please send it to someone else, share it on social media, or contact us to set up a meeting.