
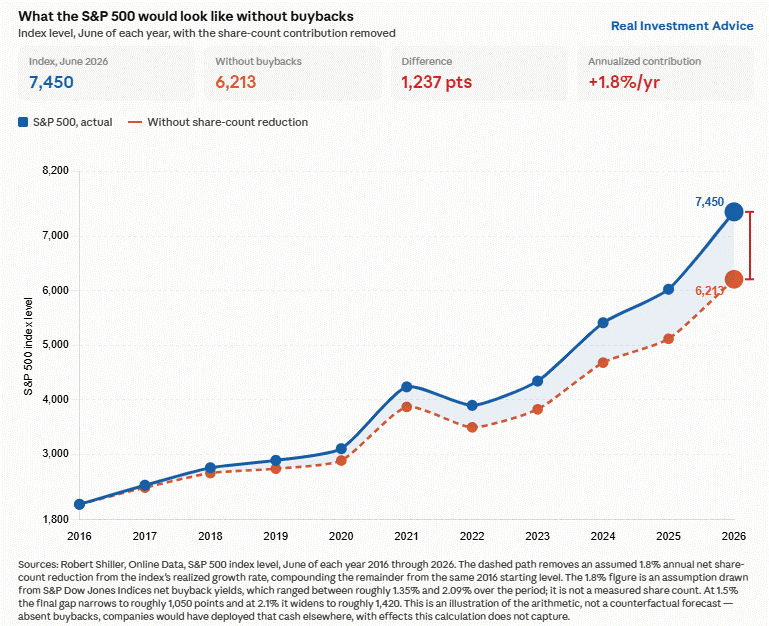
S&P 500 companies have been the marginal buyer of US stocks for a decade. Stock buybacks reached a record $1.020 trillion in the twelve months through September 2025, accounting for roughly 60% of all cash returned to shareholders. That tailwind has had a big impact on returns. If we decompose the S&P 500 return from June 2021 to June 2026, we find earnings per share grew 13.2% annually while the price-to-earnings multiple contracted 1.1%. In other words, the entire advance came from earnings growth. Within that earnings growth, roughly 1.8% a year came from share count reduction rather than profit. That equates to about 14% of the total return, and 1,240 index points since 2016.
The tailwind may be fading as buybacks slow and new large IPO shares come to market. Alphabet and Meta both paused repurchases in the first half of 2026 to fund AI investment. As we discussed in Commentary last week, Meta went a step further, creating a new class of nonvoting stock that is essentially a funding mechanism, issuing shares, not retiring them. At the same time, new supply is coming from IPOs. SpaceX raised roughly $85.7 billion in its June offering and will further add to supply as lockouts occur. Additionally, Anthropic is expected to come public in November with nearly a $1 trillion offering. OpenAI will likely come over the next two quarters with a similarly sized offering.
The market is being asked to absorb new equity just as some of the largest buyers of existing equity are pulling back and, in some cases, like Meta, becoming net issuers. None of this says the market must fall, but it does warn that one of the market’s biggest buyers could be much less influential.
What To Watch Today
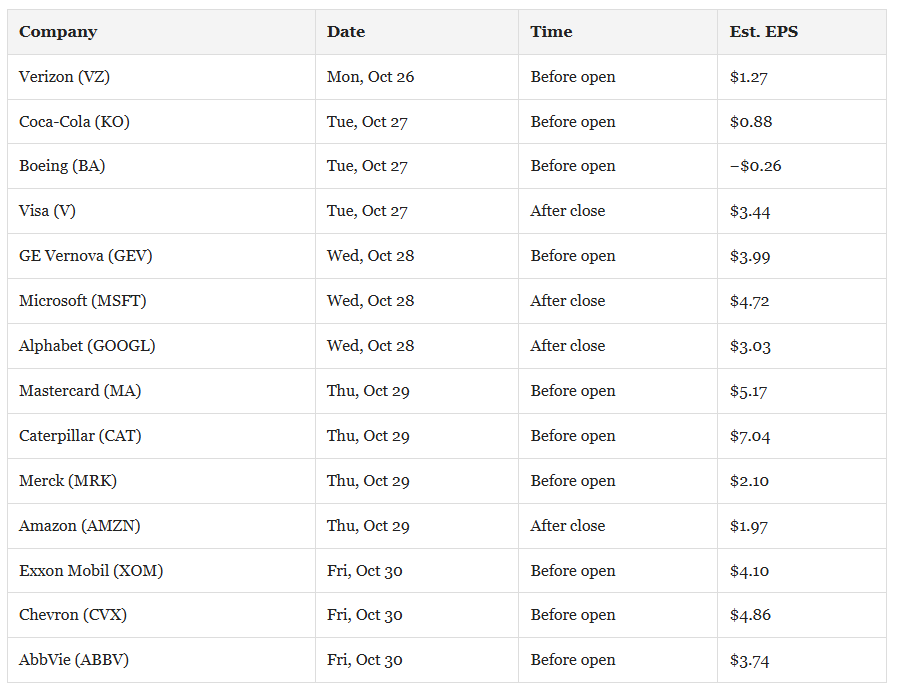
Earnings
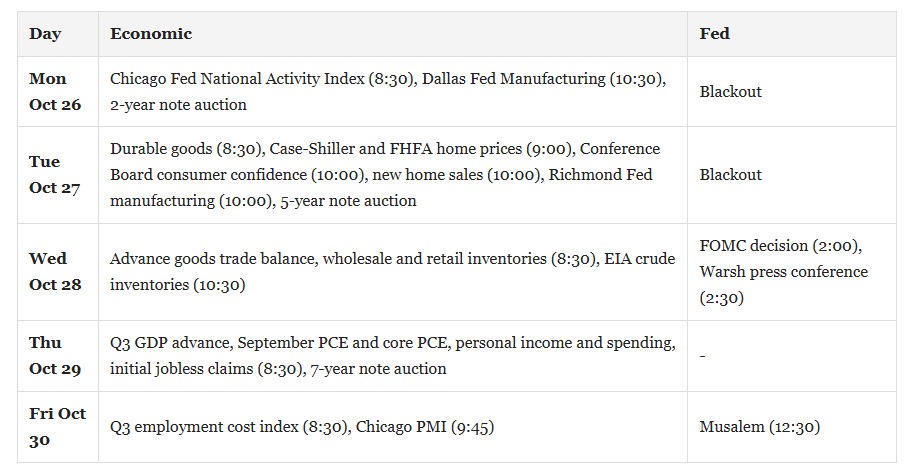
Economy
Market Trading Update
The S&P 500 closed Friday at 7,623.68, down 0.4% for the week. That leaves it 2.4% below its October 6 record close near 7,815. The index sits 1.0% below its 50-day moving average of 7,702 and is resting right on its 100-day average of 7,605. It remains 4.5% above the 200-day average at 7,293, so the longer-term uptrend is intact. Friday’s close also landed just above the lower 2-standard-deviation Bollinger Band at 7,604. Closes below that band are marked by short-term lows in March, June, late July, and mid-September this year. In the October 19 Before the Bell, we flagged a short-term momentum sell signal and a test of the 100-day. That test is here.
Momentum confirms the pressure. The 14-day RSI sits at 42, neutral but falling. MACD also crossed below its signal line, a sell signal that tends to cap near-term rallies. Neither reading is oversold, which means the index hasn’t finished correcting the way tech has. The divergence is the story. Equal weight rose 1.1% this week, and the Dow gained 1.4%. The average stock is holding up while the mega-caps drag the cap-weighted index lower.

Sector breadth tells the same tale from a different angle. Eight of 11 sectors are ahead of the index, measured by distance from their 50-day averages. Only technology, industrials, and communications are lagging. Energy is the most stretched, followed by health care and staples. The leaders have become the crowded trade, and the laggards are where a bounce would come from. That runs counter to the defensive posture that worked over the last three weeks, and it’s why we’re watching for a chance to rebalance back toward growth rather than adding to the winners.

Next week is the test. Roughly 44% of the S&P 500 reports earnings, including Microsoft and Alphabet on Wednesday and Amazon on Thursday, on top of a Fed decision and the September PCE report. That’s a lot of information hitting a market that’s sitting on support. If the 100-day holds and the mega-caps show that AI spending is producing a return, oversold tech has room to rally. The first stop is the 50-day near 7,700, with the October 21 close at 7,757 just above it. If the 100-day breaks, the September 16 low at 7,564 is next, followed by the July 31 low near 7,494. The 200-day at 7,293 is where the bull trend gets questioned in earnest.

For traders, the playbook is simple. Don’t chase the defensive sectors at these levels. Look at taking some profits in stretched energy and staples positions. Then let tech reach a real oversold extreme before rebalancing toward growth. That means an RSI near 30 and closes below the lower band. Keep stops below the 200-day average. A rally into the 50-day is likely to see selling, so use strength to rebalance rather than to add risk. The most important level next week is the 100-day average at 7,605. Where the market closes relative to it after Microsoft and Alphabet report will set the tone into November.

The Week Ahead
Next week concentrates the quarter’s two biggest questions into forty-eight hours:
- Will the Fed buck market expectations and hike rates?
- Do capex plans from other large companies require equity issuance and a halt or reduction in buybacks?
The FOMC meets to make its policy decision at 2:00 PM ET on October 28. Fed Funds futures put the odds of a hike at roughly 10%, down from 28% a week earlier. December remains in play, with the odds of a hike at 85%. The statement language and the press conference will help investors better gauge the Fed’s policy stance.
On Thursday, we will get GDP and September PCE. PCE prices will help guide the Fed on whether it’s appropriate to hike at this week’s meeting or if it’s comfortable waiting until December.
StockTitan counts 542 companies worth $2 billion or more reporting this week, with many on Wednesday and Thursday. Microsoft and Alphabet report Wednesday after the close, Amazon Thursday. Apple comes the following week on November 2.
Fed Over-Tightening: How Much Runway Is Left Before It Bites?
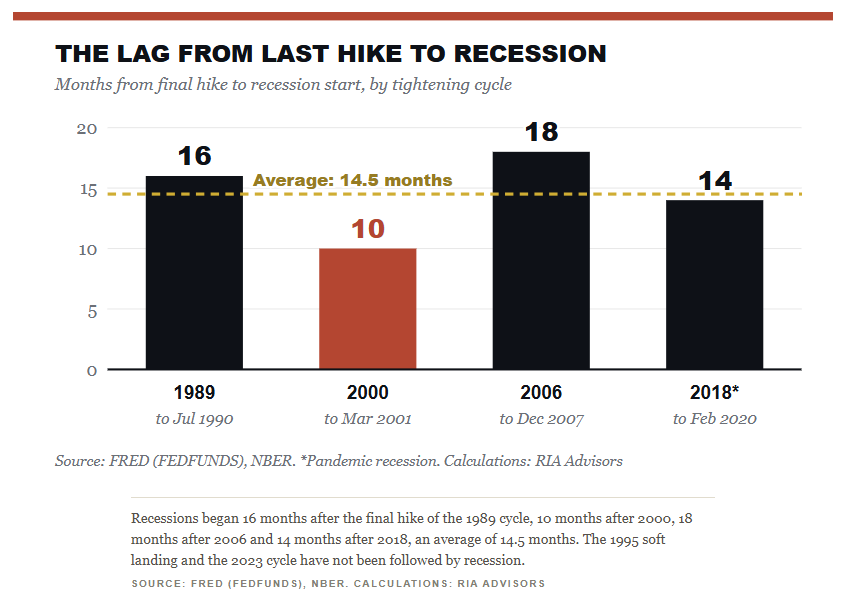
The Fed raised rates in September, and the 10-year Treasury yield has since topped 5.3%, the highest since 2007. That combination raises a question the market isn’t asking loudly enough. If long-term rates are already doing the tightening, does every additional hike from here raise the risk of Fed over-tightening? I think the answer is yes. What’s more, the data suggest the “runway” before the damage shows up is shorter than most assume.
On September 16, the FOMC voted 12-0 to raise the target range to 3.75%-4.00%, its first hike since 2023.1 The new dot plot puts the year-end rate between 4.1% and 4.4%. Markets now expect a hold at the October 28 meeting but still price roughly three-in-four odds of another hike by December.2 As I argued in why the Fed rate hike won’t fix the inflation it targets, the Fed’s tool works on demand and only demand. So the real question is where that demand is most exposed. Let’s take it in four steps.

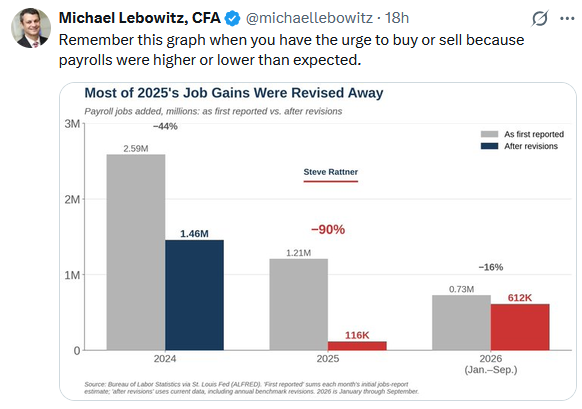
Tweet of the Day
Trading Rules With Desktop Printout
“Want to achieve better long-term success in managing your portfolio? Here are our 15-trading rules for managing market risks.”
Please subscribe to the daily commentary to receive these updates every morning before the opening bell.
If you found this blog useful, please send it to someone else, share it on social media, or contact us to set up a meeting.