Kevin Warsh spoke Friday at the IMF annual meetings in Bangkok. He gave little indication of whether the Fed would hold rates or increase them at the coming meeting on October 28. To that end, he said: “I don’t prejudge meetings,” noting at the September meeting the Committee “made very clear that we would deliver price stability, and we removed a dose of accommodation.”
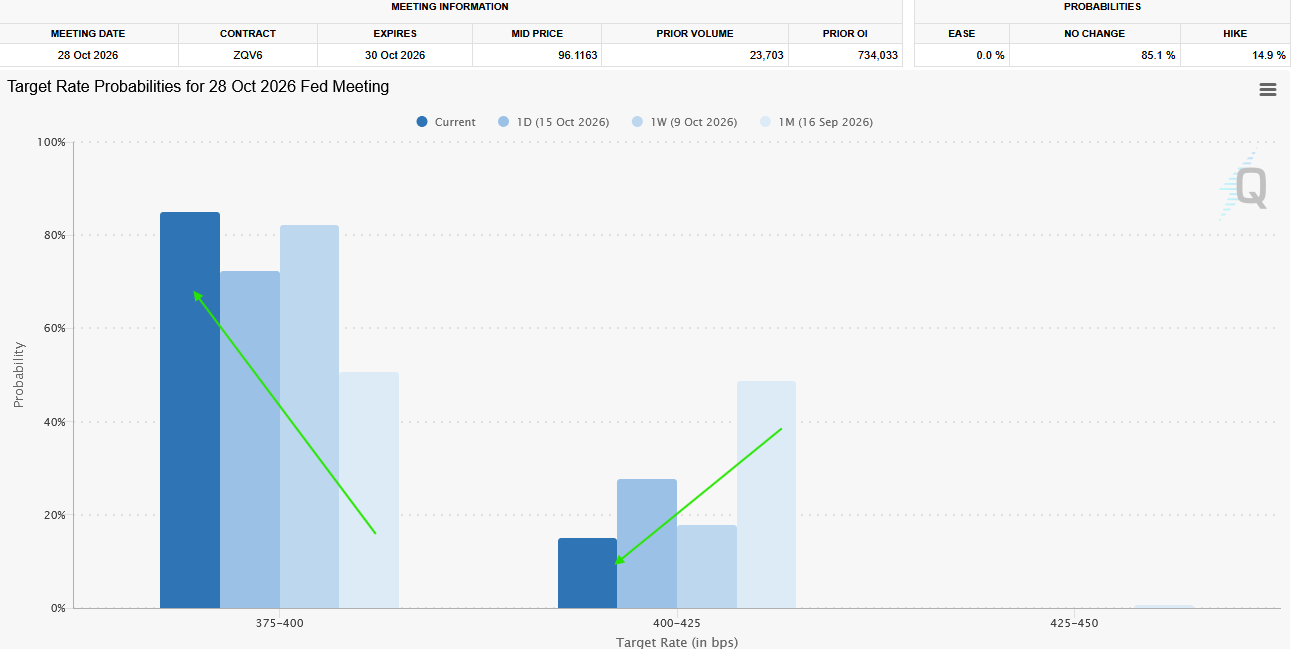
Markets treated the absence of a signal as a signal the Fed will hold rates steady. The odds of a hike fell from 28% to below 15% after his speech. Goldman Sachs concluded:
Alongside other recent comments from FOMC participants, Warsh’s comments indicate that the FOMC is set to pause in October, while still expecting a final hike in December.
What makes the market’s reaction to his speech notable is that the hold assumption comes after higher-than-expected inflation data. Warsh was more forthcoming on AI, calling it the most important innovation in the global economy in his lifetime and noting it is “obviously hitting the demand side of the economy before it’s going to hit the supply side.” Said differently, inflationary today, disinflationary tomorrow
Warsh has withheld guidance since taking the chair in May, and despite the market reaction after his speech, he left little for investors to warrant a “hold rates steady” conclusion. The graphic below shows how expectations shifted from a hike to a hold over the last four weeks.
What To Watch Today
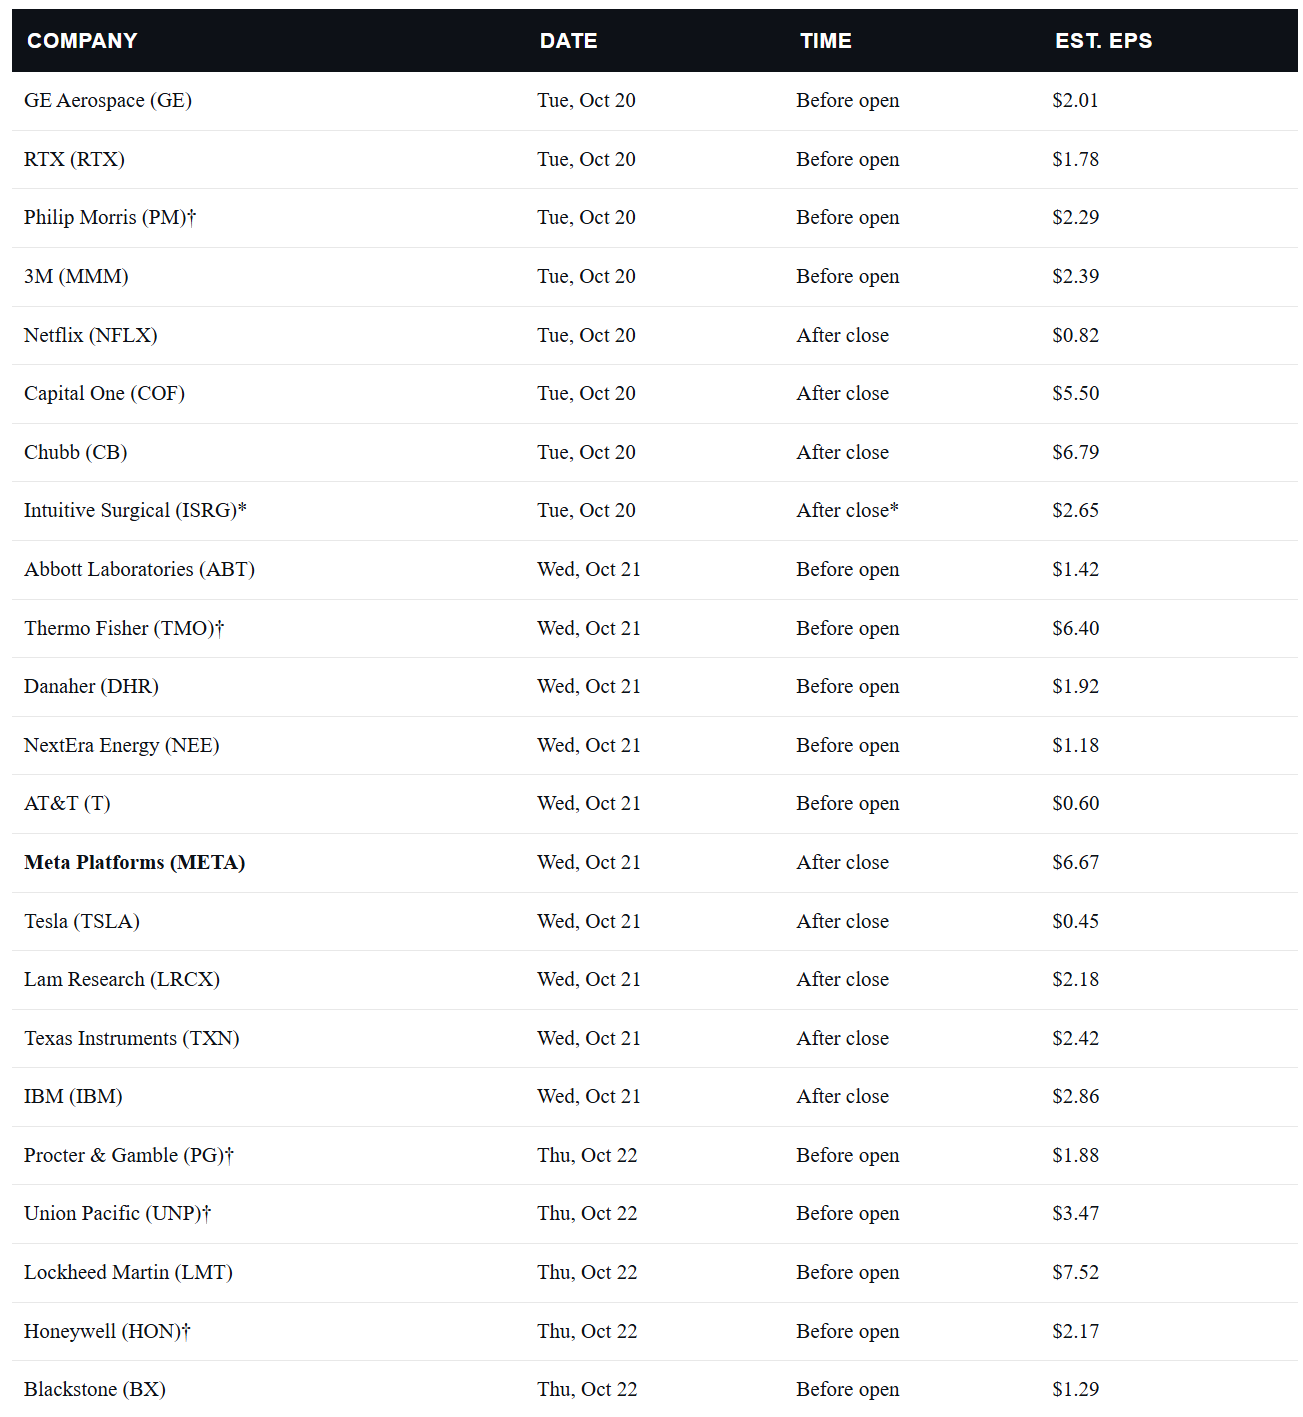
Earnings
Economy
Market Trading Update
Here is the part that last week’s headlines missed. The sell-off in Technology, particularly in AI adjacent stocks, was NOT a liquidation of everything. Staples rose 5.0%, energy 4.9%, and health care 3.5%, and the equal-weight S&P 500 actually gained 0.5% while the cap-weighted index fell 2.0%. As we warned in last week’s Bull Bear Report, technology was extremely extended above its long-term mean, and a growth-to-value rotation looked likely into year-end. That rotation arrived faster than expected. Bob Farrell’s Rule #2 says excesses in one direction lead to an opposite excess in the other, and a crowded AI trade is unwinding the way crowded trades always do.
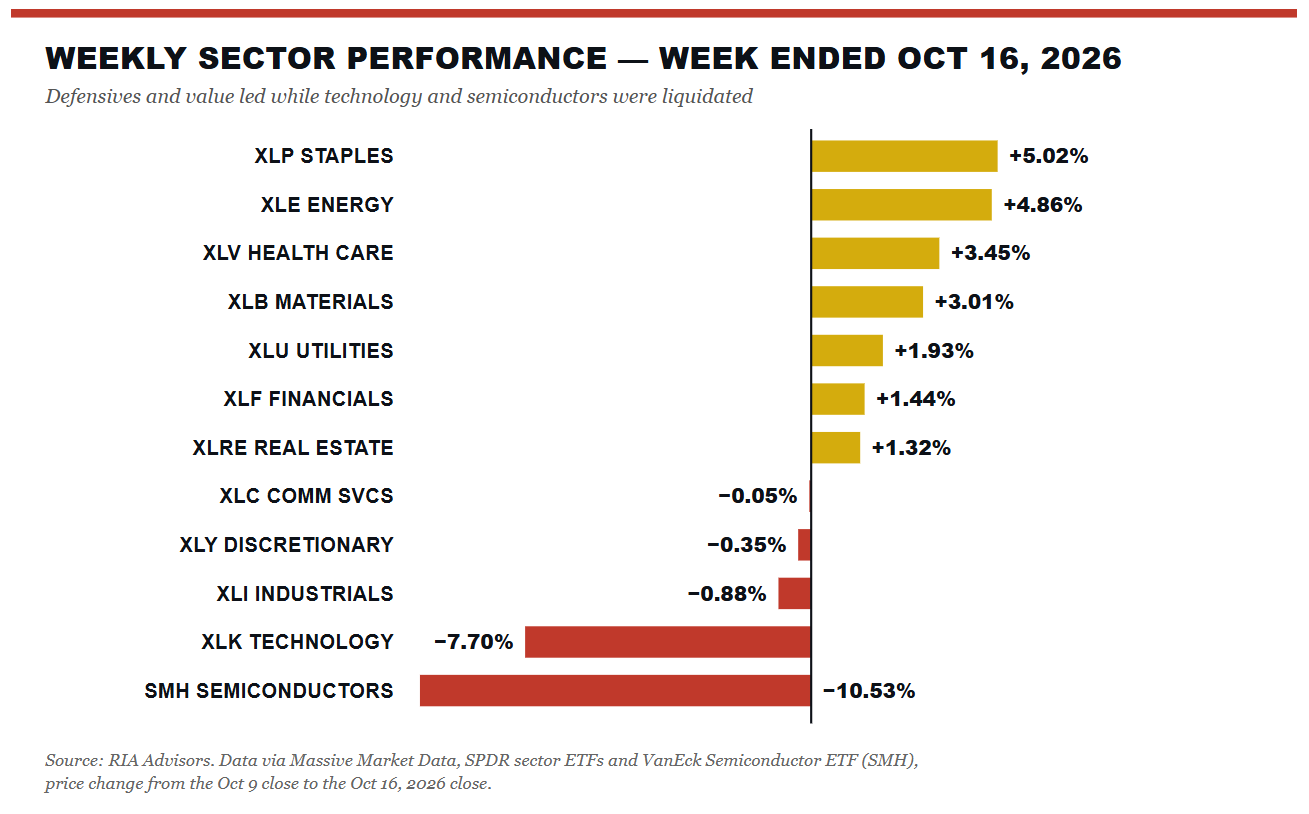
Does that set up a rally? Possibly. Positioning is cleaner, and Goldman puts hedge fund AI allocation at 26.1%, down from 31.7% in June. But the same Goldman note says this deleveraging is “closer to its beginning than its end,” with gross leverage still near five-year highs, of course, that note was before Friday’s selloff.
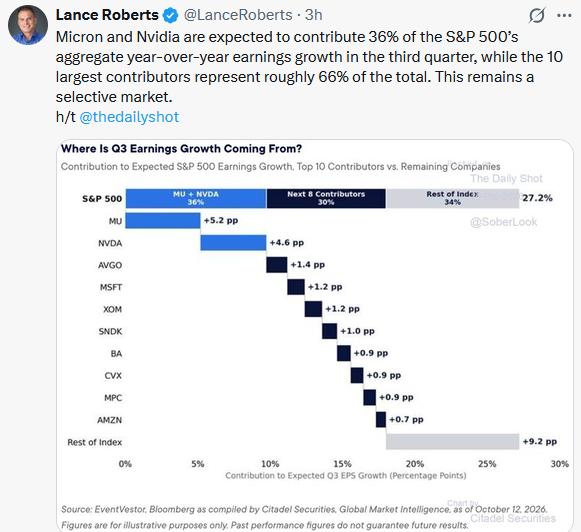
This week, earnings will be the swing factor. FactSet reports that 84% of companies have beaten estimates so far, yet the market is selling beats by 0.2% on average versus a normal 0.9% gain. The bar is high. Magnificent 7 earnings are expected to grow 33.2%, but excluding Nvidia and Meta, that drops to 7.5%. If defensives and value continue to catch bids while tech stabilizes, a reflexive bounce is likely. If the selling spreads into the equal-weight index, the problem is bigger than AI.
Looking at the technical setup, the S&P 500 closed Friday at 7,659.44, down 1.95% for the week and 2.0% below the October 6 record close of 7,818.93. More importantly, the index closed below its 50-day moving average (7,712) for the first time since September 30. It remains 5.3% above the 200-day moving average (7,276), so the longer-term uptrend is intact. The short-term trend is not.
Last week, we said a close below 7,700 would shift the near-term trend to neutral. That happened. Momentum confirmed it. The 14-day RSI fell to 43.8 from 59.9 a week ago. The MACD crossed below its signal line on Thursday, reversing last week’s buy signal. That’s a sell signal, but from a level that is far from oversold.
The Bollinger Bands frame the setup. The index now sits 1.47 standard deviations below its 20-day mean of 7,739, just above the lower 2 SD band at 7,631. Notice in the chart below that each of the last three closes below that lower band, on June 10, July 29 and September 16, marked a short-term low within a few sessions. The lower 3 SD band at 7,577 lines up almost exactly with the September 16 low of 7,567. That is the line in the sand.
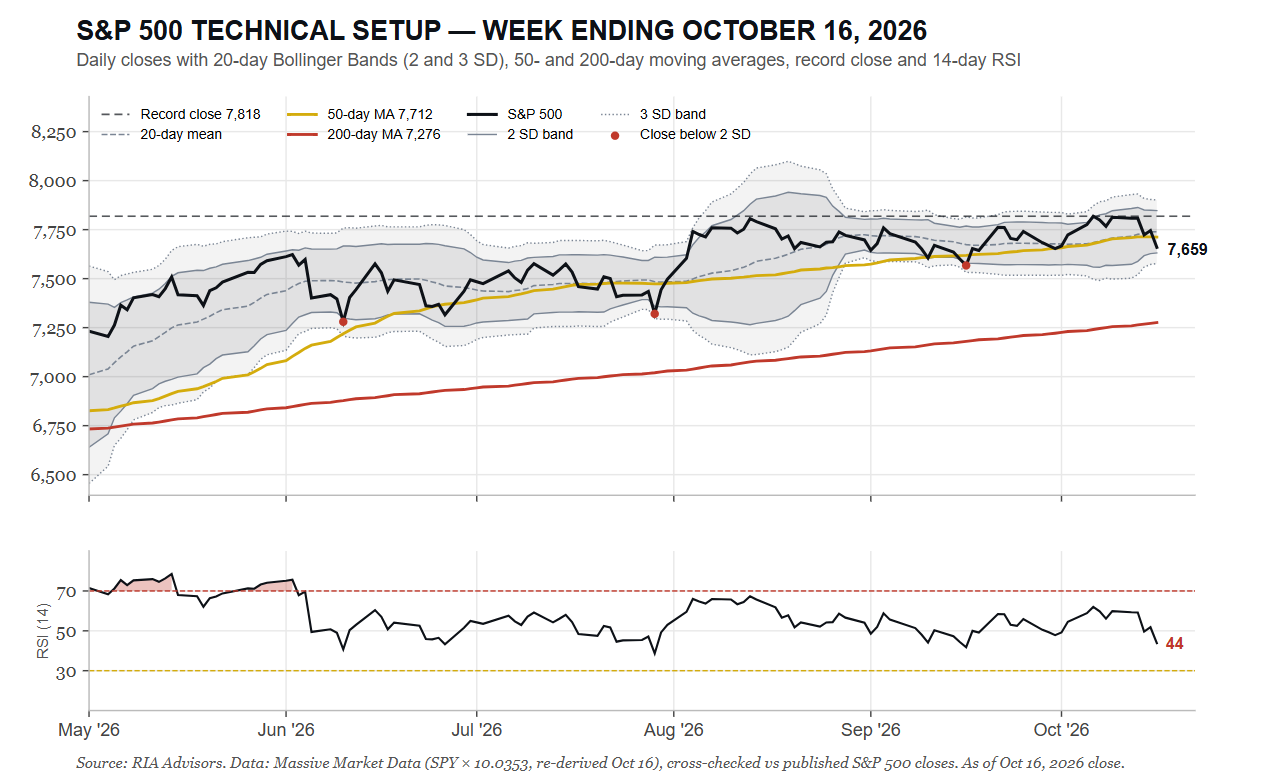
Breadth is the saving grace. The equal-weight S&P 500 rose 0.5% while the cap-weighted index fell 2.0%. Even late in Friday’s session, roughly 228 of the 500 members were higher on the day. The damage is in the largest names. Such is the difference between a rotation and a market where everything breaks at once.
On positioning, we made no trades this week. Two weeks ago, we trimmed technology exposure and added to value. We also harvested tax losses and rebalanced bond portfolios, slightly shortening duration to capture higher yields. That rotation did its job this week.
Don’t sell into the hole. A reflex rally toward the 50-DMA and the 20-day mean (7,712 to 7,739) is likely. Use it to rebalance rather than chase. A close below 7,567 is the signal to raise cash and add hedges. Below that, the 200-DMA near 7,276 is the next major support. Until Wednesday’s earnings clear, keep technology positions at or below target weights.
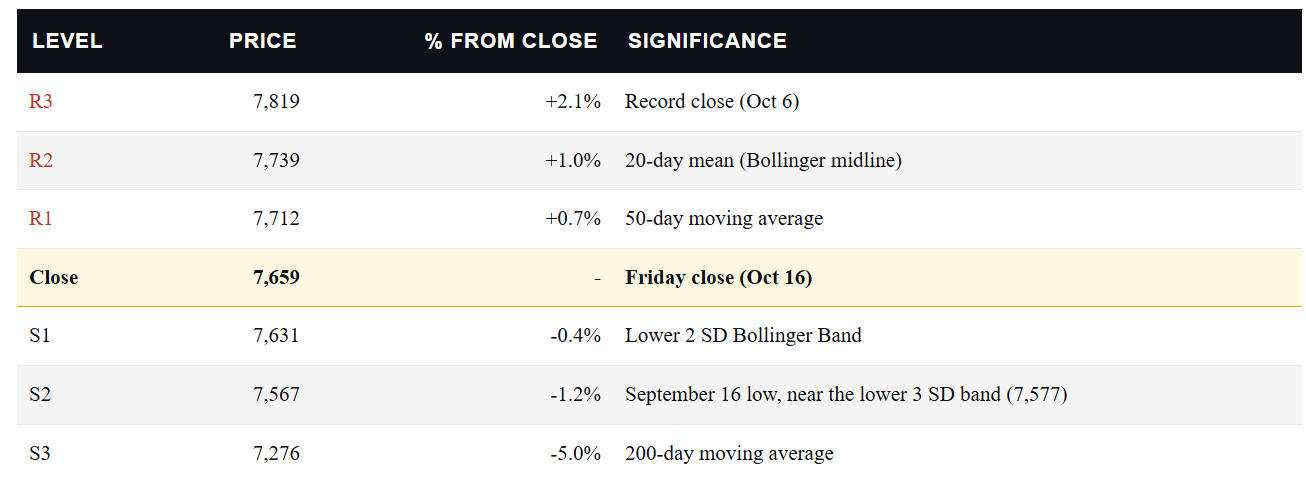
The single most important level next week is 7,567. Hold it, and this is a pullback inside an uptrend that sets up a tradeable bounce. Lose it on a closing basis, and the market is telling us the AI unwind has further to run.
The Week Ahead
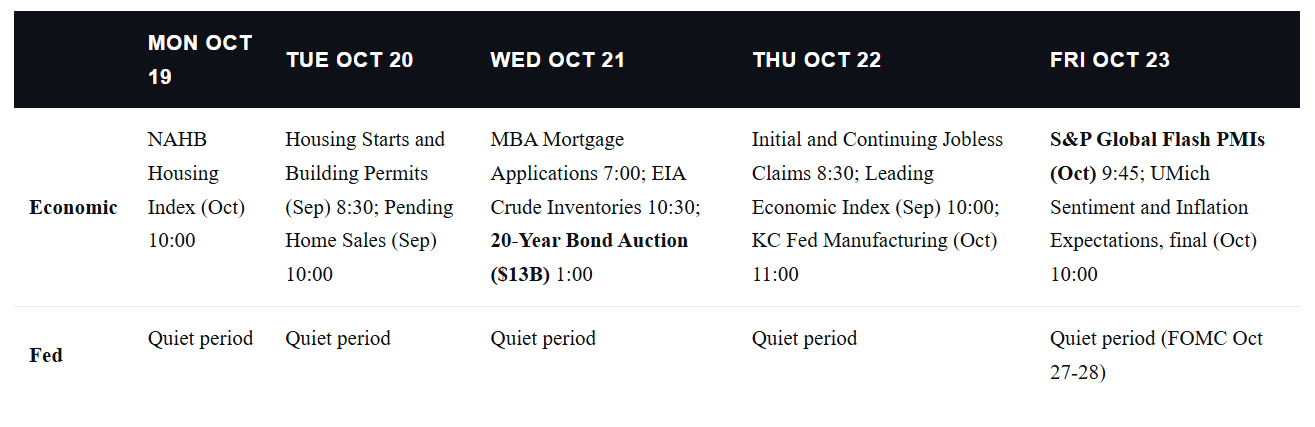
With the Fed entering its media blackout before the 10/28 FOMC meeting and little economic data on the slate, the market will likely focus on corporate earnings. Other than Tesla, the mega-cap stocks and most technology companies don’t begin reporting until next week.
372 companies report this week, with the largest names clustered on Tuesday and Wednesday. Tuesday morning features many industrials, including GE Aerospace, RTX, Northrop, and 3M. Netflix follows Tuesday after the close. Tesla, IBM, and Lam Research follow on Wednesday. Intuitive Surgical, Chubb, Abbott, American Express, and Bloom Energy fill out the week.
With no Fed speakers scheduled during the blackout period ahead of the October 27-28 meeting, fed funds futures and the Treasury curve provide the only guidance on what the FOMC may do. After spiking post-CPI, hike odds fell back to 15-20%, down from roughly 70% a month ago. Accordingly, the risk is asymmetric — there is far more room to reprice higher than lower. Watch the two-year in particular, since it carries the most direct read on the next few meetings.
Bad Inflation Cures Itself: Good Inflation Doesn’t
There is a general framework to inflation, and it is older than any of us. Prices can rise because buyers are bidding for scarce goods with money they’ve actually earned. Or prices can rise because the cost of producing something has jumped for reasons unrelated to demand. An oil embargo will do it, as we saw in the 1970s. So does a shuttered Strait of Hormuz, a new tariff schedule, or a pandemic that takes half the world’s shipping capacity offline for eighteen months.
This is an important point for the “debasement” crowd, whose narrative overlooks the underlying fundamentals.
“The following economic illustration is taught in every ‘Econ 101’ class. Unsurprisingly, inflation is the consequence if supply is restricted and demand increases via monetary interventions.”

However, there is a very important distinction to be made about inflation. The first type is the “good” kind of inflation, and it is genuinely good. Demand pushes prices up; firms book wider margins; tight labor markets funnel those margins into paychecks, and the higher paychecks fund the higher prices. The loop closes and becomes self-reinforcing because every leg of it is paid for by real output.
The second kind, the “bad” kind of inflation, closes nothing. A tariff is a tax, just like an oil shock is a tax. Somebody’s cost went up, and the money has to come out of a budget that did not grow. Every dollar of that price increase is a dollar not spent somewhere else. Bad inflation doesn’t create the income that pays for it, so it destroys the demand that supports it. Such is the mechanism behind the oldest saying in commodities: “high prices cure high prices.”

Tweet of the Day
Trading Rules With Desktop Printout
“Want to achieve better long-term success in managing your portfolio? Here are our 15-trading rules for managing market risks.”
Please subscribe to the daily commentary to receive these updates every morning before the opening bell.
If you found this blog useful, please send it to someone else, share it on social media, or contact us to set up a meeting.