
The stock-bond correlation broke twice in four years for the same reason, and both times the cause was inflation from the supply side. When that kind of inflation fades, the hedge comes back, and last week was the first look at it.
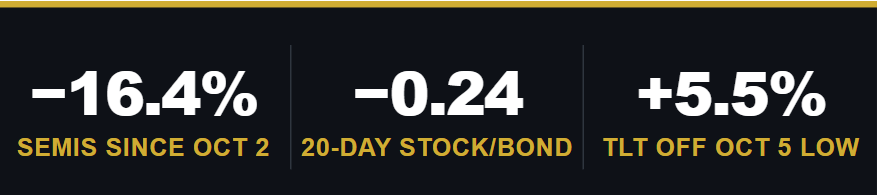
- The tech rout just needed a reason. On October 2, the technology ETF sat 7.3% above its 50-day average, and we had already rotated toward value. Meta supplied the trigger, and semiconductor stocks have now fallen 16.4% over three weeks.
- Bonds have failed as a hedge for most of 2026, and oil is why. Since March, SPY and long Treasuries have mostly fallen together, as headline CPI has climbed from 2.4% to 3.7% while core CPI has barely moved.
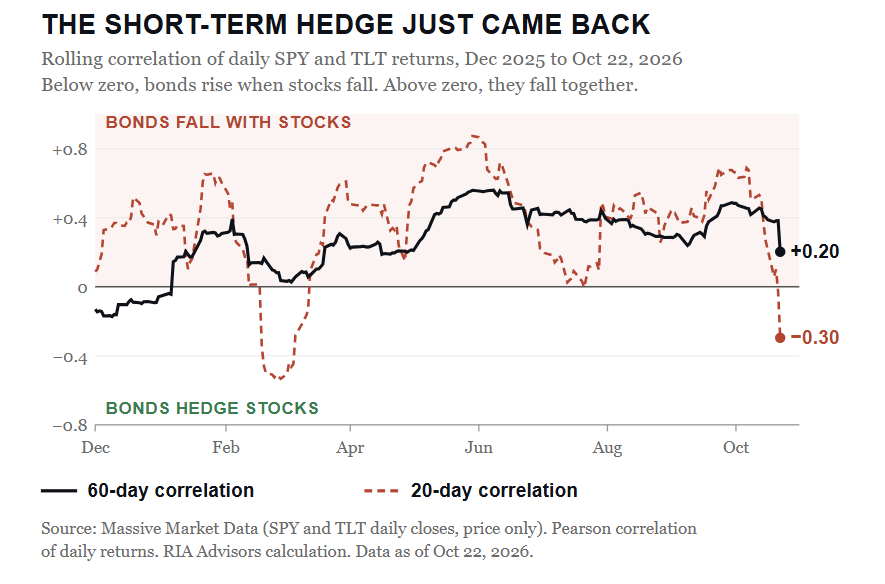
- The short-term hedge just flipped back. The 20-day correlation between SPY and TLT ended the week at −0.24 after touching −0.30 on Thursday, its lowest reading since early March.
🏛️ Market Brief – Earnings Season Opens On A Raised Bar
The headline reason for this week’s tech rout was Meta. The company beat earnings estimates, then reported its first cash outflow in more than a decade as AI spending outpaced cash inflows. It also announced a two-for-one split and will issue non-voting shares to help fund the buildout. The stock fell 7% on Thursday, and the Philadelphia semiconductor index dropped 6.7%. The Nasdaq Composite had its worst day since early June. Friday added oil to the pile, with Brent settling at $116.72, a six-month high. The S&P 500 finished the week at 7,623.68, down 0.4% and its second straight weekly loss. The Dow, oddly enough, gained about 1.4%.
If you only paid attention to the headlines, you’d think Meta’s cash flow statement broke the “AI story” overnight. It didn’t. This is always the problem with “media headlines.” The media quickly suggested that Meta was the explanation for the selloff after the fact. It is the kind of headline that gets attached to a move once the move has already happened and everyone needs a story to explain it. However, in reality, the selloff didn’t need Meta. It just needed a reason, and Meta happened to supply one.
I say this because the setup was already in place three weeks ago. In the October 6 Daily Market Commentary, we wrote that “technology is very overbought” and that tech allocations sat in the 96th percentile of the past five years. That’s why we rebalanced the ETF Sector Rotation Model toward value and took profits in the growth factors. The numbers backed it up. On October 2, the technology ETF (XLK) sat 7.3% above its 50-day moving average with an RSI near 69. The semiconductor ETF (SMH) was 10.7% above its 50-day. As Bob Farrell’s Rule #1 reminds us, markets tend to return to the mean over time. They usually do it faster than anyone expects.
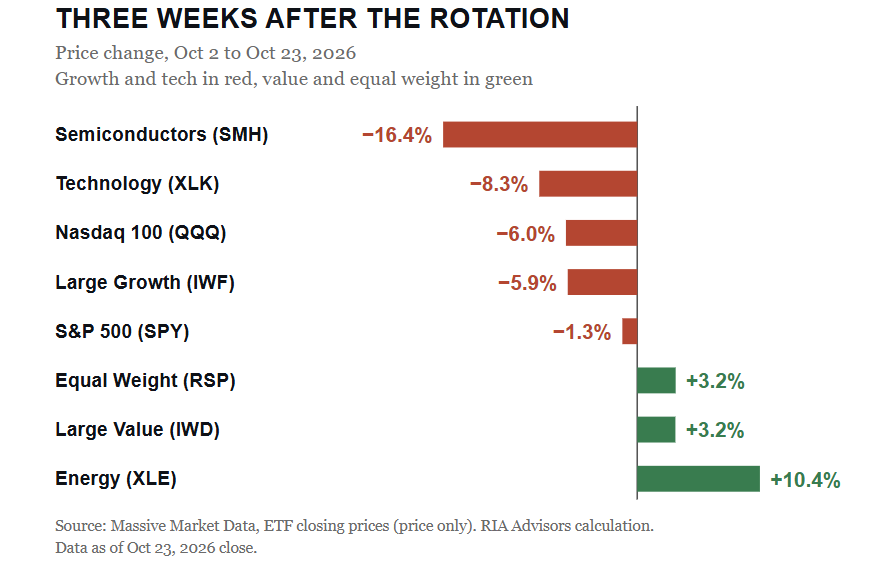
Since that rotation, SMH has fallen 16.4%, XLK has fallen 8.3%, and the Nasdaq-100 ETF has lost 6.0%. On the other side, the equal-weight S&P 500 and large-cap value both gained 3.2%, and energy rose 10.4%. That’s rotation, not a broad liquidation.
Here’s the part that matters for what comes next. Tech is starting to get decently oversold. XLK’s RSI has dropped to 38, and the ETF sits 3.4% below its 50-day average. SMH and communications (XLC), home to Meta and Alphabet, both have RSIs of 33. Those aren’t washout readings yet, but they’re close. Meanwhile, the defensive trade that worked so well is getting crowded, with energy’s RSI at 69 and the ETF 7.8% above its 50-day. Cross-asset, the 10-year Treasury yield ended near 4.99% after Thursday’s bond rally, the VIX closed at 19.70, and bets on an October rate hike faded.
Such is the nature of rotations. They feel like a crisis in the sector being sold and a sure thing in the sector being bought, right up until the positioning flips. Next week, the Fed and the biggest names in tech will decide whether this oversold bounce has a reason of its own.
📈Technical Backdrop – MACD Turns Up Just Below The Record
The S&P 500 closed Friday at 7,623.68, down 0.4% for the week. That leaves it 2.4% below its October 6 record close near 7,815. The index sits 1.0% below its 50-day moving average of 7,702 and is resting right on its 100-day average of 7,605. It remains 4.5% above the 200-day average at 7,293, so the longer-term uptrend is intact. Friday’s close also landed just above the lower 2-standard-deviation Bollinger Band at 7,604. Closes below that band marked short-term lows in March, June, late July and mid-September this year. In the October 19 Before the Bell, we flagged a short-term momentum sell signal and a test of the 100-day. That test is here.
Investors should pay close attention to market momentum, which currently confirms the selling pressure. The 14-day RSI sits at 42, neutral and still falling. The MACD has also crossed below its signal line, a “sell signal” that tends to cap near-term rallies until it reverses.
More importantly, neither reading is at more extreme oversold levels, which means the broad index hasn’t finished correcting the way tech has. That divergence is the story investors should pay the most attention to. Equal weight rose 1.1% this week, and the Dow gained 1.4%. The average stock is holding up while the mega-caps drag the cap-weighted index lower.

Furthermore, sector breadth tells the same story from a different angle. Three weeks ago, only three sectors were ahead of the index. As of Friday, 8 of 11 sectors are ahead of the index, measured by distance from their 50-day averages. Only technology, industrials, and communications are lagging. Energy is the most stretched, followed by health care and staples. The leaders have become the crowded trade, and the laggards are where a bounce would come from. That runs counter to the defensive posture that worked over the last three weeks, and it’s why we’re watching for a chance to rebalance back toward growth rather than adding to the winners.

However, next week will be the test for the market. Roughly 44% of the S&P 500 reports earnings, including Microsoft and Alphabet on Wednesday and Amazon on Thursday, on top of a Fed decision and the September PCE report. That’s a lot of information hitting a market that’s sitting on support. If the 100-day holds and the mega-caps show that AI spending is producing a return, oversold tech has room to rally. The first stop is the 50-day near 7,700, with the October 21 close at 7,757 just above it. If the 100-day breaks, the September 16 low at 7,564 is next, followed by the July 31 low near 7,494. The 200-day at 7,293 is where the bull trend gets questioned in earnest.

So, what should you be preparing for ahead of next week? Well, the playbook is actually quite simple. Don’t chase the defensive sectors at these levels. Look at taking some profits in stretched energy and staples positions. Then let tech reach a real oversold extreme before rebalancing toward growth. That means an RSI near 30 and closes below the lower band. Keep stops below the 200-day average. A rally into the 50-day is likely to see selling, so use strength to rebalance rather than to add risk. The most important level next week is the 100-day average at 7,605. Where the market closes relative to it after Microsoft and Alphabet report will set the tone into November.
🔑 Key Catalysts Next Week
This is the busiest week of the earnings season, and it collides with the Fed. Roughly 44% of S&P 500 companies report, and the three that matter most for the tech trade come in a 24-hour window. Microsoft and Alphabet report after Wednesday’s close, and Amazon follows Thursday evening. After Meta, the question is no longer whether these companies are spending on AI. The question is whether the spending is starting to show up as cash, and the market just told us it won’t give anyone the benefit of the doubt. Visa and Mastercard provide a read on consumers, and Exxon and Chevron report Friday, with Brent above $116. Apple doesn’t report until November 2.
The Fed announces its decision Wednesday at 2:00 p.m. ET, with Chair Kevin Warsh’s press conference at 2:30. Markets widely expect a hold at 3.75% to 4.00% after September’s hike. Bets on a move faded after Thursday’s bond rally. The risk is in the tone. A hawkish Warsh with Brent at a six-month high could push the 10-year back above 5%, which is exactly what oversold tech doesn’t need. The blackout period means no Fed speakers until St. Louis Fed President Alberto Musalem on Friday at 12:30 p.m. ET.
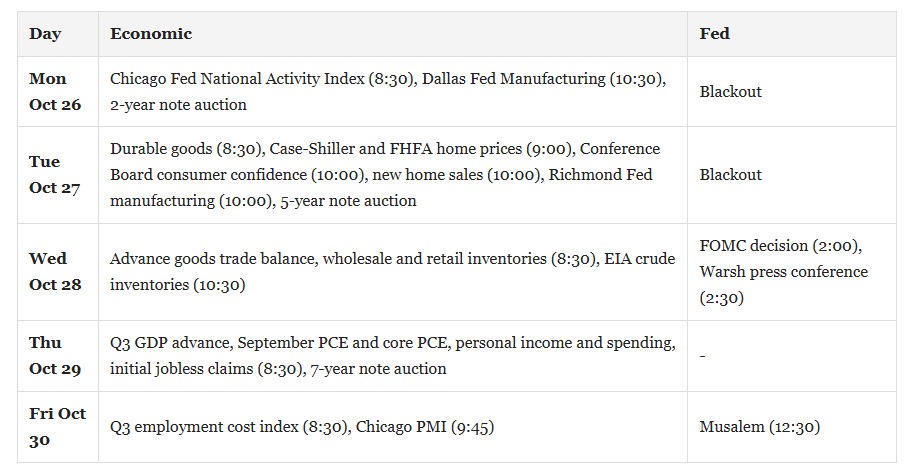
Thursday is the heaviest data day. Third-quarter GDP is expected to be near 3%, and the September PCE report is expected to show headline inflation rising to 3.6% from 3.4%, with core inflation at 3.1%. Friday’s employment cost index is the cleanest read on whether this inflation is moving into wages. If it isn’t, the “bad inflation” argument holds, and the case for the Fed staying on hold gets stronger. Tuesday’s consumer confidence report, last at 81.9, will show how much $116 oil is weighing on households. Thursday’s 7-year auction also matters with yields near 5%.
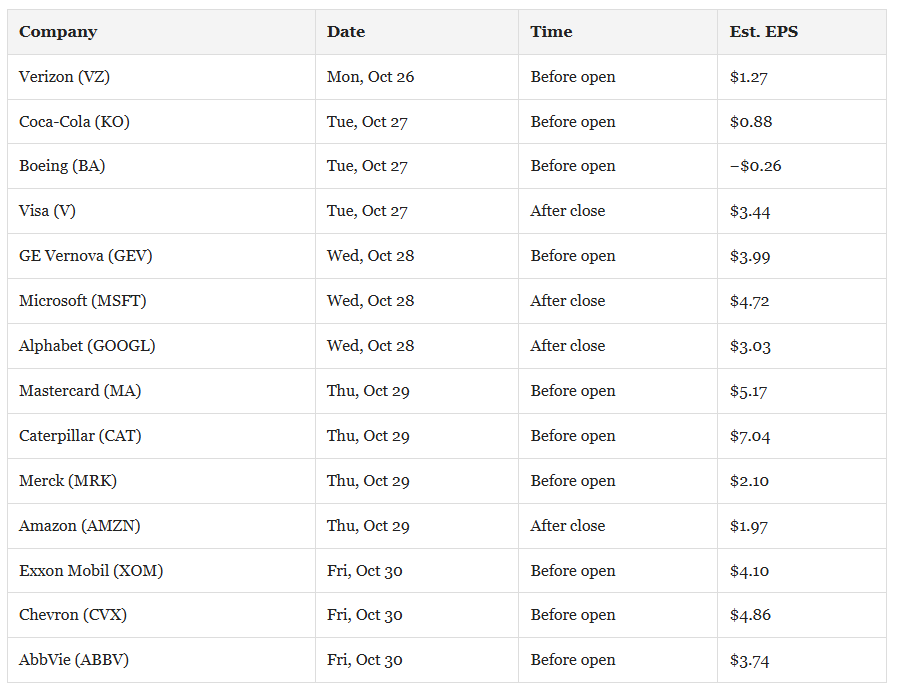
The most market-moving event is the Microsoft-Alphabet pair on Wednesday night, landing a few hours after the Fed. The asymmetry favors the bulls more than it did a month ago. With tech already down sharply and getting oversold, the bar is lower, so a credible answer on AI returns could spark a sharp short-covering rally, while another Meta-style reaction would push the S&P through its 100-day average and into the September lows.
Need Help With Your Investing Strategy?
Are you looking for comprehensive financial, insurance, and estate planning services? Need a risk-managed portfolio management strategy to grow and protect your savings? Whatever your needs are, we are here to help.

💰 Stock-Bond Correlation: Oil Broke The Hedge. Oil Will Fix It.
On Thursday, the S&P 500 ETF fell 1.2% and long Treasuries rose 1.9%. A week earlier, in the five sessions ended October 16, the S&P 500 lost 2%, the Nasdaq 100 ETF lost 5.5%, and the semiconductor ETF fell 10.5%, while TLT gained 2.7%. That’s the stock-bond correlation behaving the way every 60/40 portfolio assumes it will. The problem is that this year it’s been the exception. Over the past year, SPY gained 15.2% while TLT lost 12.8%. In August, I argued that ditching bonds is the wrong move because “what bonds protect you against is a growth shock.” The last two weeks were a growth scare. Most of 2026 was something else.
The Hedge Everyone Counted On Quit In 2022
For two decades, investors took the hedge for granted. A Federal Reserve paper published on October 16 puts numbers on it. Fed economists Canlin Li and Emre Yoldas measured the correlation between U.S. stock returns and changes in the 10-year yield. It ran +0.40 from 2000 to 2021 and −0.09 since. Yields move opposite to bond prices, so in plain terms, bonds reliably rose when stocks fell for twenty years, and then they stopped. The paper also found that 10-year yields now react about three times as much to inflation surprises as they did from 2000 to 2019.
In the chart below, I rebuilt the stock-bond correlation with weekly returns for SPY and TLT, so the charts below read the same way as our Daily Market Commentary. Below zero, bonds hedge. Above zero, they fall with stocks. From 2017 through 2020, the correlation ran −0.23. Then it flipped to +0.13 in 2022, +0.36 in 2023, and +0.24 in 2024. A hedge that only works when inflation is quiet isn’t one you can set and forget. In 2022, the S&P 500 fell roughly 25% on a weekly closing basis while TLT fell 31%. Both halves of the “balanced” portfolio lost at the same time.
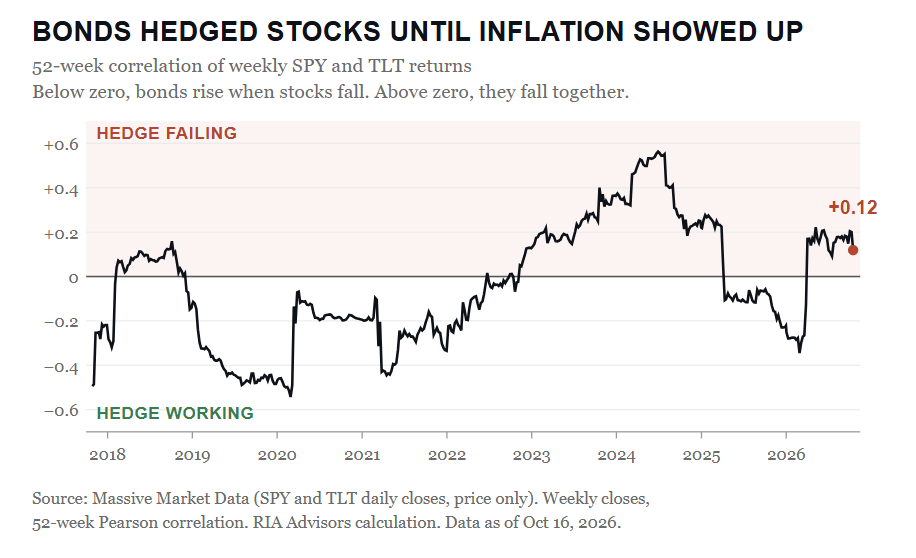
However, this is the part the “bonds are dead” crowd skips: when inflation cools, the hedge from bonds returns. From April 2025 through February 2026, the correlation ran −0.24. Then the spike in oil over this summer broke it again. As shown, from March through mid-October it ran +0.18, and the 10-year yield climbed from 4.18% at the start of the year to 5.31% on October 5th.
The chart below shows inflation over the same period. In February, headline CPI rose from 2.4% to 3.7% in September. Simultaneously, Core CPI went from 2.5% to 2.6%. That is clear evidence of a supply shock: prices rise because something got scarcer, not because the economy is running hot. The Fed paper lands in the same place. Bonds’ value as a hedge depends on the inflation environment and the type of shock, not on anything fixed about bonds.

The Short-Term Signal Just Flipped
The annual numbers move slowly. The daily ones don’t. We dug into this in Friday’s Market Trading Update, and the turn is showing up faster than the 52-week data can capture. The 60-day correlation between SPY and TLT climbed from near zero in February to +0.56 in early June, which is about as bad as a hedge gets. The 20-day correlation slipped below zero on Wednesday for the first time since July. After Thursday’s session, it sits at −0.30.
“A hedge that only works some of the time isn’t a hedge. It’s just another position.” – Meta Splits: The Buyback Machine Shifts To Reverse.
(Note: Read the full Market Trading Update for the TLT chart and the two signals we need to see before adding duration.)
The two signals that we discussed are 1) TLT closing above its 50-day moving average, and 2) the 20-day correlation staying negative. If both signals are triggered, it suggests investors can extend duration back toward the target weight in our allocation models. On Thursday, TLT closed at $81.74, above its 50-day average of $80.58, with the 20-day correlation at −0.30. Both boxes are checked for now. One close isn’t a trend, though, and the 200-day average still sits near $84.81, roughly 4% higher.
Drawdowns Are The Only Test That Matters
Correlations are averages, and nobody owns bonds for an average week. You own them for the weeks when stocks get hit. So I went back through every meaningful S&P 500 drawdown since 2018 and checked what long Treasuries did during each one.
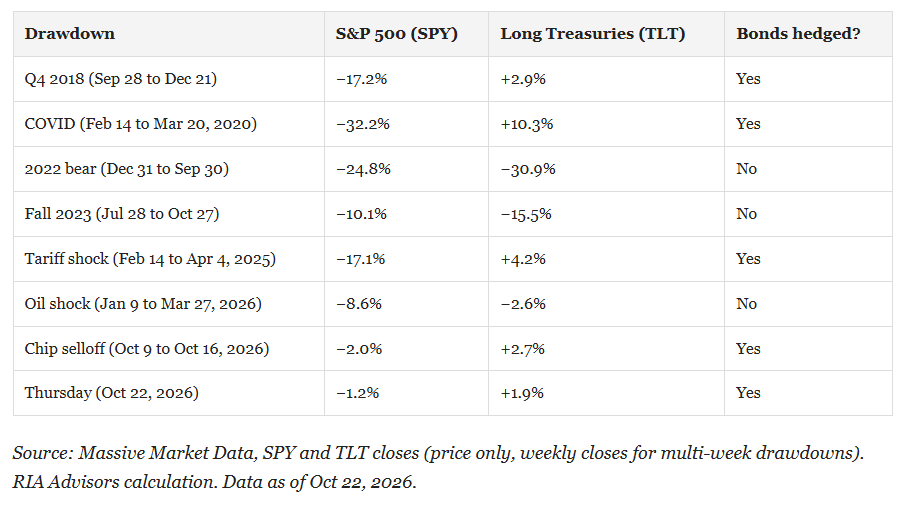
That is the pattern, and it’s hard to miss. When the market began to fear slower growth, yields fell, and bonds paid. When inflation was the prevailing fear, yields rose, and bonds fell right along with stocks. Pay attention to the last two rows. Those outcomes are specifically due to growth scares, not inflation scares, and that matters because a hedge that shows up when earnings and spending are the worry is still alive even after a year of losing money.
Why Bad Inflation Hands The Hedge Back
This brings us to our analysis from last week on “Good vs Bad Inflation” and the underlying framework. This is where my bad inflation framework comes in. Inflation from a supply shock tends to burn itself out because there is no rising income to pay for it. Higher gasoline prices don’t come with a raise attached. Consumers cut back elsewhere, demand cools, and the price spike chokes off the growth that would have sustained it. Lacy Hunt at Hoisington has made a version of this argument for decades. Heavily indebted economies slow down under pressure. They don’t overheat.
Bonds do NOT hedge inflation. They hedge the slowdown that bad inflation eventually causes.
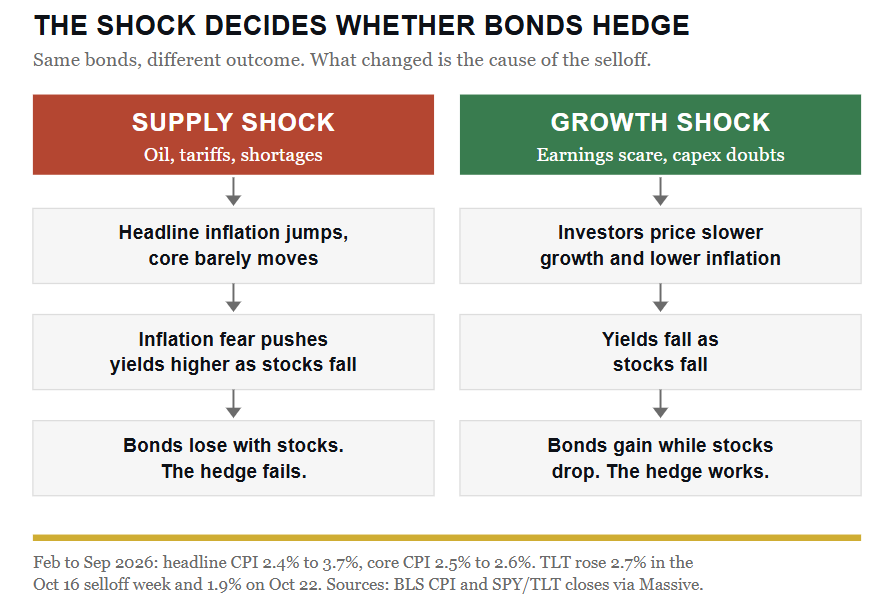
“Inflation is back at 3.7%. Why would anyone own bonds?” That one shows up in my inbox every time CPI runs hot. The answer is that bonds were never an inflation hedge. They’re a hedge against the growth damage a supply shock eventually causes, which is exactly what the last two weeks started to price.
The “bond bears” still have a point, and it deserves a direct answer. If the oil shock persists and the Fed hikes into it at the October 27 to 28 meeting, yields can rise further while stocks fall, which is the 2022 playbook. A 10-year yield above 5% also means long-duration bonds carry real price risk if inflation surprises again, and as I noted in Druckenmiller Warning: The Bond Market Already Priced It, Treasury buybacks are too small to set long-end yields. I’m reasonably confident the hedge strengthens over the next six to twelve months as the energy shock fades. In the next few weeks, I’m much less sure, because the Fed meeting is hard to call and oil hasn’t rolled over yet.
What Should Investors Do Now
Don’t abandon the bond sleeve because 2026 has been hard on it. Size it for the job it does well, and don’t ask it to fight inflation shocks. Here’s how we continue to suggest thinking about it:
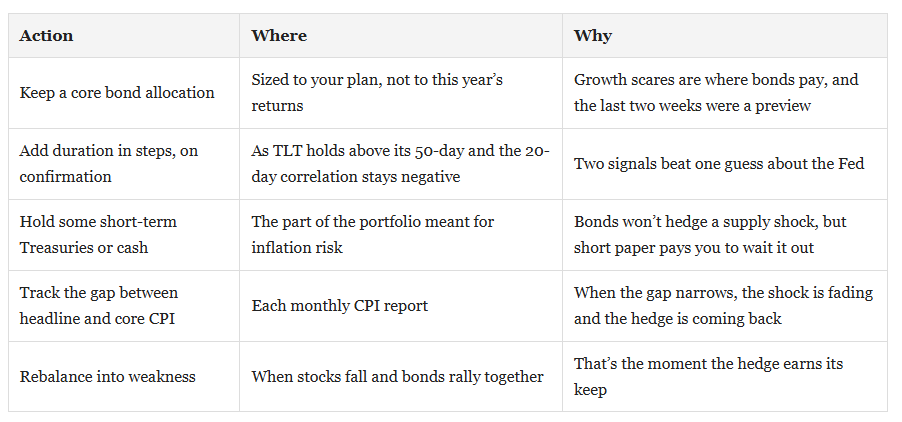
The stock-bond correlation isn’t broken in any permanent sense. It’s following the cause of the inflation, the same way it did in 2022 and again in 2025. The bond market will tell you the oil shock is over before the CPI report does.
🖊️ From Lance’s Desk
This week’s #MacroView blog explores why the economy is running bad inflation, and the bad kind is the temporary kind, which is precisely why the bond market refuses to panic.

Also Posted This Week:
- Are Bonds Pricing In A Fed Policy Mistake? – RIA– by Michael Lebowitz
- AI Capex And Earnings: What Happens When Growth Slows– by Lance Roberts
📹 Watch & Listen
Stocks are under pressure despite strong earnings from major technology companies. With S&P 500 futures falling and the Nasdaq facing renewed selling, are investors preparing for a market correction, or is a breakout approaching?
Subscribe To Our YouTube Channel To Get Notified Of All Our Videos
📊 The Weekly Market Dashboard
Weekly technical overview across key sectors, risk indicators, and market internals

💸 Market & Sector X-Ray: Market Gains Ground
This next week, 44% of the S&P 500 will report Q3 earnings. So far, reports have been good, but the market response has been weak. I suspect we could see some more of that action next week, as the technology sector remains under some pressure. However, on a short-term basis, technology is very oversold, while Energy and Real Estate are the most overbought. As noted previously, the neep oversold condition in bonds warned of a reversal which happened this past week.
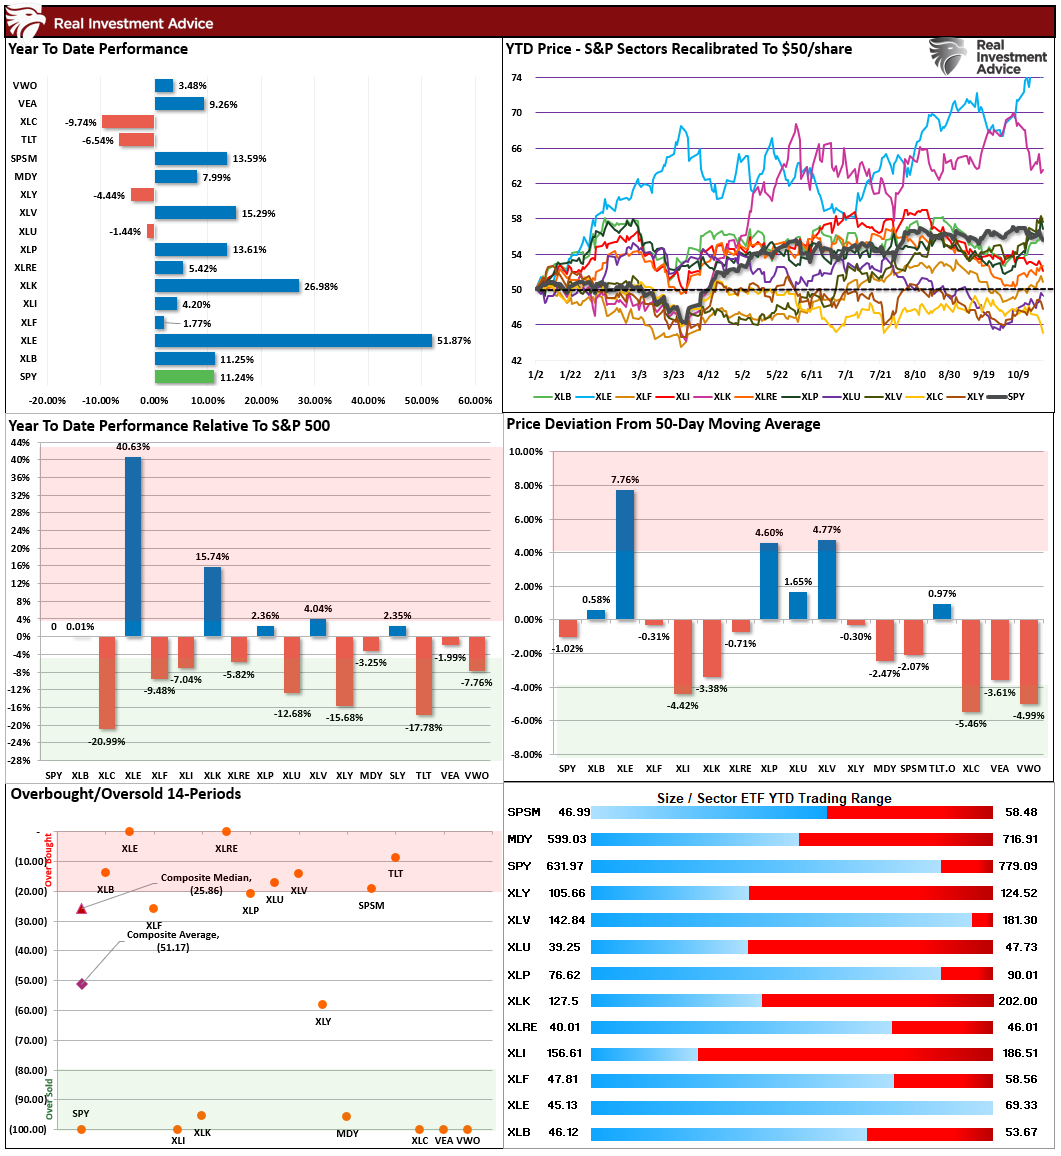
📐 Technical Composite: 58.32 – Sell-Off Reduces Overbought Conditions
The technical condition eased sharply last week dropping from 70.49 to 58.32 as the technology sector came under selling pressure. However, the reduction only brings the overbought condition back to neutral. While rallies can occur from these levels, if this is the beginning of a more severe correction, then markets have more work to do to the downside. Rebalance risk and remain tactically cautious until conditions improve.
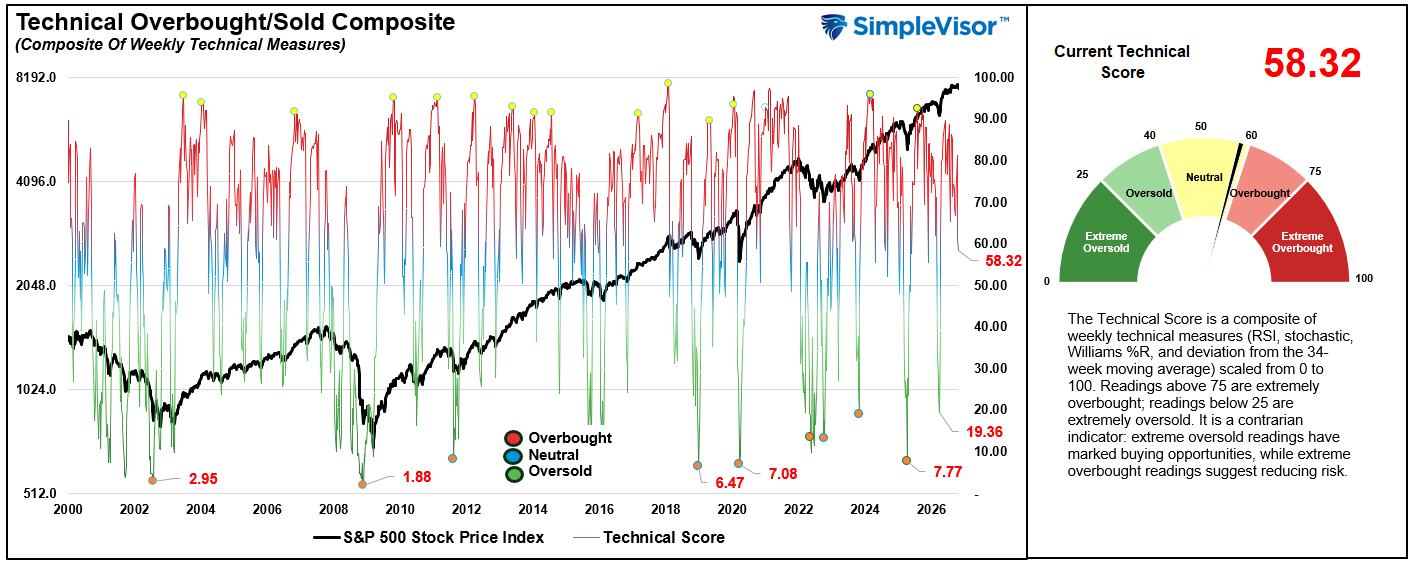
🤑 Fear/Greed Index: 54.87 – Holding At Neutral
Even though the market sold off last week, the underlying market allocation and sentiment remain more neutral. There was a continued drop in the Commitment of Traders equity allocations; however, investor sentiment turned slightly more bearish last week. If the market can continue to hold up into earnings season, it could present a good buying opportunity over the next month or so.
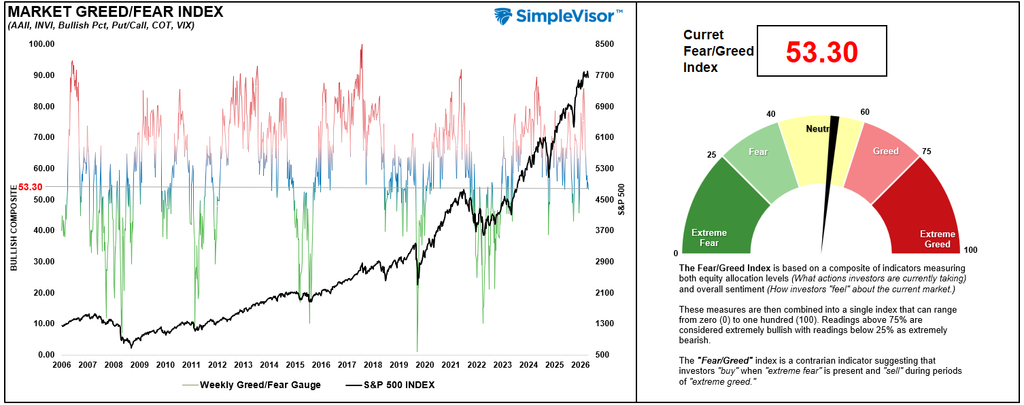
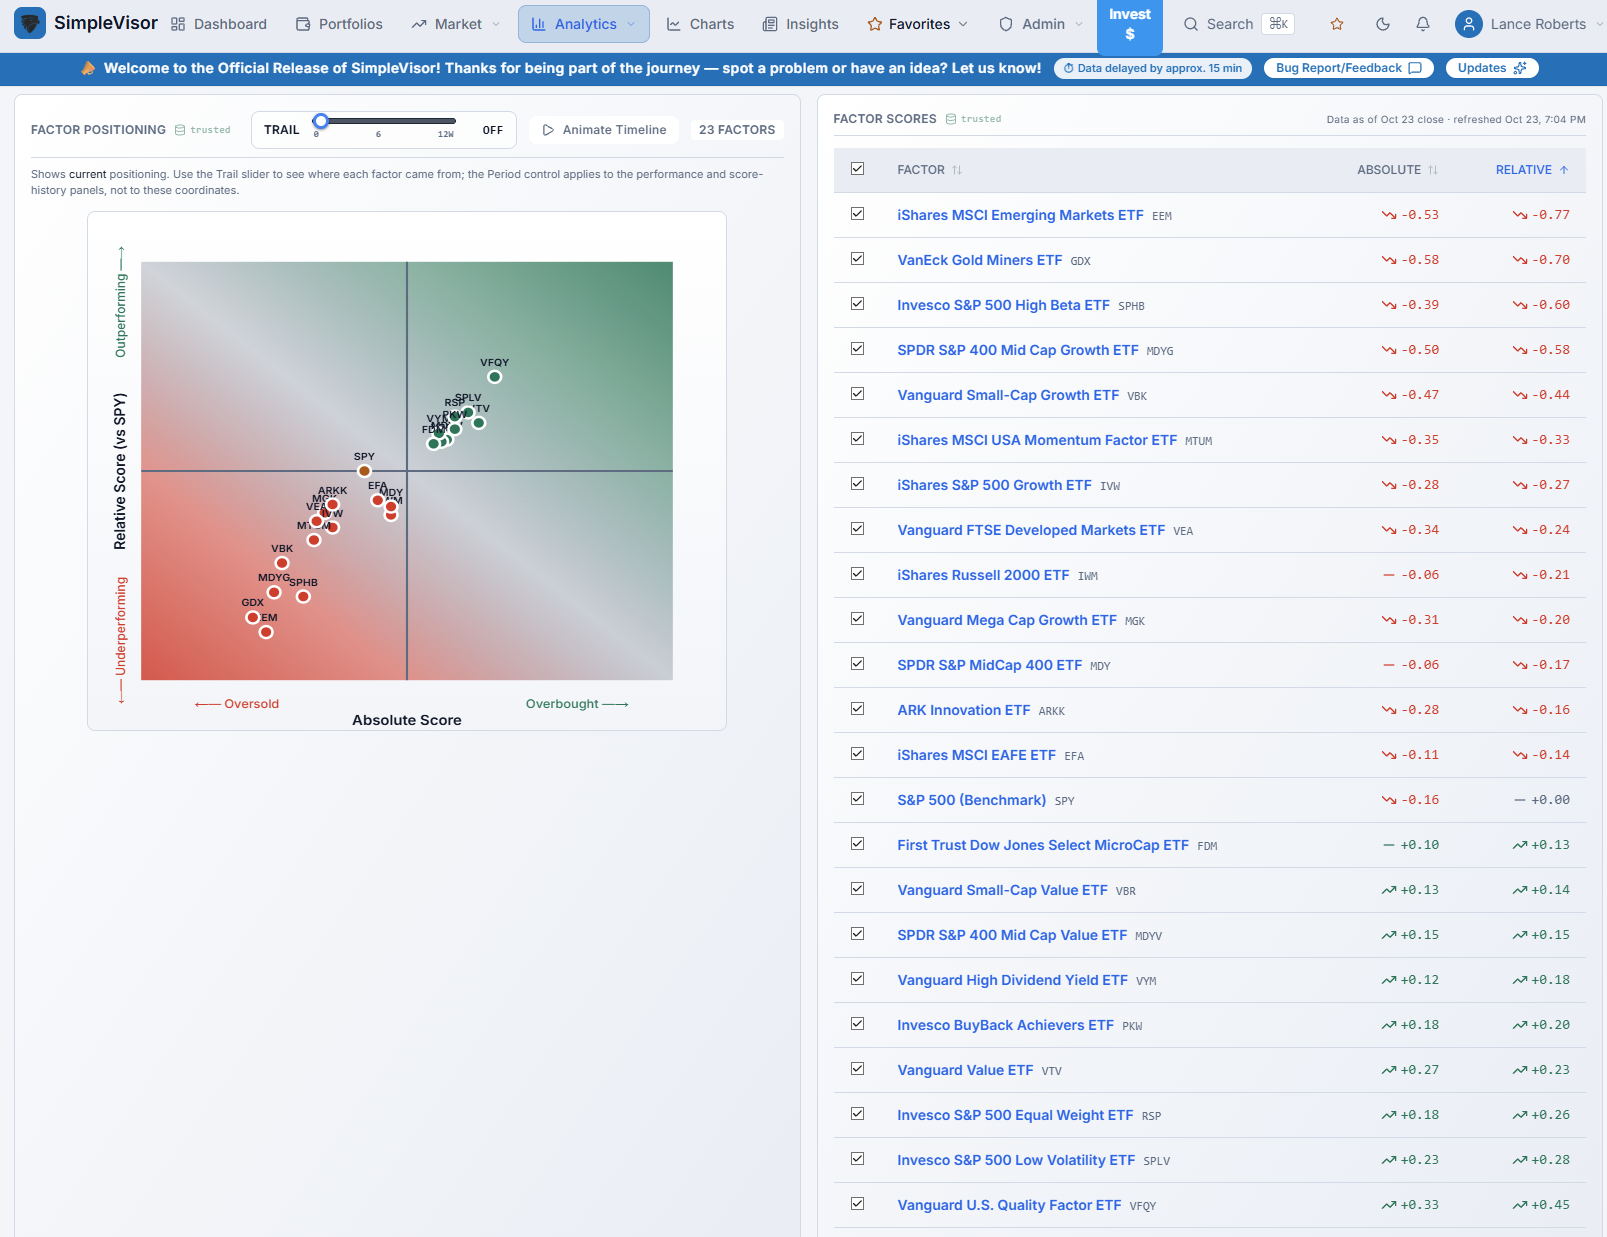
🔁 Relative Factor Performance
Three weeks ago we warned that the more extreme divergence growth from value in the market was due for an eventual rotation. That rotation came rather swiftly over the past two weeks and now those value oriented factors are more overbought and growth is oversold. While there may be a bit more work next week, we are getting potentially set up for a rotation in the other direction, buy growth and reduce value, heading into year end.
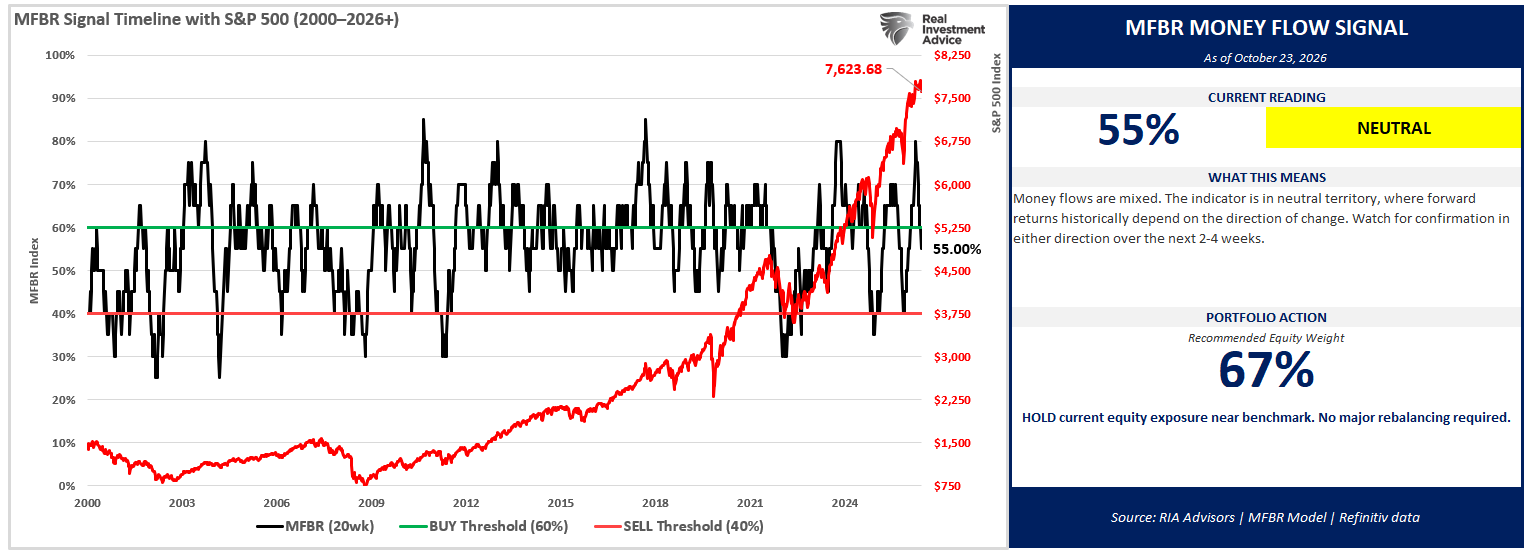
📊 MFBR Index (Money Flow/Breadth Ratio Indicator)
The Money Flow Breadth Ratio (MFBR) model is a rules-based equity allocation framework that uses weekly S&P 500 money flow data to generate buy, sell, and neutral signals. The MFBR systematically adjusts portfolio equity exposure in response to the direction and persistence of institutional capital flows. It aims to reduce drawdowns while capturing the majority of market upside.
“As of October 23, 2026, with the S&P 500 at 7,623.68, the Money Flow Breadth Ratio (MFBR) stands at 55%, down from a peak of 75% set 7 weeks ago and flat versus 55% the prior week. The trailing four-week change is still -10 percentage points, but the near-term trend has rolled over. This places the indicator in the 50-60% range. The raw zone signal reads NEUTRAL, but the model still flags a TOP REVERSAL, with 20 points now off the peak. Read that NEUTRAL as a zone label, not as fresh confirmation – the model reached this band by falling out of overbought, not by building up from below.
Bottom line: hold the target weight. The roll-over off the 75% peak is real and worth watching, but it has carried the gauge into the band that has historically been the best place to own equities. This is neither a chase nor a de-risk. A sustained break below 60% would move the grid to an underweight; a move back above 70% would re-engage the contrarian trim.”
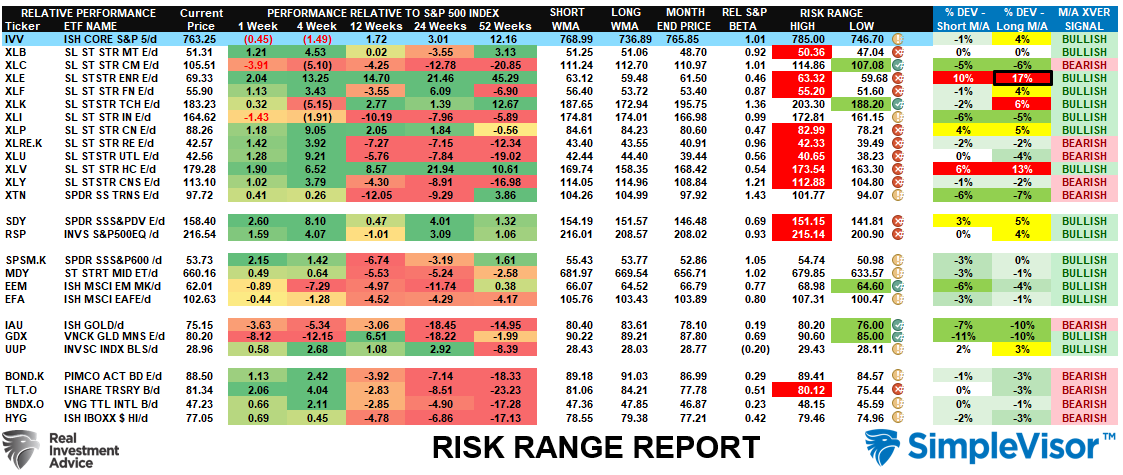
📊 Sector Model & Risk Ranges
We noted the week before last that “Energy and Technology are now extremely deviated above their long-term weekly means. Historically, such deviations lead to corrections or consolidations, so profit-taking and rebalancing are recommended.” That advice worked well this past week as the rotation from Technology to Value picked up steam. Bonds also rallied sharply as the rotation to safety accelerated. Energy remains extremely elevated above long-term means and warrants profit-taking ahead of an eventual reversion, which could be very swift.
Have a great week.
Lance Roberts, CIO, RIA Advisors
Lance Roberts is Chief Investment Strategist at RIA Advisors in Houston, Texas, and publishes his market research and the weekly Bull Bear Report at RealInvestmentAdvice.com and lanceroberts.substack.com.